Chapter 3: Data types and resources
Stephanie Kay Ashendena; Sumit Deswalb; Krishna C. Bulusuc; Aleksandra Bartosikd; Khader Shameere a Data Sciences and Quantitative Biology, Discovery Sciences, R&D, AstraZeneca, Cambridge, United Kingdom
b Genome Engineering, Discovery Sciences, BioPharmaceuticals R&D, AstraZeneca, Gothenburg, Sweden
c Bioinformatics and Data Science, Translational Medicine, Oncology R&D, AstraZeneca, Cambridge, United Kingdom
d Clinical Data and Insights, Biopharmaceuticals R&D, AstraZeneca, Warsaw, Poland
e AI and Analytics, Data Science and Artificial Intelligence, Biopharma R&D, AstraZeneca, Gaithersburg, MD, United States
Abstract
Recent innovation in the field of machine learning has been enabled by the confluence of three advances: rapid expansion of affordable computing power in the form of cloud computing environments, the accelerating pace of infrastructure associated with large-scale data collection and rapid methodological advancements, particularly neural network architecture improvements. Development and adoption of these advances have lagged in the health care domain largely due to restrictions around public use of data and siloed nature of these datasets with respect to providers, payers and clinical trial sponsors.
Keywords
Data; Omics; FAIR; Big data; SMILES; InChI
Notes on data
Recent innovation in the field of machine learning has been enabled by the confluence of three advances: rapid expansion of affordable computing power in the form of cloud computing environments, the accelerating pace of infrastructure associated with large-scale data collection and rapid methodological advancements, particularly neural network architecture improvements. Development and adoption of these advances have lagged in the health care domain largely due to restrictions around public use of data and siloed nature of these datasets with respect to providers, payers, and clinical trial sponsors.
There are many different types of data that are relevant to drug discovery and development, each with its own uses, advantages and disadvantages. The type of data needed for a task will rely on an understanding and clarity of the task at hand. With an increasing amount of data being made available, new challenges continue to arise to be able to integrate (with a purpose), use and compare these data. Comparing data is important to capture a more complete picture of a disease, of which is often complex in nature.1 One approach is to ensure that the data is FAIR, meaning that it is Findable, Accessible, Interoperable, and Reusable. A generic workflow for data FAIRification has been previously published2 and discusses seven-core steps. These steps are to identify the objective, analyze the data and the metadata, define a semantic model for the data (and metadata), make the data (and the metadata) linkable, host the data somewhere, and then assess the data.2 Other key considerations include assigning licenses and combining with other FAIR data.3
Data integration has been discussed by Zitnik and co-authors.1 There are different integration stages such as early, Intermediate, and late integration.1 These stages involve the transformation of the datasets into a single representation. This representation can then be used as input in a machine learning algorithm. In intermediate integration, many datasets are analyzed and representations that are shared between them are learnt. In late stage integration, each dataset has its own model built and these models are combined by building a model on the predictions of the previous models.1
Zitnik and co-authors1 also discuss the fact that there are many challenges in integrating data such as the sparseness of biomedical data and its complexity. The authors note that the data are often biased and/or incomplete. For example, databases containing manually created data from papers may be limited to a certain number of journals. ChEMBL4, 5 routinely extracts data from seven journals but does also include other journals not included in the seven.6 The authors note that machine learning can be used for data integration.
However, there are other concerns with integrating data beyond the technical difficulties. Sharing and privacy concerns especially in relation to clinical data are a key consideration in the pharmaceutical industry. However, sharing clinical trial data is important in improving scientific innovation.7 To this end, attempts have been made to improve clinical data sharing policies and practises8 but only a small amount of companies met such measures with many failing to share data by a specified deadline and failed to report all data requests.8 Other approaches include MELLODDY9 which aims to bring together information to accelerate drug discovery by allowing pharmaceutical companies to collaborate. MELLODDY notes that huge amounts of data are generated during the drug discovery process and their hypothesis is that working across data types and partners will improve predictive power and understanding of models in the drug discovery process.9 The large collection of small molecules with known activities can be used to enhance predictive machine learning models without exposure of proprietary information.9
Such large volumes of data are known as big data. In the medicinal field this may include omics data, clinical trials data and data collected in electronic health records. The data can be a combination of varying levels of structuredness and can be fantastic resources for information mining and machine learning projects.10 Ishwarappa and Anuradha11 discussed the five Vs of big data and explain that they correspond to:
- • Volume (the amount of data)
- • Velocity (how rapidly the data is generated and processed)
- • Value (what the data can bring)
- • Veracity (the quality of the data)
- • Variety (the structure and types of data)
Different types of data will be used for different types of analysis and will enable for a variety of questions to be answered. Later, we discuss some of the key types of data that may be used.
Omics data
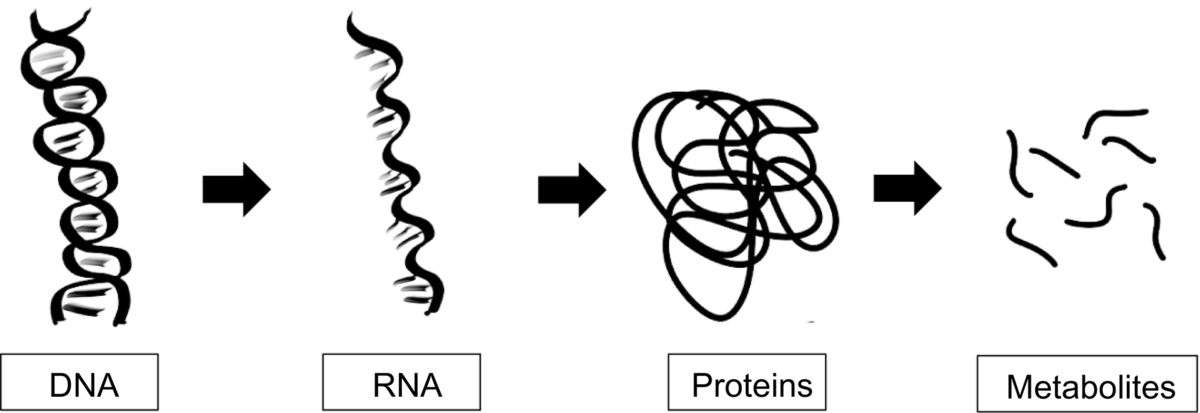
Omics studies aim to understand various organisms at the molecular level by studying specific components such as genes or proteins in both experimental and computational ways.12 Such omics include genomics (study of genes), proteomics (study of proteins), metabolomics (study of metabolites), transcriptomics (concerned with mRNA) as well as more niche omics such as lipidomics and glycomics (Fig. 1). The rise of omics data gives thanks to technical advances in areas such as sequencing, microarray and mass spectrometry,13 and omics data can be used throughout the drug discovery pipeline. For example, for identifying and validating novel drug targets13 and understanding and interpreting genetic variations in patients for personalized medicine.13, 14
Bioinformatic techniques are used throughout the omics studies to analyze the resultant data, make sense of it and derive hypotheses and conclusions. There are a wide variety of omics data types available as well as databases that contain useful information that can be exploited throughout the drug discovery process. Later, we summarize the different omics methods and include some of the key databases.
Genomics
Genomics is concerned with understanding the genes that are within a genome (it is estimated that there are 20,000–25,000 genes in the human genome), it is also concerned with how those genes interact with each other and other environmental factors.15 Specifically, genomics is concerned with interactions between loci and alleles as well as considering other key interactions such as epistasis (effect of gene-gene interactions), pleiotrophy (effect of a gene on traits), and heterosis.
Libbrecht and Noble published an article on the applications of machine learning in genetics and genomics.16 The authors discuss the different uses of supervised, semisupervised, unsupervised, generative, and discriminative approaches to modelling as well as the uses of machine learning using genetic data.16 The authors explain that machine learning algorithms can use a wide variety of genomic data, as well as being able to learn to identifier particular elements and patterns in a genetic sequence.16 Furthermore, it can be used to annotate genes in terms of their functions and understand the mechanisms behind gene expression.16
Transcriptomics
The transcriptome is the set of RNA transcripts that the genome produces in certain situations.17 Transcriptomics signals aid in understanding drug target adverse effects.18
Methods such as RNA-Seq are used to profile the transcriptome. As a method it can detect transcripts from organisms where their genomic sequence is not currently profiled and has low background signal.19 It can be used to understand differential gene expression,20 RNA-Seq is supported with next generation sequencing of which allows for large numbers of read outs.20
Transcriptomic data have been used in machine learning algorithms in cases such as machine learning diagnostic pipeline for endometriosis where supervised learning approaches were used on RNA-seq as well as enrichment-based DNA methylation datasets.21 Another use has been the development of GERAS (Genetic Reference for Age of Single-cell), which is based on their transcriptomes, the authors Singh and co-authors explain that it can assess individual cells to chronological stages which can help in understanding premature aging.22 It has also been used alongside machine learning algorithms to aid in diagnostics and disease classification of growth hormone deficiency (random forest in this case).
Metabolomics and lipomics
Metabolomics and lipidomics are concerned with the metabolome and the lipidome, respectively. Metabolomics allows for the understanding of the metabolic status and biochemical events observed in a biological, or cellular, system.13 Approaches in metabolomics includes the identification and quantification of known metabolites, profiling, or quantification of larger lists of metabolites (either identified or unknown compounds) or a method known as metabolic fingerprinting, of which is used to compare samples to a sample population to observe differences.23 Metabolomics has been combined with machine learning to identify weight gain markers (again Random Forest algorithms were used).24 Sen and co-authors have shown that deep learning has been applied to metabolomics in various areas such as biomarker discovery and metabolite identification (amongst others).25
Lipids are grouped into eight different categories including fatty acyls, glycerolipids, glycerophosolipids, sphingolipds, saccharolipds, polyketides, sterol, and prenol lipids.26 They are important in cellular functions and are complex in nature, change under different conditions such as physiological, pathological and environmental.27 Lipidomics has be used to show tissue-specific fingerprints in rat,26 shown potential in risk prediction and therapeutic studies28 and can be used through the drug discovery process.27 Fan and co-authors used machine learning with lipidomics by developing SERRF (Systematic Error Removal using Random Forest) which aids in the normalization of large-scale untargeted lipidomics.29
Proteomics
Proteomics is concerned with the study of proteins. Proteomes can refer to the proteins at any level, for example, on the species level, such as all the proteins in the human species, or within a system or organ. In addition, one of the major difficulties with proteomics is its nature to change between cells and across time.30 Questions may include understanding the protein expression level in the cell or identifying the proteins being modulated by a drug. Key areas of proteomic study involve, protein identification, protein structure, analysis of posttranslational modifications.
Typically a proteomic experiment is broken down into three key steps; the proteomics separation from its source such as a tissue. The acquisition of the protein structural information and finally, database utilization.31 Experimental procedures to separate a protein from its source involve electrophoresis where the proteins appear as lines on a gel, separated by their molecular weight.31 They are visualized by staining the gel and then preceded by acquiring an image of the gel. The proteins can be removed from the gel to be digested and put through a mass spectrometer. Sequencing is often completed by mass spectrometry methods, of which involves ionization of the sample, analysis of the mass, peptide fragmentation, and detection ultimately leads to database utilization. A typical global proteomics experiment involves profiling of several compounds to determine changes in particular proteins. By analyzing the observed abundance of the proteins across different treatment channels it is possible to observe treatment effects.
Swan and co-authors published applications of machine learning using proteomic data. The authors note that MS-derived proteomic data can be used in machine learning either directly using the mass spectral peaks or the identified proteins and can be used to identify biomarkers of disease as well as classifying samples.32 Gessulat and co-authors developed Prosit, a deep neural network that predicts the chromatographic retention time as well as the fragment ion intensity of peptides.33
Chemical compounds
Compounds are often represented in a computer readable form. The ChemmineR34 package for R35 or RDKit36 package in KNIME37 or Python (https://www.python.org/) provides example compounds for analysis.
SDF format
SDF formats (structure data files formats) were developed by Molecular Design Limited (MDL) and are used to contain chemical information such as structure. The first section contains general information about the compound, including its name, its source and any relevant comments. The counts line has 12 fields that are of fixed length. The first two give the number of atoms and bonds described in the compound. Often Hydrogens are left implicit and can be included based on valence information.38 The second block is known as the atom block (atom information encoded) and the third is known as the bond block where bond information is encoded. In the atom block, each line corresponds to each individual atom. The first three fields of each line correspond to the atoms position with its x-y-z coordinates.38 Typically the atom symbol will be represented and the rest of the line relates to specific information such as charge information.38 The bond blocks also have one line per individual block, and the first two fields index the atoms and the third field indicated the type of bond. The fourth refers to the stereoscopy.38
InChI and InChI Key format
InChI39 is a nonproprietary line notation or 1D structural representation method of which aims to be canonical identifier for structures (and thus is suitable for cross database comparisons).40 Owing to uniqueness of InChI, it has been used to derive canonical SMILES (described later) to create something called InChIfied SMILES.41 InChI key is a hashed and condensed version of the full InChI string.
It was developed by the International Union of Pure and Applied Chemistry (IUPAC) along with the National Institute of Standards and Technology (NIST). It is continually updated by the InChI Trust. InChI captures a wide variety of compound information, not limited to its stereochemistry, charge and bond connectivity information.
InChI keys were developed to allow for searching of compounds as the full InChI is too long for this. It contains 27 characters, the first 14 corresponding to the connectivity information. Separated by a hyphen is the next eight characters that include other chemical information of the structure. The following characters (each separated by a hyphen) give information about the type of InChI, the version of it and finally, the protonation information of the compound.
It has an almost zero chance of two separate molecules having the same key. It was estimated that if 75 databases each had 1 billion structures, there would be one instance of two molecules having the same InChI key. Despite this, an example of a “collision” was identified with two compounds with different formulae and no stereochemistry.42–44 This estimated rarity of collisions was experimentally tested and suggested that if uniqueness was desired it would probably need a longer hash.45
SMILES and SMARTS format
The simplified molecular-input line entry system also known as (SMILES) is one of the most commonly used.46–48 SMILES are based on molecular graph theory where the nodes of a graph are the atoms and the edges are the bonds.46, 47 Generic SMILES do not give details on the chirality or the isotopic nature of the structure (of which are known as isomeric SMILES).49
One problem with SMILES is that a single structure can be represented in multiple different SMILES strings and therefore, it is recommended to use canonicalized structures to prevent one compound being identified as multiple due to the different representations used. Daylight give an example of the ways that the SMILES string CCO can be written, including OCC, [Ch3][CH2][OH], C![]() C
C![]() O, and C(O)C.49
O, and C(O)C.49
Daylight gives an in depth explanation of the rules for generating and understanding SMILES strings49 and the common rules are summarized here. SMILES follow encoding rules, namely, the use of atomic symbols for atoms with aliphatic carbons being represented with a capital C and aromatic carbons being written with a lower case c. Brackets are used to describe abnormal valences and must include any attached hydrogens, as well as a number of + or – to indicate valance count. Absence of these will result in it being assumed there are zero hydrogens or charge. To indicate isotopic rules, the atomic symbol is preceded by its atomic mass such as [12C] or [13C]. On a side note, hydrogens are often omitted when writing SMILES strings and can be highlighted by either implicit nature (normal assumptions), explicit nature by either count (within brackets) or as explicit atoms themselves [H]. Bonds are represented by –, =, #, or : to depict single, double, triple, or aromatic bonds, respectively. Alternatively, atoms may be placed next to each other with the assumption that either a single or an aromatic bond separates them. To include direction, and / are used. Branching is dealt with within parentheses (of which can be nested) and cyclic structures contain a digit to indicate the breaking of a bond in the ring such as C1CCCCC1. Any disconnected structures are separated by a period. Dealing with tetrahedral centers can be represented by @ (neighbors are anticlockwise) or @@ (neighbors are clockwise) after the chiral atom. Many specific natures of compounds, such as tautomerization, chirality and shape, need to be explicitly specified in SMILES notation.
Extending on from SMILES is the SMARTS49 notation which is designed to aid with substructure searching. SMARTS, extend atoms and bonds by including special symbols to allow for generalized identification, for example, the use of * to denote the identification of any atom or ~ to denote any bond. Many of these rules follow the rules of logical rule matching in coding languages such as the use of an explanation mark to denote NOT this, as an example, [!C] tells us to find not aliphatic carbons.
Daylight describes the difference between SMARTS and SMILES as SMARTS describing patterns and SMILES describing molecules. In addition, SMILES are valid SMARTS.
Fingerprint format
A molecular descriptor’s role is to provide one and capture similarity and differences between compounds in a chosen dataset. There are multiple kinds of molecular descriptors that range in dimensionality (0D, 1D, 2D, 3D, and 4D). A molecular fingerprint is an example of a 1D-descriptor. It is a binary string with a list of substructures or other predefined patterns.50 They are defined before a model is trained to avoid overfitting on sparse or small datasets. If a specified pattern is found in a molecule, the corresponding bit in the binary string is set to “1,” otherwise it is set to “0.”51
Example of fingerprints are ECFP4 (extended connectivity for high dimensional data, up to four bonds), FCFP4 (functional class-based, extended connectivity), MACCS (166 predefined MDL keys), MHFP6 (for circular structures) Bayes affinity fingerprints (bioactivity and similarity searching), PubChemFP (for existence of certain substructures), KRFP (from the 5-HT 5A dataset to classify between active or inactive compounds). Sometimes it is better to create custom fingerprints than rely on predefined ones.52
Essentially the features of the molecules (such as the presence of a particular atom) are extracted, hashed, and then the bits are set.53 There are a wide host of available fingerprints that can be used as discussed in Table 1.
Table 1
| Name | Notes |
|---|---|
| MACCS54 | Substructure keys |
| Morgan55, 56 | Circular fingerprints |
| Extended-Connectivity Fingerprints (ECFP)55 | ECFP# where # is a number denoting the circle diameter. Typically, between 0 and 6 |
| Daylight57 | Path fingerprints that encode the substructure |
| Signature58, 59 | Topological descriptor |
| MHFP660, 61 | For circular structures |
| Bayes affinity fingerprints62 | Bioactivity and similarity searching |
| PubChemFP63 | For existence of certain substructures |
| KRFP (Klekota Roth fingerprint)64 | Substructure keys |
Performance of a machine learning model and prediction accuracy depends on the quality of data and descriptors and fingerprints chosen. For instance, fingerprint-based descriptors, for example, ECFP or MACCS, are recommended for active substances with functional groups located in meta or para positions.65 For genotoxicity prediction, Support Vector Machines (SVM) models perform best with PubChemFPs. However, the authors recommend combining Random Forest (RF) and MACCS fingerprints.66
Extended-connectivity fingerprints (ECFPs) were designed for structure-activity modeling of which are topological and circular.55 They are related to Morgan fingerprints, but differ in their algorithm. The ECFP algorithm is well documented55 and summarized here. Each atom is assigned an identifier of which is updated to capture neighboring atom information. Finally, any duplicate identifiers are removed (so the same feature is only represented once). Rather than a bit vector, ECFC derive a count of features.67
In comparison, to the ECFP algorithm of which has a predetermined set of iterations, Morgan fingerprints and their algorithm56 continue to have iterative generations until uniqueness is achieved. This process is described by Rodgers and Hahn55 in their extended-connectivity fingerprints paper where they explain that for Morgan fingerprints, their atom identifiers are not dependent on the atoms original numbering and uses identifiers from previous iterations after encoding invariant atom information into an initial identifier. Essentially the Morgan algorithm iterates through each atom and captures information about all possible paths through the atom, given a predetermined radius size.68 Morgan fingerprints were designed to address molecular isomorphism55 and are often used for comparing molecular similarity. These are hashed into a bit vector length (also predetermined). The iterative process involves each atom identifier in a compound and updating the information about it. For example, at iteration 0, only information about the atom is captured (as well as related bonds) whereas as the iterations increase, so does the information about the atom’s neighbors, and so on.
Two other popular fingerprints are MACCS keys and Daylight fingerprints. The Molecular ACCess System (MACCS) keys is a predefined set of 116 substructures.54 A problem with the MACCS keys is that there is no publication that defines what each of the 116 substructures are. Generally, when citing, individuals refer to a paper discussing the re-optimization of MDL keys.54, 69 Daylight fingerprints are a form of path fingerprints which enumerate across the paths of a graph and translate them into a bit vector.70 Signature fingerprints are not binary and are based on extended valence sequence.58 They are topological descriptors that also describe the connectivity of the atoms within a compound.71
Other descriptors
A molecular descriptor can be derived from experimental data or calculated theoretically. Examples of nonfingerprint molecular descriptors include reactivity, shape, binding properties, atomic charges, molecular orbital energies, frontier orbital densities, molar refractivity, polarization, charge transfer, dipole moment, electrophilicity,72 molecular and quantum dynamics.73
Molecular descriptors are generated with the use of tools, for example, PaDEL-Descriptor,74 OpenBabel,75 RDKit,36, 53 CDKit,76 and E-Dragon.77
Structural 2D descriptors perform well in models handling binary information such as classification and class probability estimation models78 and in association rules learning.79–81 There exists no universal descriptor that works best with every prediction model. However, various descriptor types can be combined as input data for a model to achieve higher performance.
There are various commercial and open-source software, databases, and servers that use molecular descriptors to predict toxic endpoints: OECD QSAR Toolbox,82 Derek Nexus,83 FAF-Drugs4,84 eTOXsys,85 TOXAlerts,86 Schrödinger’s CombiGlide87–89 Predictor, Leadscope Hazard Expert,90 VEGA,91 METEOR.83 ChemBench,92 ChemSAR,93 ToxTree,94 Lazar,95 admetSAR,96 Discovery Studio97 and Pipeline Pilot98 are ML-based tools. For more detailed information, please refer to review on computational methods in HTC by Hevener, 2018.99
Furthermore, descriptors can also be calculated for protein structures. Local descriptors have been shown to aid in the characterization of amino acid neighborhoods.100 The tool ProtDCal calculates numerical sequence and structure based descriptors of proteins.101 Another publication had the authors develop a sequence descriptor (in matrix form) alongside a deep neural network that could be used for predicting protein-protein interactions.102
Similarity measures
It is often a requested task to compare the similarity of two compounds. Different similarity metrics are summarized in Table 2. Similarity can be rephrased as comparing the distance between the compounds to evaluate how different two compounds are. For fingerprint-based similarity calculations, Tanimoto index is a popular method.110 A study compared several of these metrics comparing molecular fingerprints. They identified that the Tanimoto index, Dice index, Cosine coefficient and Soergel distance to be best and recommended that Euclidean and Manhattan distances not be used on their own.110
Table 2
| Name | Equation | Equation information |
|---|---|---|
| Tanimoto/Jaccard103, 104 | N = number of attributes in objects a and b C = intersection set | |
| Tversky105 | α = weighs the contribution of the first reference molecule The similarity measure is asymmetric106 | |
| Dice107 | AB is bits present in both A and B | |
| Manhattan106 | The more similar the fingerprint the lower the similarity score (acting more like a distance measure)106 | |
| Euclidean distance106 | !A!B represents the bits that are absent in both A and B | |
| Cosine108, 109 | x = compound x y = compound y |
The reason for comparing the similarity of compounds is that, in combinatorial library design, chemists may reject compounds that have a Tanimoto coefficient ≥ 0.85 similar to another compound already chosen from the library.111 This is for the purpose of ensuring structural diversity within the library. A study showed that by using Daylight fingerprints, and Tanimoto similarity, found that there was only a 30% chance that two compounds that were highly similar were both active, likely due to differences in target interactions.111
Eq. (1) is used for calculating the similarity of two compounds.
QSAR with regards to safety
QSAR studies involve pattern discovery, predictive analysis, association analysis, regression, and classification models that integrate information from various biological, physical, and chemical predictors. It relies on the assumption that chemical molecules sharing similar properties possess similar safety profile.81 QSAR model establishes a relationship between a set of predictors and biological activity (e.g., binding affinity or toxicity). Biological properties correlate with the size and shape of a molecule, presence of specific bonds or chemical groups, lipophilicity, and electronic properties. Biological activity can be quantified, for example, as minimal concentration of a drug required to cause the response. According to the Organization for Economic Co-operation and Development (OECD) guidelines QSAR model should have (a) a defined endpoint; (b) an unambiguous algorithm; (c) a defined domain of applicability; (d) appropriate measures for goodness-of-fit, robustness, and predictivity; and (e) mechanistic interpretation.112
The largest advantage of QSAR modeling is feature interpretability, high predictability, and diversity of available molecular descriptors. QSAR enables calculation of biological activity and reduces significantly the number of molecules that need to be synthesized and tested in vitro. QSAR method has some limitations, though. To develop a model of high prediction power and high statistical significance, large datasets are necessary as well as a preselection of predictors. Additionally, it is not always possible to deduce human dose, duration of treatment or exposure without the use of animal data. Furthermore, not all structurally similar molecules exert a similar influence in vivo. Thus an experienced human expert should define the applicability domain and scope of interpretation of QSAR prediction.
QSAR approach dates to 1962, when Hansch assumed independence of features that influenced bioactivity and developed a linear regression model. In the Hansch model (Eq. 2), authors estimated logarithm of the reciprocal of the concentration (C) using the octanol/water partition coefficient (π) and the Hammett constant (σ):
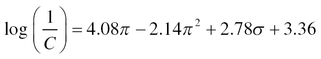
Eq. (2) represents Hansch Model.
A positive coefficient of a descriptor suggests a positive correlation between specific toxicity endpoint and that descriptor; negative coefficient is linked to negative correlation.113 Two years later, in 1964, the Free-Wilson method basing on regression analysis was developed, and the chemical structure has been used as a single variable.114 In the 1980s and 1990s, linear regression has been applied to develop toxicity prediction models with both single and multiple molecular properties as variables.
Approaches such as linear regression analysis and multivariate analysis perform well for single molecular properties prediction. However, currently, it is possible to generate many more types of molecular descriptors (1D to 4D) than it was 40 years ago, which leads to more high-dimensional datasets.81 Hence, nowadays advanced nonlinear techniques have become more popular in toxicity prediction.
In certain cases, large numbers of input features, that is, dimensions (e.g., molecular descriptors) may result in decreased machine learning model performance. This phenomenon is referred as a curse of dimensionality because sample density decreases. The data set becomes sparse. As a result, the model may overfit, which means it learns too much about each data point. To assure that model’s level of generalization is just right, preselection of preferably most relevant features may be indispensable. This process is called dimensionality reduction of n-dimensional feature space. Most common dimensionality reduction methods include: Least Absolute Shrinkage and Selection Operator (LASSO), Principal Component Analysis (PCA), Kernel Principal Component Analysis (KPCA), Linear Discriminant Analysis (LDA),115 Multidimensional Scaling (MDS), Recursive Feature Elimination (RFE), Distributed Stochastic Neighbor Embedding (t-SNE), and Sequential floating forward selection (SFFS).116
Data resources
There are many resources available for data analytics, both commercial and open. Many of these resources can be used for multiple tasks. Below contains many of the key resources used in drug discovery, however, it is worth noting that as more data is created, and gaps are identified in available resources, new resources will be developed.
Toxicity related databases
As a result of the application of high throughput screening (HTS) and development of novel chemical and biological research techniques in the 21st century, a number of publicly available repositories is rapidly growing. This enables integration of siloed information and prediction of less evident side effects resulting from synergistic effects, and complex drug-drug interactions can be discovered. In this section, we present an overview of existing data sources related to toxicogenomics, organ toxicity, binding affinity, biochemical pathways, bioactivity, molecular interactions, gene-disease linkage, histopathology, oxidative stress, protein-protein interactions, metabolomics, transcriptomics, proteomics, and epigenomics (Table 3).
Table 3
| Database name | Data type | Description | Source publication DOI |
|---|---|---|---|
| CEBS (Chemical Effects in Biological Systems) | Adverse events | Biology-focused database of chemical effects that focuses on systems toxicology | 117 |
| IntSide | Adverse events | Chemical and biological side effects database | 118 |
| MetaADEDB | Adverse events | Integrates CTD, OFFSIDES, and SIDER, focusing on ADE-drug occurrences | 119 |
| OFFSIDES | Adverse events | ADRs reported during clinical trials before drug approval | 119 |
| SIDER | Adverse events | Contains information on marketed medicines and their recorded adverse drug reactions | 120 |
| BioGRID | Molecular interactions | Genetic and protein interactions | 121 |
| Biomodels | Molecular interactions | Rate-related interactions | 122 |
| Bioplex | Molecular interactions | Immunopurification and mass spectrometry-based protein interaction database | 123 |
| HAPPI-2 | Molecular interactions | Protein-protein interactions with a confidence score | 124 |
| HPRD | Molecular interactions | Historic, no longer updated database of manually curated | 125 |
| IntAct | Molecular interactions | Open-source database system and analysis tools for molecular protein interaction data | 126 |
| InWeb_IM | Molecular interactions | Protein-protein interaction datasets with orthological predictions | 127 |
| mentha | Molecular interactions | A taxonomy browser of interactions from publications and databases | 128 |
| NRF2Ome | Molecular interactions | Manually curated human oxidative stress and NRF2 response specific database | 129 |
| OmniPath | Molecular interactions | Manually curated human signaling database | 130 |
| SignaLink2 | Molecular interactions | Manually curated signaling database with regulations and predicted interactions | 131 |
| Signor | Molecular interactions | Manually curated pathway interactions with directions and signs | 132 |
| STRING | Molecular interactions | Curated databases using text mining interactions in different species | 133 |
| KEGG (Kyoto Encyclopedia of Genes and Genomes) | Pathways | The database focuses on high-level functions of biological systems from molecular-level information | 134 |
| MsigDB (Molecular Signature Database) | Pathways | A collection of annotated gene sets for use with GSEA (Gene Set Enrichment Analysis) software | 135 |
| Pathway Commons | Pathways | Free online database of pathways, bundled with open-source data analysis tools | 136, 137 |
| PharmGKB (The Pharmacogenomics Knowledgebase) | Pathways | Manually curated collection of PGx information from the primary literature | 138, 139 |
| Qiagen IPA (Ingenuity Pathway Analysis) | Pathways | A commercial pathway analysis tool, capable of complex analysis and prediction of downstream effects | 140 |
| Reactome | Pathways | Free online database of pathways, mostly focused on human biology | 141, 142 |
| The Gene Ontology Resource | Pathways | Database of pathways from molecular to organism-level for multiple species, focusing on the function of the genes and gene products. Datapoints have annotations on multiple levels of specificity | 143 |
| WikiPathways | Pathways | Community-curated collection of pathways with links to other sources and pathway databases | 144 |
| admetSAR | Toxicity-molecule associations | An online tool for the prediction of chemical ADMET properties | 96, 145 |
| BindingDB | Toxicity-molecule associations | A database of measured binding affinities, interactions of protein drug targets and small | 146 |
| CDT (Comparative Toxicogenomics Database) | Toxicity-molecule associations | Literature-based, manually curated associations between chemicals, gene products, phenotypes, diseases, and environmental exposures | 147 |
| ChEMBLdb | Toxicity-molecule associations | An EMBL manually curated chemical database with bioactivity data | 5 |
| ChemProt | Toxicity-molecule associations | A compilation of chemical-protein-disease annotation resources for studying systems pharmacology of a small molecule from molecular to clinical levels | 148, 149 |
| DSSTox | Toxicity-molecule associations | A subset of ACToR related to toxicity | 150 |
| eChemPortal | Toxicity-molecule associations | An aggregator of chemical hazard and risk information | 151 |
| PKKB (Pharmaco Kinetics Knowledge Base) | Toxicity-molecule associations | High-quality data for experimental ADMET properties | 152 |
| PubChem | Toxicity-molecule associations | An aggregator of chemical and physical properties, biological activities, safety and toxicity information, patents, literature citations | 153 |
| SuperToxic | Toxicity-molecule associations | Compounds and toxicity information | 154 |
| T3DB (Toxic Exposome Database) | Toxicity-molecule associations | Toxins data combined with target information | 155 |
| Tox21 (Toxicology in the 21st century) | Toxicity-molecule associations | Toxicity data for commercial chemicals, pesticides, food additives/contaminants, and medical compounds | 156 |
| ToxBank Data Warehouse | Toxicity-molecule associations | An aggregator of data for systemic toxicity | 157 |
| ToxCast Database (invitroDB) | Toxicity-molecule associations | HTS assay target information, study design information and quality | 158 |
| TOXNET | Toxicity-molecule associations | An aggregator of several toxicity databases, Integrated into PubMed in 2019 | 159 |
| TTD (Therapeutic Targets Database) | Toxicity-molecule associations | Protein and nucleic acid targets, diseases, pathways | 160 |
| ECOTOX (Ecotoxicology Database) | Toxicity-molecule associations, adverse events | Adverse effects of single chemical stressors related to aquatoxicity | 161 |
| DrugBank | Toxicity-molecule associations, biological activity | A bioinformatics and cheminformatics resource on drug targets and properties of drugs | 162 |
| STITCH | Toxicity-molecule associations, pathways | Metabolic pathways, binding experiments, crystal structures, and drug-target relationships | 163 |
| Connectivity Map | Transcriptomics | Human cancer cell lines treated with various perturbants, Affymetrix GeneChip Human Genome | 164 |
| Drug Matrix | Transcriptomics | Rat Liver, kidney, heart and thigh muscle from Affymetrix GeneChip Rat Genome | 165 |
| LINCS L1000 | Transcriptomics | Microscopy data, transcripts from L1000 database | 166 |
| Open TG-GATEs | Transcriptomics | Histopathology and clinical chemistry rat’s liver, kidneys, hear and thigh muscle data, Affymetrix GeneChip Rat Genome | 167 |
| GEO (Gene Expression Omnibus) | Functional genomics data | Contains array and sequence-based data | 168 |
| ArrayExpress | Functional genomics data | Experimental data from high-throughput functional genomic tests | 169 |
| UniProt KnowledgeBase | Protein sequences and functional information | Database is split into two sections including UniProtKB/Swiss-Prot and UniProtKB/TrEMBL which respectively reflect whether the data are manually annotated and reviewed or not | 170–172 |
| Protein Databank | Protein information | Contains information about the “3D shapes of proteins, nucleic acids and complex assemblies” | 173, 174 |
| PRIDE | Proteomics | Repository of MS derived proteomics data | 175–177 |
| ProteomeDB | Proteomics | Aim to aid in the identification of the proteome | 178 |
| GnomAD (Genome Aggregation Database) | Sequencing data | Exome and genome sequencing data that has been combined from large-scale sequencing projects | 179 |
| WITHDRAWN | Withdrawn drugs | Contains withdrawn and discontinued drugs | 180 |
| DISGeNET | Target-disease information | Target-disease relationships | 181 |
| Open Targets | Target-disease information | Target-disease relationships | 182 |
| Clinical Pharmacology and British Pharmacology Society Guide to Pharmacology Database | Target and ligand information | Resource on targets and ligands | 183 |
| SuperTarget | Target-drug information | Target-drug information | 184 |
| GOSTAR | Target compound database | Manually curated target-compound database from literature and patents | 185 |
| SureChembl | Patent data | Open-source patent data | 186 |
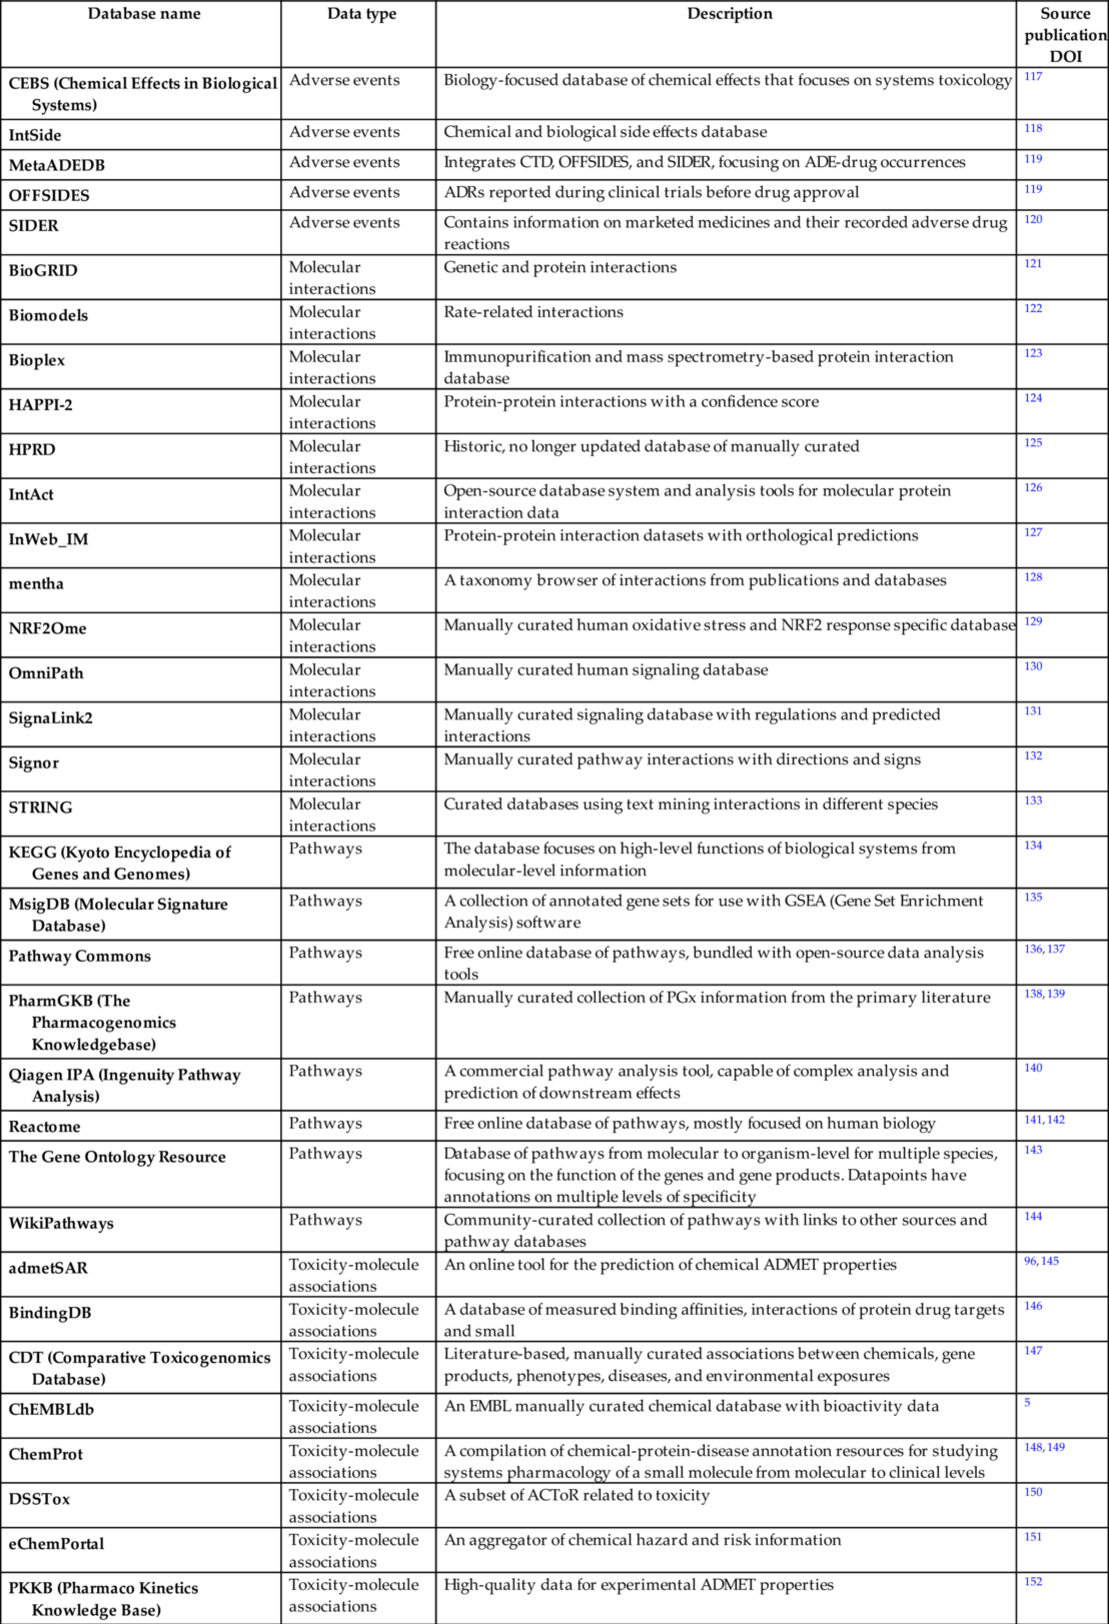
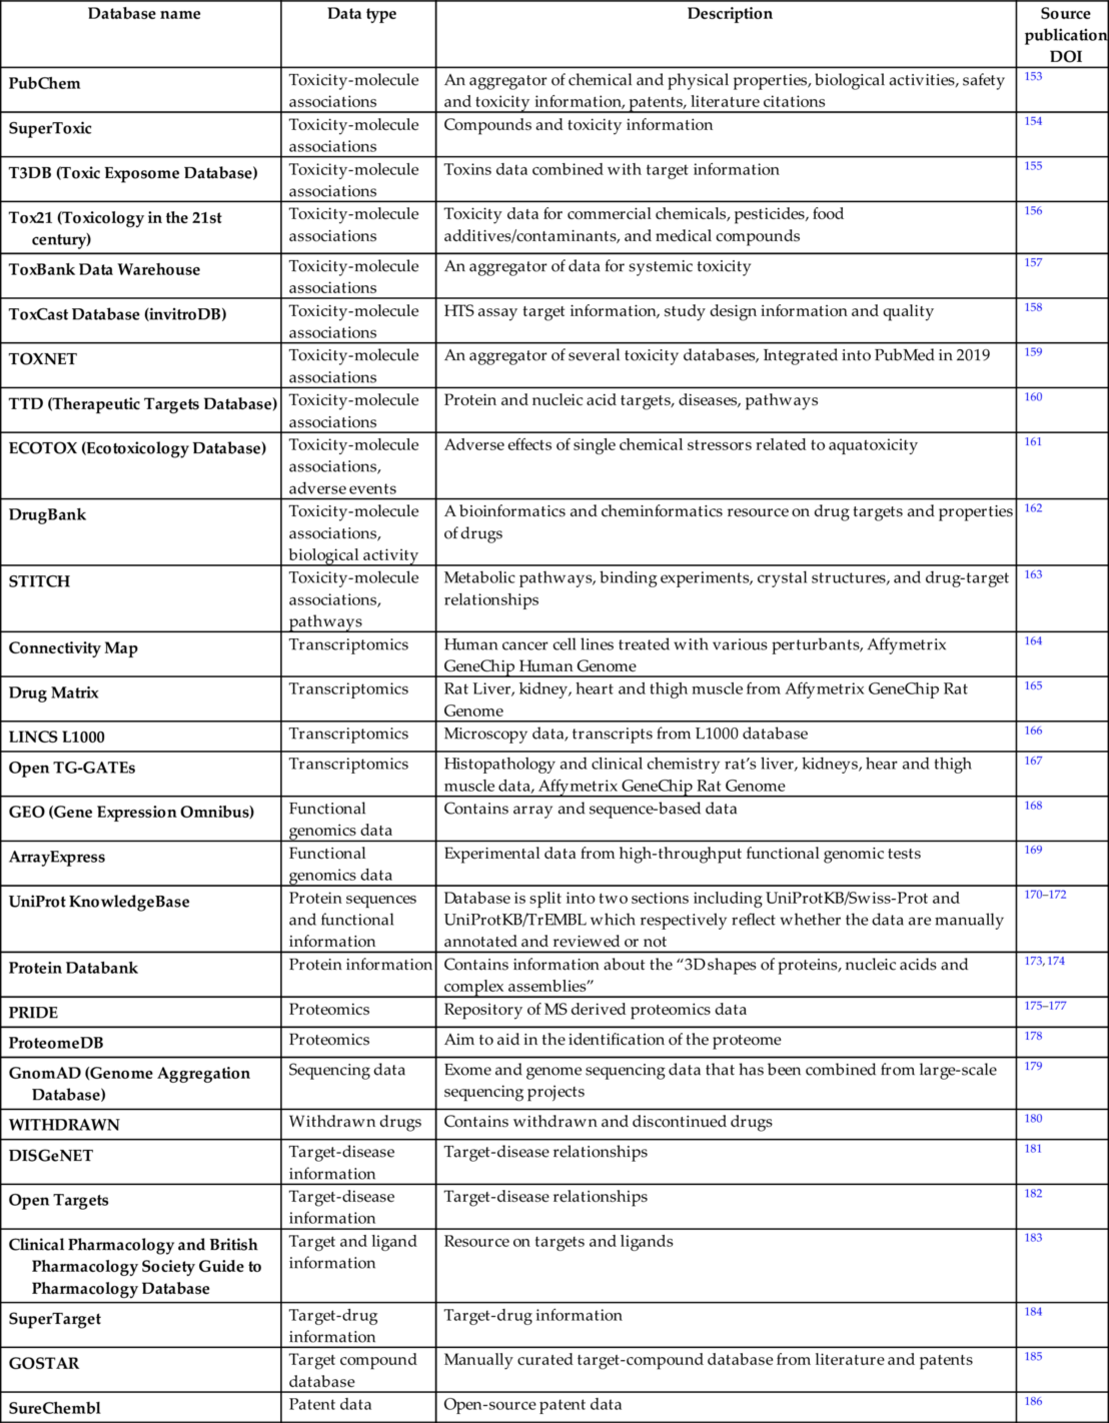
TOXNET187 is an aggregator of other toxicity-related databases on breastfeeding and drugs, developmental toxicology literature, drug-induced liver injury, household product safety, and animal testing alternatives. TOXNET is available via PubMed since December 2019. ToxCast158 and ECOTOX161 are two databases created by the US Environmental Protection Agency. They contain high-throughput and high-level cell response data related to toxicity and environmental impact of over 1800 chemicals, consumer products, food and cosmetic additives. Tox21156 is a collaborative database between some of the US Federal Agencies that aggregates toxicology data on commercial chemicals, pesticides, food additives, contaminants, and medical compounds? ToxBank Data Warehouse157 stores systemic pharmacology information and additionally integrates into models predicting repeated-dose toxicity. PubChem153 and DrugBank162 are not purely toxicology databases; however, they collect bioactivity and biomolecular interactions data as well as clinical and patent information, respectively. ChEMBL188 and CTD147 databases contain manually curated data on chemical molecule and gene or protein interactions, chemical molecule and disease as well as gene and disease relationships. There exist various online public resources devoted to drug side effects: SIDER,120 OFF-SIDES,189 and CEBS.66 These data are integrated with pathway-focused sites, for example, KEGG,190 PharmGKB,138 and Reactome,141 which are curated and peer-reviewed pathway databases. The following table contains the main ones, however, it is not exhaustive.
A large number of molecular-omics data is present in the public domain and allow for reusing and exchange data from between experiments. High-dimensional and noisy biological signals used in, for example, differential gene expression, gene co-expression networks, compound protein-protein interaction networks, signature matching and organ toxicity analysis, often require a standardized ontology as well as manual data curation before they can be used to train a model.18 However, the following public databases offer relatively high-quality data. DrugMatrix191 contains in vivo rat liver, kidney, heart and thigh muscle from Affymetrix GeneChip Rat Genome 230 2.0 Array GE Codelink and Open TG-GATEs167 contain rat liver and kidney data. The latter also contains human and rat in vitro hepatocytes histopathology, blood chemistry and clinical chemistry data. Toxicity data for five human cancer cell lines derived from the Affymetrix GeneChip Human Genome U133A Array are stored in the Connectivity Map.164 Microscopy images of up to 77 cell lines treated with various chemical compounds and gene expression data can be found in the Library of Integrated Network-based signatures L1000 (LINCS dataset).164
Many of the resources above have multiple applications. A wide variety of resources are available for proteomic studies from the EBI including UniProt KnowledgeBase (UniProtKB) and PRIDE.192 Uniprot provides freely accessible resources of protein data such as protein sequences and functional information. UniProtKB is included in these resources.170–172 It is split into two sections namely, the manually annotated and reviewed section known as UniProtKB/Swiss-Prot. The second section, UniProtKB/TrEMBL refers to the computationally annotated and nonreviewed section of the data. Owing to be computationally annotated, EBI states that there is high annotation coverage of the proteome.172 These data can be used to find evidence for protein function or subcellular location.172 Finally, PRIDE incudes protein and peptide identifications (such as details of posttranslational modifications) alongside evidence from mass spectrometry.175–177
This growth in the number of data repositories and databases has been fueled by the large amount of proteomic data generated.175 The Protein DataBank is concerned with structural protein information such as the 3D shape if the protein and is maintained by the RCSB.173, 174
To deal with this, The HUPO Proteomics Standards Initiative,193 or HUPO-PSI for short, was developed to ensure the universal adoption of stable data formats that has resulted in aggregation of proteomic data.175 The HUPO-PSI’s about section states that these standards were developed “to facilitate data comparison, exchange and verification”.193 However, it does not deal with the quality of data and the issues that brings.
Other key resources include WITHDRAWN180 of which contains information about withdrawn and discontinued drug, DISGeNET181 and Open Targets182 for target-disease relationships. The Clinical Pharmacology and British Pharmacology Society Guide to Pharmacology Database183 also contains target information and information about a variety of ligands. GOSTAR185 and SureChEMBL194 both contain information on target-compound information from patents with GOSTAR also containing that information available from literature.
Drug safety databases
To monitor, systematically review, and enable data-driven decisions on drug safety, WHO Collaborating Monitoring Centre in Uppsala195 and National Competent Authorities (NCAs) maintain several databases dedicated to safety signals collection (Fouretier et al., 2016). The largest and the oldest ones are WHO VigiBase (1968), EU Eudravigilance, FDA FAERS, and VAERS, but most countries have established their own databases supported by Geographical Information Systems (GIS).196 Geolocalization allows using these databases to detect both global and local trends. Table 4 presents an overview of the largest publicly accessible databases related both to postmarketing surveillance, unsolicited reporting, and solicited reporting from clinical trials.
Table 4
| Database name | Organization | Reporters | Content |
|---|---|---|---|
| VigiBase | Uppsala Monitoring Centre, WHO | MAHs, HCPs, consumers or any regional center | Twenty million ICSRs from 125 member states and 28 associate members on medicinal product-related suspected adverse events; postmarketing spontaneous severe and nonserious cases ICSRs, sometimes clinical trials, literature Related tools: WHO-ART, MedDRA, WHO ICD, WHODrug, VigiSearch VigiLyz, VigiMin, ICD, VigiAccess |
| Eudravigilance | EMA | MAH, NCAs, EEA sponsors of clinical trials | 14.5 million ICSRs; Clinical Trial Module (EVCTM); Post-Authorization Module (EVPM) Related tools: EVDAS, Addreports.eu, MedDRA |
| FAERS | FDA | MAH, HCPs, consumers | Over 19 million postmarketing surveillance adverse event reports related to medications. Causality analysis not required for submission Related tools: Sentinel Initiative, FAERS Public Dashboard, AERSMIne, Open Vigil |
| VAERS | FDA, CDC | MAH, HCPs, consumers | 700,000 postmarketing surveillance adverse event reports related to vaccines including unverified reports, misattribution, underreporting, and inconsistent data quality, Related tools: empirical Bayes and data mining tools built-in |
| Adverse Event Reports for Animal Drugs and Devices | FDA, Center for Veterinary Medicine | Veterinary professionals, consumers | Voluntary AE submission, database contain postmarketing surveillance adverse event reports related to animal drugs including drugs, supplements, vitamins |
| Yellow Card | MHRA, Commission on Human Medicines | HCP, hospital and community pharmacists, members of the public | ICSRs on medicines, OTCs, vaccines, herbal preparations and unlicensed medicines, e-cigarettes, counterfeit drug reports, defective medicinal products. Interactive Drug Analysis Profile IDAPs) can be downloaded for each drug Related tools: Android app, built-in analytics |
| Canada Vigilance Adverse Reaction | Health Canada | HCP, MAHs | Clinical and postmarket surveillance SAE reports prescription and nonprescription medications; natural health products; biologics (includes biotechnology products, vaccines, fractionated blood products, human blood and blood components, as well as human cells, tissues and organs); radiopharmaceuticals; and disinfectants and sanitizers with disinfectant claims |
| DAEN—medicines | Australian Department of Health TGA | HCPs, MAHs, members of public, therapeutic goods industry | ADR reports on adverse events related to medicines and vaccines used in Australia |
| LAREB | Netherlands Pharmacovigilance Centre Lareb | HCPs, community pharmacists, members of the public | Downloadable reports with preprocessed data and literature related to ADR reporting in the Netherlands |
| PROTECT | EMA and partners | None | PROTECT ADR database is a downloadable Excel file listing of all MedDRA preferred terms or low-level terms adverse drug reactions (ADRs), text mined Summary of Product Characteristics (SPC) of medicinal products authorized in the EU, automated mapping of ADR terms, fuzzy text matching, expert review |
| SIDER | EMBL | None | Postmarket surveillance, extracted from public documents and package leaflets and Summary of Product Characteristics include side effect frequency, drug and side effect classifications, links to drug target relations, top-down database |
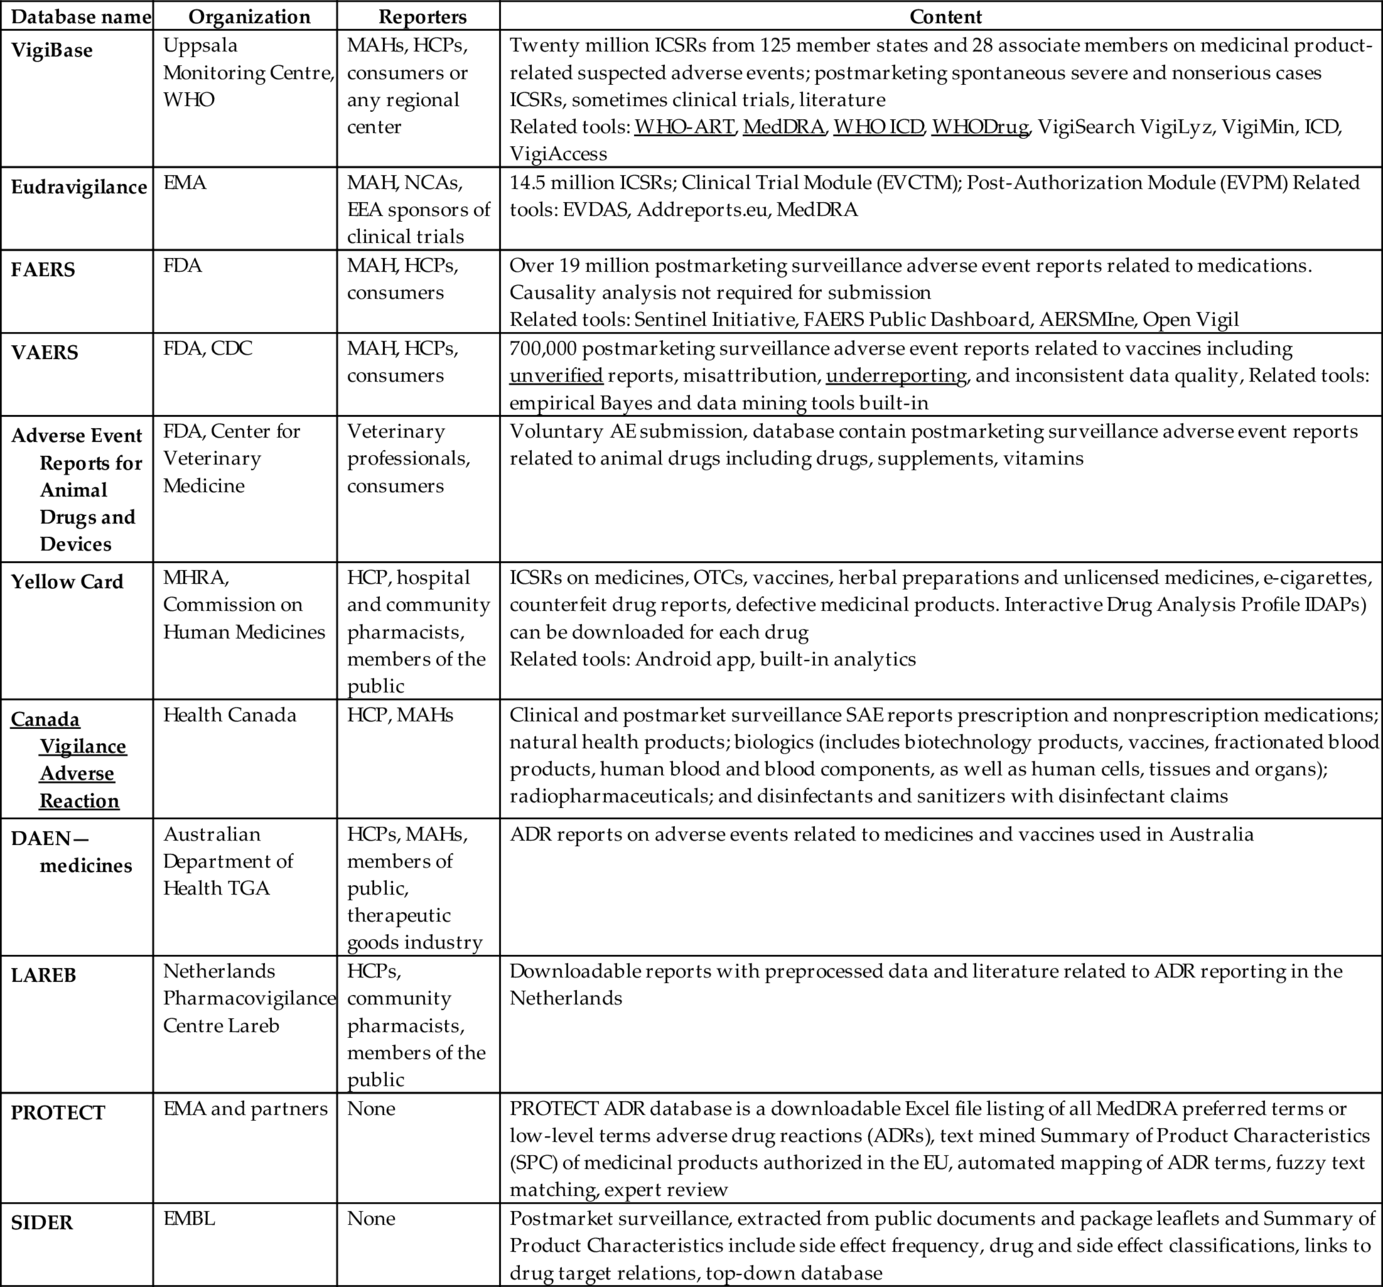
Database contain both solicited and unsolicited data.
Majority of the unsolicited resources is unstructured, fragmentary, unstandardized and suffering from the presence of confounders. Although WHO, ICH, and NCAs have taken a considerable standardization effort, the quality of ADR, reports vary across countries.197 Additional curation of the data in indispensable as databases contains duplicates, missing data points, and it has high sample variance.
Furthermore, cases when patients were administered drugs as intended and no ADR occurred, are naturally not reported. From the perspective of data analysis and developing machine learning models lack their presence in a dataset results in class imbalance, survivorship bias and high numbers of false positives in predictions.198 Thus, one cannot calculate the rate of occurrence for the whole population basing on spontaneous resources only. Otherwise, the risk of false-positive reporting for certain medicines may be artificially elevated.199 Finally, statistical significance in a model does not always mean clinical relevance. A majority of patients might be likely to respond better to certain medications statistically. However, some atypical side effects may occur that lower the quality of life of a small number of patients and hence outweigh the benefits.
Finally, longitudinal patient medical history may not always be easily retrieved, and thus it is challenging to verify reported information as well as establish causality understood as in ICH-E2A guideline.200 Reports submitted to SRS databases are subjective and often contain inconsistent records when compared with original medical documentation.
Key public data-resources for precision medicine
This section describes many completed and ongoing efforts to generate large-scale datasets from cell lines, patients and healthy volunteers. These datasets are a necessary asset that will be used to generate novel AI/ML-based models to guide precision medicine.
Resources for enabling the development of computational models in oncology
Beginning with the characterization of NCI60 cell lines for predicting drug sensitivity, there has been enormous number of large-scale studies to generate genomics, proteomics, functional genomics, or drug sensitivity datasets that can be utilized to predict cancer cells sensitivity to a targeted agent (Table 5). Among them Cancer Cell Line Encyclopedia (CCLE) project by the BROAD Institute is one of the most comprehensive. In its first round in 2012, CCLE included gene expression, copy number and mutation profile data for 947 cell lines, and pharmacological profile for 24 anticancer drugs in 479 of the cell lines. In 2019, project extended to include data on RNA sequencing (RNAseq; 1019 cell lines), whole-exome sequencing (WES; 326 cell lines), whole-genome sequencing (WGS; 329 cell lines), reverse- phase protein, array (RPPA; 899 cell lines), reduced representation bisulfite sequencing (RRBS; 843 cell lines), microRNA expression profiling (954 cell lines), and global histone modification profiling (897 cell lines) for CCLE cell lines. In addition, abundance of 225 metabolites was measured for 928 cell lines. An additional project from Genentech profiles gene expression, mutations, gene fusions and expression of nonhuman sequences in 675 human cancer cell lines. MLCP project characterized the proteome of the human cancer cell lines. Two resources that include the drug sensitivity data are Genomics of Drug Sensitivity (GDSC) from the Sanger Institute and the Cancer Therapeutics Response Portal (CTRP) from the BROAD institute.208, 218, 219 By generating expression data (and making it public) that indicates how cells respond to various genetic and environmental stressors, the LINCS project from the NIH helps to gain a more detailed understanding of cell pathways.164, 220
Table 5
| Resource | Biological material | Omics readout (#cell lines) | Weblink | Last update | Reference |
|---|---|---|---|---|---|
| NCI-60 | 60 cancer cell lines | Drug sensitivity (> 100,000 compounds), SNV, CNV, RNAseq, DNA methylation | https://discover.nci.nih.gov/cellminer/ | 201 | |
| McDermott et al | 500 cell lines | Drug sensitivity (14 kinase inhibitors) | 2007 | 202 | |
| GSK | 311 cell lines | Drug sensitivity (19 compounds) | 2010 | ||
| CCLE | ~ 1000 cancer cell lines | WES (326), WGS (329) RNAseq (1019), Methylation (RRBS, 843), RPPA (899), microRNA profiling (954), global histone modifications (897), drug sensitivity (24 compounds, 479) and metabolic profiling for 225 metabolites (928) | https://portals.broadinstitute.org/ccle | May 2019 | 203–205 |
| GDSC | 1001 cell lines, 453 compounds | Transcription (microarray) Methylation (Infinium HumanMethylation450 BeadChip arrays) Drug sensitivity | https://www.cancerrxgene.org/ | July 2019 | 206, 207 |
| CTRP | 481 Compounds across 860 cancer cell lines | Drug sensitivity | http://portals.broadinstitute.org/ctrp.v2/ | 208 | |
| Genentech | 675 human cancer cell lines | RNA-seq and SNP array analysis | https://www.nature.com/articles/nbt.3080 | 2015 | 209 |
| Connectivity Map | Nine cell lines | 1,319,138 L1000 profiles from 42,080 perturbagens (19,811 small molecule compounds, 18,493 shRNAs, 3,462 cDNAs, and 314 biologics), corresponding to 25,200 biological entities (19,811 compounds, shRNA and/or cDNA against 5075 genes, and 314 biologics) for a total of 473,647 signatures | http://www.lincsproject.org/ https://clue.io/cmap | 2017 | 164, 210 |
| MCLP | Cell lines | RPPA | https://tcpaportal.org/mclp/#/ | 211 | |
| Cheng et a.l | 15 HPV and 11 HPV + HNSCC cell lines | Whole exome sequencing and RNA-seq | Oct 2018 | 212 | |
| TCGA | > 11,000 primary cancer and matched normal samples spanning 33 cancer types | Genomic, methylation (Infinium HumanMethylation450 BeadChip arrays), transcriptomic and proteomics (RPPA) | https://www.cancer.gov/about-nci/organization/ccg/research/structural-genomics/tcga | 213 | |
| ICGC | 86 cancer projects across 22 sites, ~ 25,000 patients | Genome sequencing | https://icgc.org/ | 214 | |
| TCPA | 8167 tumor samples | RPPA | https://tcpaportal.org/tcpa/ | ||
| CPTAC | Cancer patients, primary tumor and the adjacent tissue. 45 total studies for 10 tissue types, resulting in a total of 2696 samples | Phosphoproteomics, proteomics, transcriptomics, SCNA, mutations | https://cptac-data-portal.georgetown.edu/ | May, 2019 | 215, 216 |
| Dong-Gi mun et al. | Paired tumor and adjacent normal tissues, as well as blood samples, from 80 patients with EOGCs under 45 years of age | Exome sequencing, RNA-seq, global proteome, 26 ummariz-proteome and glycoproteome | 217 |
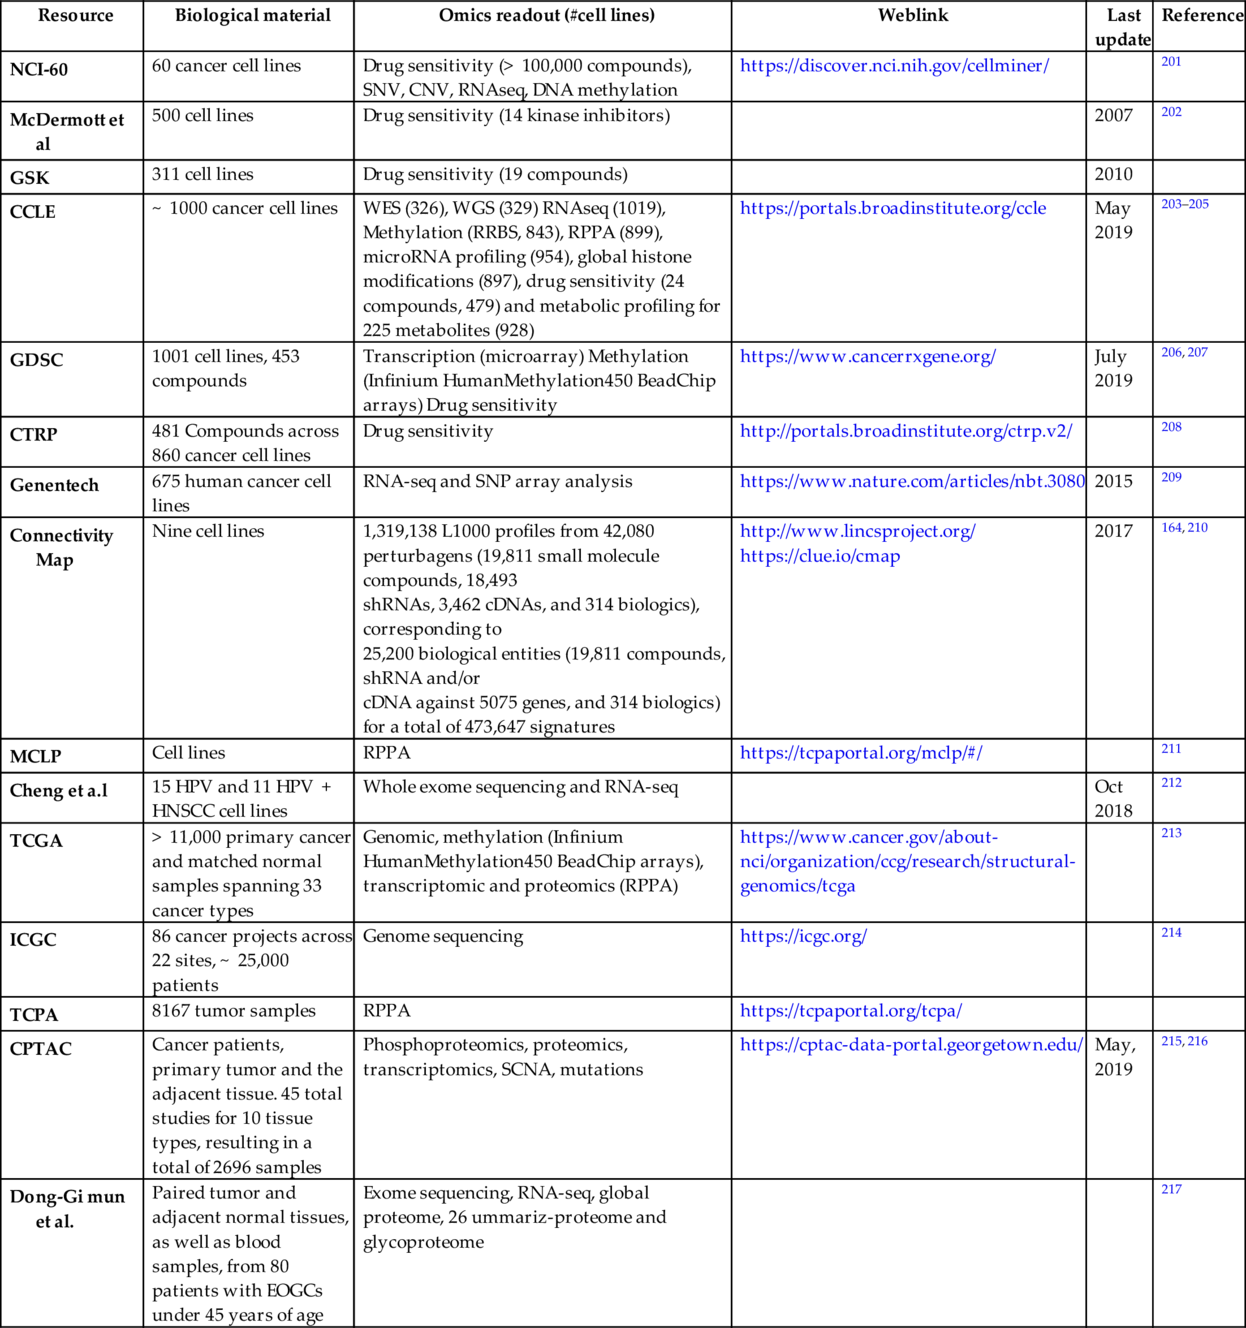
Abbreviations: NCI60, National Cancer Institute collection of 60 cell lines; CCLE, Cancer Cell Line Encyclopedia; GDSC, genomics of drug sensitivity in cancer; COSMIC, Catalogue of Somatic Mutations in Cancer; TCGA, the cancer genome atlas; MCLP, MD Anderson Cell Lines Project; CPTAC, Clinical Proteomic Tumor Analysis Consortium; RPPA, reverse phase protein array.
Although cancer cell line data is crucial for many insights and some of the large-scale experiments such as CRISPR functional genomics screens can only be done in cell lines, primary data on patients is vital to understand and modeling of human disease.
Several large consortiums/projects took this challenge of characterizing tumor samples in various genomics, epigenomics, and proteomics aspects. Prominent among them is the cancer genome atlas (TCGA) which has sequenced and characterized more than 11,000 patient samples in 33 cancer types.213 International cancer genome consortium (ICGC) is another consortium of several national projects to sequence the cancer samples.214 The Cancer Proteome Atlas (TCPA) performed RPPA analysis on more than 800 samples and Clinical Proteomic Tumor Analysis Consortium (CPTAC) launched in 2011 by NCI pioneered the integrated proteogenomic analysis of colorectal, breast, and ovarian cancer.215 These efforts revealed new insights into these cancer types, such as identification of proteomic-centric subtypes, prioritization of driver mutations, and understanding cancer-relevant pathways through posttranslational modifications. The CPTAC has produced proteomics data sets for tumor samples previously analyzed by TCGA program.
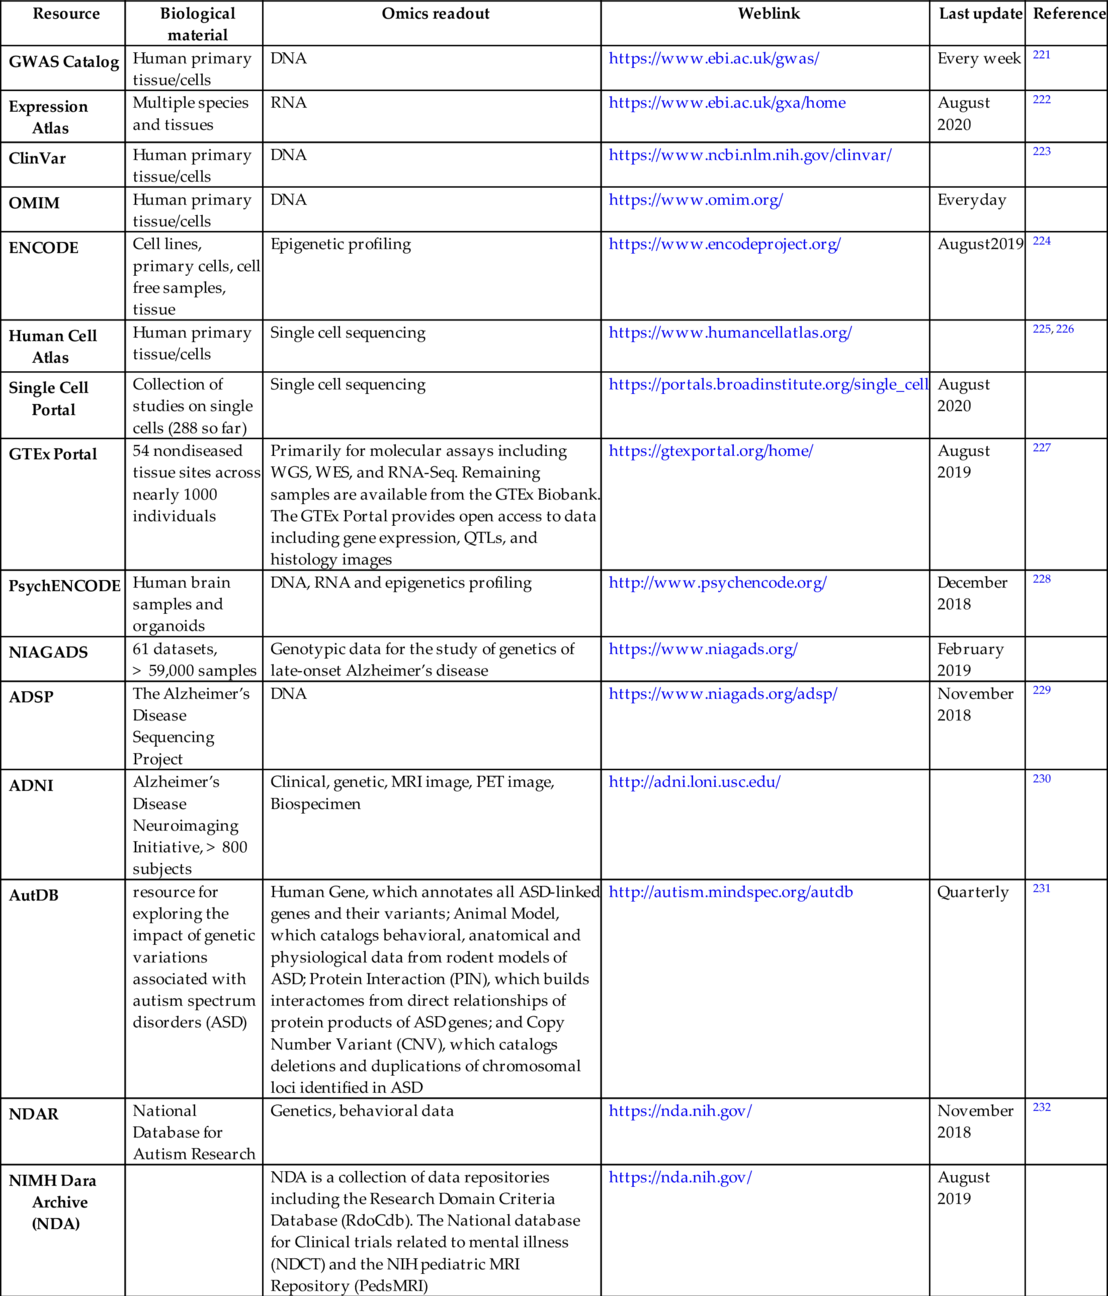
Key genomic/epigenomic resources for therapeutic areas other than oncology
There are multitudes of ongoing projects outside oncology domain for large-scale data generation. Some of them are summarized in Table 6.
Table 6
| Resource | Biological material | Omics readout | Weblink | Last update | Reference |
|---|---|---|---|---|---|
| GWAS Catalog | Human primary tissue/cells | DNA | https://www.ebi.ac.uk/gwas/ | Every week | 221 |
| Expression Atlas | Multiple species and tissues | RNA | https://www.ebi.ac.uk/gxa/home | August 2020 | 222 |
| ClinVar | Human primary tissue/cells | DNA | https://www.ncbi.nlm.nih.gov/clinvar/ | 223 | |
| OMIM | Human primary tissue/cells | DNA | https://www.omim.org/ | Everyday | |
| ENCODE | Cell lines, primary cells, cell free samples, tissue | Epigenetic profiling | https://www.encodeproject.org/ | August2019 | 224 |
| Human Cell Atlas | Human primary tissue/cells | Single cell sequencing | https://www.humancellatlas.org/ | 225, 226 | |
| Single Cell Portal | Collection of studies on single cells (288 so far) | Single cell sequencing | https://portals.broadinstitute.org/single_cell | August 2020 | |
| GTEx Portal | 54 nondiseased tissue sites across nearly 1000 individuals | Primarily for molecular assays including WGS, WES, and RNA-Seq. Remaining samples are available from the GTEx Biobank. The GTEx Portal provides open access to data including gene expression, QTLs, and histology images | https://gtexportal.org/home/ | August 2019 | 227 |
| PsychENCODE | Human brain samples and organoids | DNA, RNA and epigenetics profiling | http://www.psychencode.org/ | December 2018 | 228 |
| NIAGADS | 61 datasets, > 59,000 samples | Genotypic data for the study of genetics of late-onset Alzheimer’s disease | https://www.niagads.org/ | February 2019 | |
| ADSP | The Alzheimer’s Disease Sequencing Project | DNA | https://www.niagads.org/adsp/ | November 2018 | 229 |
| ADNI | Alzheimer’s Disease Neuroimaging Initiative, > 800 subjects | Clinical, genetic, MRI image, PET image, Biospecimen | http://adni.loni.usc.edu/ | 230 | |
| AutDB | resource for exploring the impact of genetic variations associated with autism spectrum disorders (ASD) | Human Gene, which annotates all ASD-linked genes and their variants; Animal Model, which catalogs behavioral, anatomical and physiological data from rodent models of ASD; Protein Interaction (PIN), which builds interactomes from direct relationships of protein products of ASD genes; and Copy Number Variant (CNV), which catalogs deletions and duplications of chromosomal loci identified in ASD | http://autism.mindspec.org/autdb | Quarterly | 231 |
| NDAR | National Database for Autism Research | Genetics, behavioral data | https://nda.nih.gov/ | November 2018 | 232 |
| NIMH Dara Archive (NDA) | NDA is a collection of data repositories including the Research Domain Criteria Database (RdoCdb). The National database for Clinical trials related to mental illness (NDCT) and the NIH pediatric MRI Repository (PedsMRI) | https://nda.nih.gov/ | August 2019 |
Resources for accessing metadata and analysis tools
Accessing and analyzing raw sequencing data can be quite cumbersome for most biologists. Resources that present analyzed or easy to grasp data on genetic alterations as well as pathway level analysis are very helpful. Several such resources that can be used directly for hypothesis generation/verification exist. Some of these are listed in Table 7.
Table 7
| Database | Content | Omics readout | Weblink | Last update | Reference |
|---|---|---|---|---|---|
| COSMIC | Tumor samples and > 1000 cell lines | Expert curated database of somatic mutations | https://cancer.sanger.ac.uk/cosmic | V92, August 2020 | 233 |
| Cancer DepMap | Data from CCLE, TCGA, GDSC, RNAi and CRISPR screens | Genomics, proteomics, RNAi/CRISPR screens and drug sensitivity | https://depmap.org/portal/ | Every 90 days | |
| Cell Model Passports | Cell lines and organoids | Mutations, expression, CNV, methylation, fusions, drug response, CRISPR score | https://cellmodelpassports.sanger.ac.uk/passports | 234 | |
| cBioPortal | The portal hosts a total of 263 cancer studies including CCLE and TCGA data | Mutations, CNV, RNAseq, RPPA | http://www.cbioportal.org/ | 235 | |
| TCGA-CDR | Clinical data resource for high quality survival outcome analytics | Survival data | See reference | 236 | |
| mSigDB | Annotated gene sets for use with GSEA | Gene sets | http://software.broadinstitute.org/gsea/msigdb/index.jsp | 237 | |
| Enricher | Annotated gene sets for use with GSEA | Gene sets | https://amp.pharm.mssm.edu/Enrichr/ | 238 | |
| GeneMANIA | Hypothesis generation regarding function of a gene | Multiple omics-based data | https://genemania.org/ | 239 | |
| L1000CDS2 | LINCS L1000 characteristic direction signature search engine | Finds consensus L1000 small molecule signatures that match user input signatures | https://amp.pharm.mssm.edu/L1000CDS2/#/index | 240 | |
| Geneshot | Ranking genes based on text mining | Literature, expression data | https://amp.pharm.mssm.edu/geneshot/ | 241 |
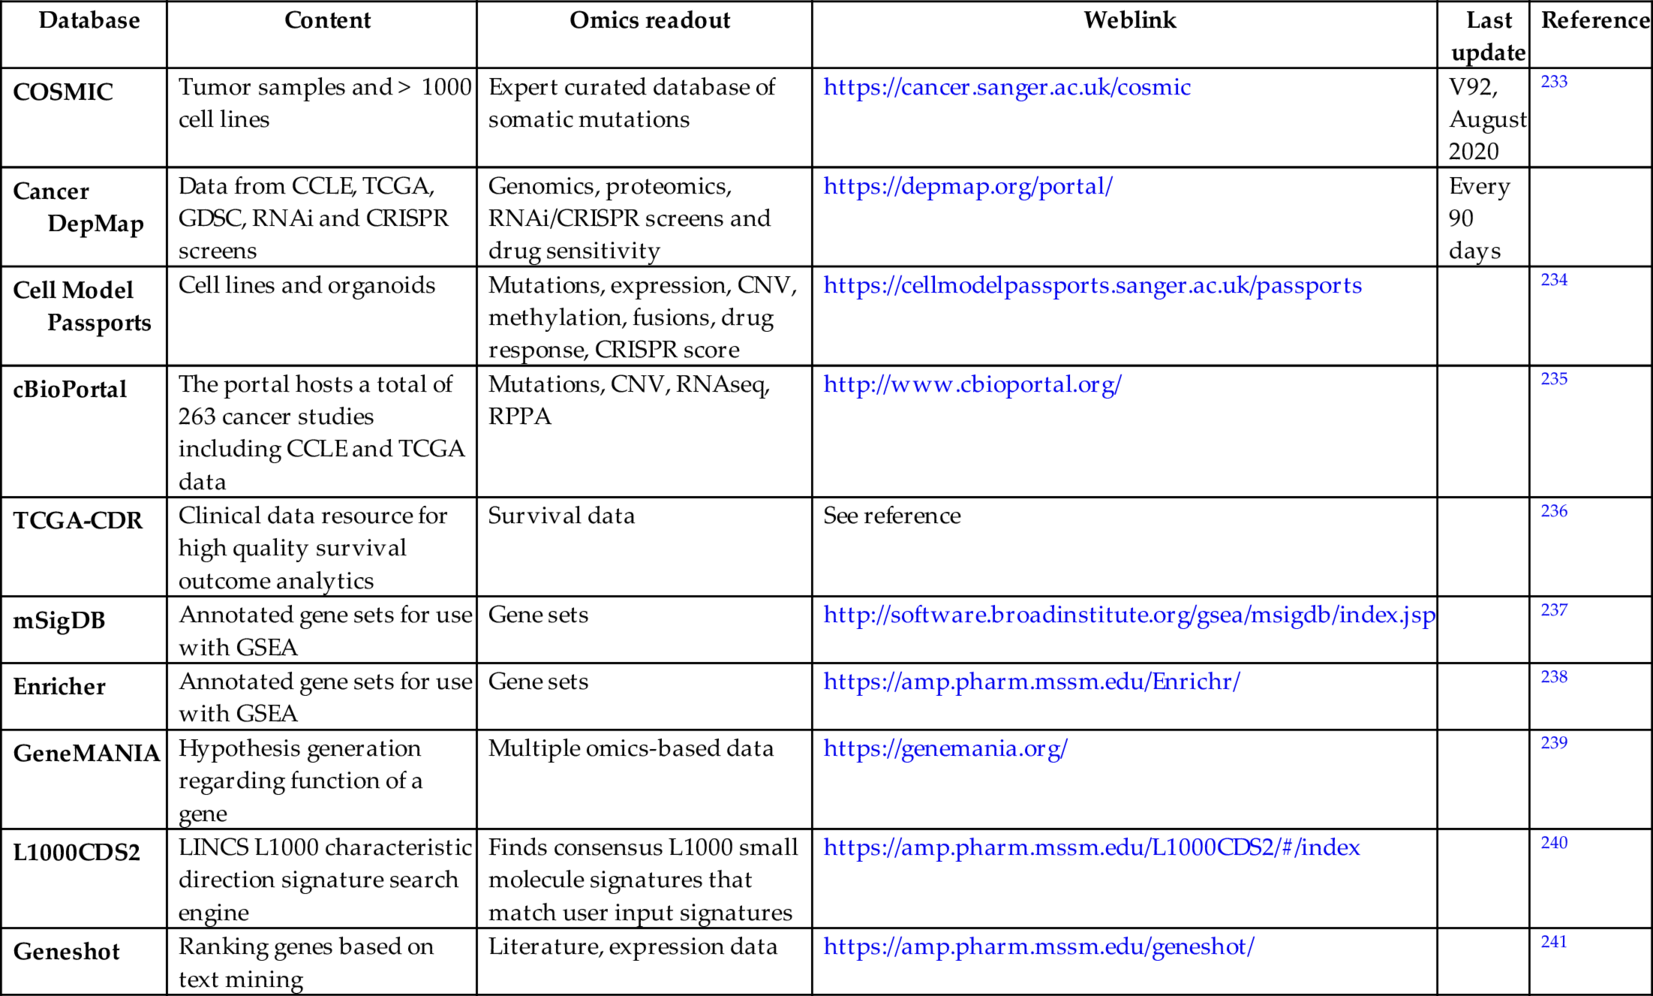
Fig. 2 recapitulates progress on data generation frontier that include drug screening in cell lines, functional genomics (RNAi and CRISPR) screens, detailed characterization of cell lines and finally exome or whole genome sequencing of patients and healthy volunteers. Some of these data were already used employing AI/ML-based approaches to identify novel synthetic lethality pairs, predict drug IC50, or even clinical outcome prediction.207, 242, 243 By designing an AI algorithm to analyze CT scan images, researchers have created a radiomic signature that defines the level of lymphocyte infiltration of a tumor and provides a predictive score for the efficacy of immunotherapy in the patient.244 Gene expression profile analysis of needle biopsy specimens was performed from the livers of 216 patients with hepatitis C-related early-stage cirrhosis who were prospectively followed up for a median of 10 years. Evaluation of 186-gene signature used to predict outcomes of patients with hepatocellular carcinoma showed this signature is also associated with outcomes of patients with hepatitis C-related early-stage cirrhosis.245 Recently, whole-genome sequencing was used to accurately predict profiles of susceptibility to first-line antituberculosis drugs.246
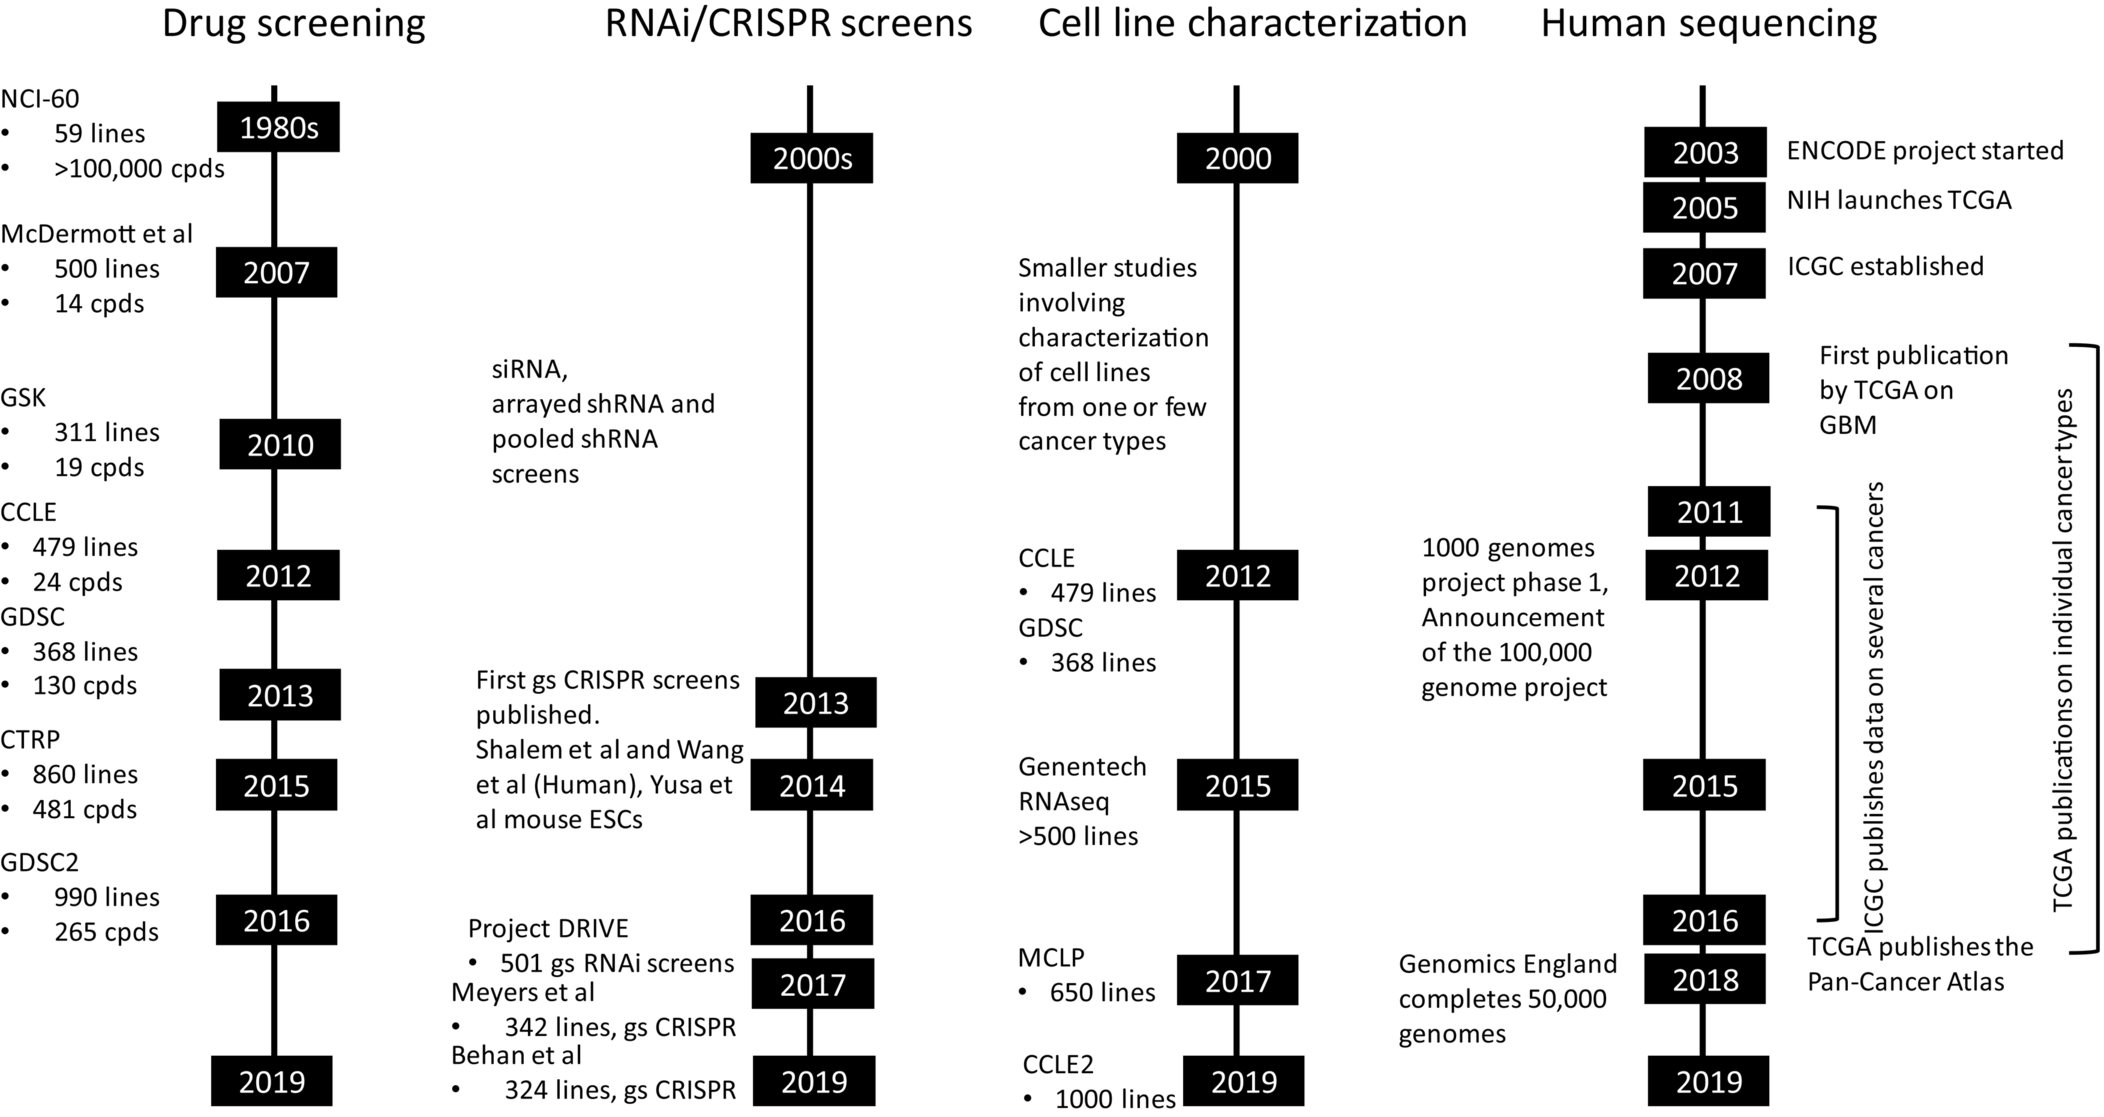
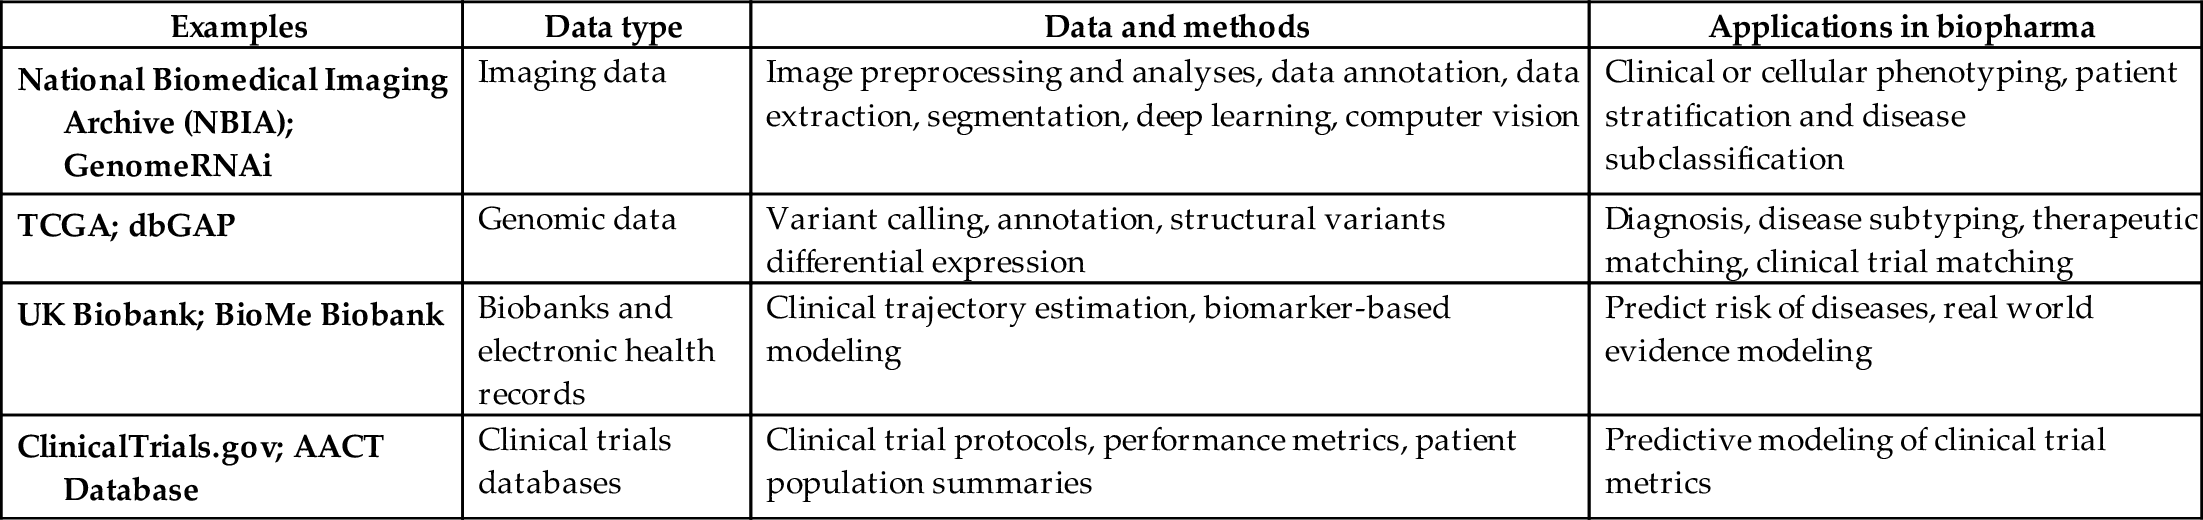
Table 8 lists some of the examples of historical data sets, potential methods to analyze them, and their respective applications in biopharma. The recent innovation in the field of AI has been enabled primarily by the confluence of rapid advances in affordable computing power in the form of cloud computing, infrastructure to process and manage large-scale data sets and architectures and methodologies such as neural networks.
Table 8
| Examples | Data type | Data and methods | Applications in biopharma |
|---|---|---|---|
| National Biomedical Imaging Archive (NBIA); GenomeRNAi | Imaging data | Image preprocessing and analyses, data annotation, data extraction, segmentation, deep learning, computer vision | Clinical or cellular phenotyping, patient stratification and disease subclassification |
| TCGA; dbGAP | Genomic data | Variant calling, annotation, structural variants differential expression | Diagnosis, disease subtyping, therapeutic matching, clinical trial matching |
| UK Biobank; BioMe Biobank | Biobanks and electronic health records | Clinical trajectory estimation, biomarker-based modeling | Predict risk of diseases, real world evidence modeling |
| ClinicalTrials.gov; AACT Database | Clinical trials databases | Clinical trial protocols, performance metrics, patient population summaries | Predictive modeling of clinical trial metrics |