
Pooled investments
Instead of buying shares individually, investors can pool their money and buy shares (and other assets) collectively. There are some significant advantages of pooled (collective) investment.
First, a more diversified portfolio can be created. Investors with a relatively small sum to invest, say £3,000, would find it difficult to obtain a broad spread of investments without incurring high transaction costs. If, however, 10,000 people each put £3,000 into a fund there would be £30 million available to invest in a wide range of securities. A large fund like this can buy in large quantities, say £100,000 at a time, reducing dealing and administrative costs per pound invested. Thus risk is reduced by diversification and costs are reduced by economies of scale in share dealing and administration, such as time spent managing the portfolio.
Second, even very small investors can take part in the stock market. If you have only £50 per month to invest it is possible to gain exposure to the equity market by investing through pooled funds. Unit trusts, for example, are often willing to sign you up for a drip feed approach to investing in the markets.
Third, you can take advantage of professional management. You can avoid the demanding tasks of analysing and selecting shares and bonds, going into the market place to buy and collecting dividends and so on by handing the whole process over to professional fund managers.
Finally, you can enter exotic markets that would otherwise be beyond your reach. Perhaps you wish to invest in South American companies, US hi-tech or some other category of far-flung financial securities, but consider the risk and the complexities of buying shares direct too great. Collective funds run by managers familiar with the relevant country or sector can be a good alternative to going it alone.
These advantages are considerable but they can often be outweighed by the disadvantages of pooled funds, including high costs of fund management and underperformance compared with the market index. You will also lose any rights that accompany direct share investment, including the right to attend the company’s AGM or receive shareholder perks. And you lose the fun of selecting your own shares with its emotional highs and lows, triumphs and lessons in humility.
Unit trusts
With unit trusts the securities purchased by the investor are called ‘units’. The value of these units is determined by the market valuation of the securities owned by the fund. So, if, for example, the fund collected together £1 million from hundreds of small investors and issued 1 million units in return, each unit would be worth £1. If the fund managers over the next year invest the pooled fund in shares which rise in value to £1.5 million the value of each unit rises to £1.50.
Unit trusts are ‘open-ended’ funds, which means that the size of the fund and the number of units depend on the amount investors wish to put into the fund. If a fund of 1 million units suddenly doubled in size because of an inflow of investor funds (not because the underlying investments rise in value), it would become a fund of 2 million units through the creation and sale of more units.
If the example trust with 1 million units attracts a lot of interest because of its great first year performance (say the underlying shares have risen 50 per cent), it might then sell an additional million units at £1.50 each to become a fund with total assets of £3 million.
Unit holders sell units back to the managers of the unit trust if they want to liquidate their holding (turn it into cash). The manager would then either sell the units to other investors or, if that is not possible because of low demand, sell some of the underlying investments to raise cash to redeem the units. Thus, the number of units can change daily, or at least every few days.
Pricing
The pricing of unit trusts is not quite as simple as described above. In fact, the units generally have two prices. The total value of the investments underlying the fund is usually calculated once a day using a method prescribed by the Financial Conduct Authority (FCA). From this value the price a new investor has to pay to buy – the offer price – is calculated. The offer price is the price the trust would have to pay to purchase the investments currently held plus dealing costs, administration expenses and other charges. The total sum is divided by the number of units in issue.
The bid price (the price you can get if you want to sell) is usually set at 3–6 per cent below the offer price (for funds invested in shares). The spread, or front-end load, between the bid and offer prices pays for two things. First, fund administration, management and marketing. And second, the market makers’ spreads, stamp duty and brokers’ commissions payable by the fund when it buys and sells shares (bonds, etc).1
Most unit trusts are priced on a forward basis, which means that the price paid by a buyer of units will be fixed at a particular time of the day (often 12.00 noon) that is yet to come. So when you make out an order to buy you do not know what price you will pay, which is determined by what happens to the prices of the securities in the fund between now and the fixing price. Some funds still charge the historic price, taking the value from the last valuation.2
When judging the performance of a unit trust you must bear in mind the influence of the spread. For example, if the quoted prices for a unit move up from 200p–210p to 250p–262.5p the return (the difference between buying and selling price) is 250p–210p, which is merely 19 per cent, not 25 per cent. Clearly the bid–offer spread means that your fund has to work hard to produce good returns in the short term. One way of looking at this is: if you sign a cheque for £10,000 and the spread is 5 per cent, only £9,500 is left in the fund for you to draw out after one day.
Who looks after the unit holders’ interests?
There are four levels of protection for the unit holder:
- The trustee and auditor: The trustee, usually a bank or insurance company, keeps an eye on the fund managers to make sure they abide by the terms of the trust deed – for example, sticking to the stated investment objectives (e.g. investing in Japanese equities). Importantly, the trustee holds all the assets of the fund in their name on the unit holder’s behalf, so if anything untoward happens to the fund manager the funds are safeguarded. The trustee also oversees the unit price calculation and ensures the Financial Conduct Authority regulations are observed. The auditor checks that the accounts have been drawn up properly.
- The Financial Conduct Authority: The FCA authorises both the manager and the trustee to hold those roles. Only funds authorised by the FCA are allowed to advertise in the UK – these are Authorised Unit Trusts (AUTs). Unauthorised unit trusts, most of which are established offshore (outside the jurisdiction of the FCA) are available, but you should be aware that they carry more risk by virtue of their unregulated status.
- The Ombudsman: Complaints that have not been satisfactorily settled by the management company can be referred to the Financial Ombudsman Service (see Chapter 19) which can force compensation.
- The Financial Services Compensation Scheme: Up to £85,000 is available for a valid claim. For example, when an FCA authorised fund becomes insolvent or suffers from poor investment management (see Chapter 19).
Charges
There are many charges:
- Initial charge (‘sales’ or ‘front-end’ charge): This is included in the spread between the bid and offer prices. So if the fund has a spread of 6 per cent it might allocate 5 per cent as an initial charge. Some unit trusts have dropped initial charges to zero, particularly those investing in interest-bearing securities (bonds, etc) and tracker funds (see later).
- The Annual Management Charge (AMC): A typical actively managed fund charges between 0.65 per cent and 1 per cent, but can be higher. If you invest via a platform (see later) it may charge up to 0.45 per cent per year on top to hold your investments in your portfolio. If an independent financial adviser is organising the purchase for you, rather than a platform, you might have to pay a few hundred pounds in advice fees up front. The AMC is deducted from the fund on a daily basis, so you may not notice it being taken as the fund’s price is subtly adjusted downwards. Over time the annual fees have a larger effect in reducing the value of your investment than the initial charge.
- Ongoing charges: Further costs on top of the AMC are taken from the fund. When these are added to the AMC we arrive at the ongoing charges. The additional items include fees to the trustee, custodians (who hold the underlying securities), investment adviser (fund managers often get unit holders to pay for research on top of the AMC – yes, ‘experts’ hiring others to analyse, but not paying for it out of their pocket), fund valuers, marketers, accountants and auditors, regulators, insurers, lawyers, professional advisers and VAT on these charges. A charge of about 0.05–0.5 per cent per year generally covers these legal, audit and other administration costs. This is also deducted automatically by the fund manager on a daily basis. Ongoing charges (formally called total expense ratios) can be obtained for individual funds from markets: ft.com/data/funds/uk and www.bestinvest.co.uk.
- Various other deductions not included in the published ongoing charges: These include transaction costs associated with buying and selling securities such as brokers fees, bid/offer spreads on shares or bonds and transaction taxes such as stamp duty (0.5 per cent) in the UK. Don’t forget that you would incur these costs anyway if you were buying the shares directly – and without the benefit of the fund’s economies of scale. However, a fund with a high turnover in its portfolio (selling shares and replacing them with others) can pay out over 1 per cent per annum in additional costs. A more typical figure is less than this for active funds (probably around 0.4 per cent) and can be as low as 0.1 per cent for trackers.
Many commentators think that high-turnover funds are poor value – see Article 5.1. Some investment managers spread trading costs across all investors. However, many recognise that many of the transactions are forced on the fund because investors are coming into or leaving it. Where this happens, the transaction costs may be charged to those investors. Another cost might be performance fees if the manager does well relative to the market segment (around 5 per cent have performance fees). It may seem odd when your fund is down 10 per cent that a performance fee is paid, but this can happen if the market index is down 15 per cent in the same period.
- Exit charges: Some funds make an exit charge instead of an initial charge if you cash in within, say, the first five years.
Article 5.1 - How a 1% hidden fee wipes £100,000 from a £100,000 investment
By Attracta Mooney
An engineer and an architect invest £100,000 each in different funds that have an identical ongoing charges figure. The funds enjoy identical returns for 30 years but when the investors withdraw their capital, the architect has £100,000 less.
What happened? This is the riddle that consumer champions and investors have been trying to solve for years. The answer is clearer because of new European rules. Under Mifid II, asset managers must disclose a figure for the total cost of investing.
This has highlighted the various, and often high, fees that investment houses charge on top of the ongoing charges figure (OCF), which most investors use to understand how much they pay their portfolio manager.
Analysis by FTfm and the research company Lang Cat found that investors are paying up to four times the OCF in popular funds, including those run by Vanguard, BlackRock and Janus Henderson.
Mike Barrett, director of Lang Cat, says that although the costs on top of the OCF might look small initially, perhaps 30 basis points of additional charges, or 30p for £100 invested, they add up.
For example, an investor who pays a fee of 1 per cent a year on an initial investment of £100,000, and enjoys returns of 6 per cent a year over three decades, will end up with a pot of £432,194, according to Lang Cat.
If, however, hidden costs add an additional 1 per cent a year in fees, that pot will be just £324,340.
“What you might see as ‘just a few basis points’ makes such a difference over the years. The numbers can be startling over time,” Mr Barrett says.
He says investors have been surprised that the true cost of investing is so much more than expected. “Investment professionals, such as financial advisers, always knew there was this known unknown, that the OCF was not the complete picture,” he says. “But I think it was a reasonable assumption for retail investors to make — that if an asset manager said a fund had an OCF of 22bp, that was it and that there wasn’t another 50bp on top of that.”
Under Mifid II, asset managers must provide estimations of transaction charges, which are the cost of buying and selling stocks, as well as other incidental fees. In many cases, transaction costs have been far higher than even experienced advisers expected.
For example, the Polar Capital Japan I hedged fund has an OCF of 1.35 per cent but transaction costs of 1.81 per cent, raising the cost of ownership by 134 per cent.
Iain Evans, global head of distribution at Polar Capital, says the company’s fund prices, income payments and performance figures have always been shown and paid net of all fees, including transaction costs. “While we understand what the regulator is trying to achieve in terms of cost transparency, the net return that we deliver to our investors should be the ultimate measure of our value add,” he says.
“It is, of course, a matter of personal investor preference on the degree one is focused on the costs of a product versus the net money outcome, but we remain resolutely focused on delivering differentiated investment products and superior risk adjusted returns to our investors and believe that we can and do deliver value for money.”
JPMorgan Asset Management’s £908m European Dynamic ex-UK fund has an OCF of 93bp and reported estimated transaction costs of 1.68 per cent, lifting the ownership cost 180 per cent.
The Janus Henderson UK Absolute Return fund has an OCF of 1.06 per cent, as well as transaction costs of 79bp. If platform fees and a performance fee are charged, the total cost jumps to an average of 3.82 per cent annually if purchased via Hargreaves Lansdown, the UK fund distributor.
FE Trustnet, the data provider, created a list of 100 popular UK funds. It found that these had an average OCF of 88bp, but this jumped to 1.11 per cent once transaction costs were included.
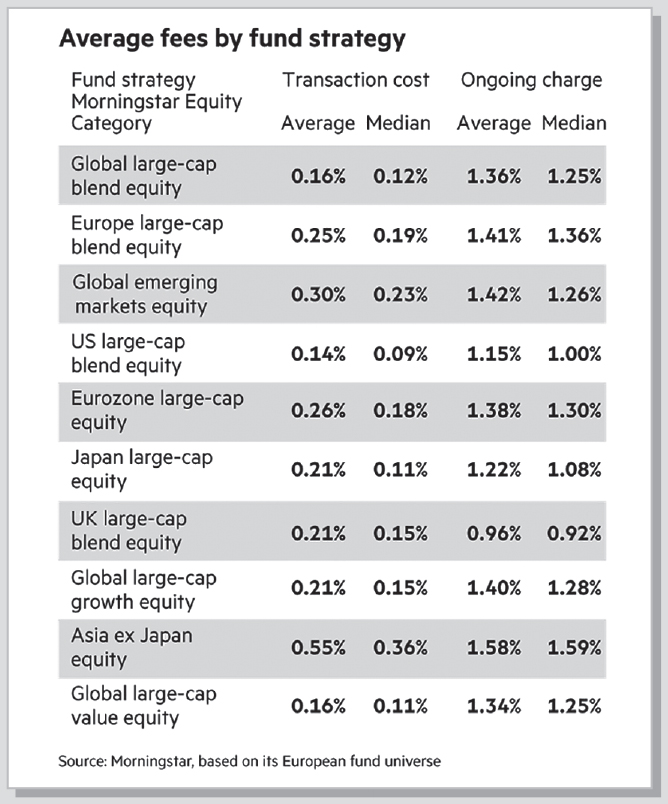
A look at additional costs across funds in Europe shows that transaction costs added 25bp to European large-cap funds and 55bp to Asia ex-Japan equity funds, according to Morningstar, the data provider.
Funds investing in US large-caps and global large-caps had the lowest transaction costs, according to Morningstar. Funds with high transaction costs are typically those that trade more. Investors will probably pay other fees, such as to their financial adviser or online broker.
Darius McDermott, managing director of Chelsea Financial Services, an online investor service, says the new rules reveal that hidden fees can reach “ridiculous figures”.
“There is some surprise at how much some of the charges are, especially with bigger funds where you would expect to benefit from economies of scale,” he says. Mr McDermott says: “Clearly there was a lack of transparency” from asset managers. He says that hidden costs are not the only aspect to which investors need to pay attention. He points out that an investor could put their money into a fund where costs are low but performance is bad. Another investor could be in a fund with high costs and high performance and be better off.
“The charges, in some instances, are bigger than we and the public expected. But if you get good performance after charges, that is an important argument,” he says.
“It would be damaging for people to look at fees only. The cheapest doesn’t mean it is the best.” Mr Barrett agrees that the high additional fees are not “necessarily bad”.
![]()
Source: Financial Times, 10 February 2018.
© The Financial Times Limited 2018. All Rights Reserved.
How do you buy or sell units?
You can buy direct from the unit trust management company. Alternatively, you could buy through a financial adviser, broker or fund supermarket (platform). If you are worried by prices being set on a forward basis, you can tell your financial adviser or platform not to buy if the price goes above a limit.
When it comes to selling, you can sell units back to the management company (through an online broker account), which is obliged to purchase. However, some funds will only allow sales monthly, quarterly or twice yearly. This is because the money is invested in illiquid assets such as property – some of these assets will probably need to be sold to pay you back, which takes time. For funds, certainly for those invested in quoted shares and bonds, you should receive payment within five days, but if the fund has a lot of redemption requests in a short period it may take a while to sell securities and pay off unit sellers. You don’t have to sell all your holding – you can dispose of as much or as little as you want.
Returns
The return on a unit trust may consist of two elements. First, income is usually gained on the underlying investments in the form of interest or dividends. Second, the prices of the securities held could rise over time. Some units pay out all income, after deducting management charges and so on on set dates (usually twice a year)3 in cash. On the other hand, accumulation units reinvest the income on behalf of the unit holders, and as a result the price of accumulation units tends to rise more rapidly than income units. Financial websites show listings for prices of income (‘Inc’) units (also called distribution units) and accumulation (‘Acc’) units.
Accumulation units offer the benefit of avoiding reinvestment costs and the hassle to the unit holder of purchasing new units. As well as a trust issuing accumulation units and distribution units it may issue different units to institutional investors (with much lower management charges because they buy in bulk) than retail investors. Confusingly, these different classes are referred to as different share classes rather than unit classes.
Dividends paid by unit trusts and OEICs (see later) are treated in the same way as dividends from ordinary company shares in UK companies for tax. After the first £2,000 of dividend tax-free allowance is used up basic rate tax payers are charged 7.5%, but higher rate tax payers pay more (see Chapter 17).4 Interest distributions paid by UK unit trusts and OEICs paid gross are treated in exactly the same way as interest on bank, building society and local authority savings (see Chapter 17). However, higher rate tax payers have to declare the increase in accumulation units due to dividends and interest received, even though not sent to them, and pay extra tax (see Chapter 17). But these payments on annual income are deductible from any capital gains tax calculation after selling your units.
Types of trust available
There are over 200 fund management groups offering over 3,000 unit trusts or their cousins, the OEICs (see below) – www.trustnet.com allows you to search through a list. UK All Companies funds invest at least 80 per cent of their assets in UK shares (the Investment Association, www.theia.org, has 30 types of fund defined). To this classic type of unit trust have been added a very wide range of trusts with amazingly diverse objectives. Some funds focus investment in shares paying high dividends (UK Equity Income), others split the funds between equity and bonds (UK Equity and Bond Income), while some invest mostly in gilts or corporate bonds. Some place most of their money in smaller companies, some in Far East shares. A few trusts invest in property. The possibilities are endless. The main categories are:
- Income funds: They aim to produce a regular income from the underlying investments, which may be paid out to the investor or invested back into the fund.
- Growth funds: They aim to grow the capital over the long term, thus many investments may have low or no current dividends but have high capital gain potential. The funds that produce income as part of their total return usually reinvest it back into the fund.
- Specialist funds: This includes property funds and funds with a specialised and narrow investment focus, such as technology. The specialist absolute return funds rather than trying to beat a benchmark index, such as an index of European shares, aim to obtain a positive return even when particular share and/or bond markets are going down by switching to those sectors thought likely to rise. Thus, the manager has to be free to transfer money from one set of equity/bond markets to others quickly.
- Capital protection funds: These are funds that aim to protect your capital. There is some potential for investment return, but the main emphasis is on safety. Underlying assets might be short-term lending to highly reputable governments and companies.
Minimum investment
Some trusts ask for an initial minimum investment of only £250 or so, whereas others insist on at least £1,500. Thereafter you are often entitled, under a savings plan, to put in as little as £50. It is often possible to use shares instead of cash as payment for units through a share exchange scheme.
Key investor information document (KIID)
The KIID, produced by the fund, provides the most important facts in a standardised, jargon-free way, allowing comparison between funds and helping you to assess if a fund will meet your needs at a reasonable cost. It covers the following:
- Fund objective and investment policy (shares/bonds, geographical focus, business sector, say green energy firms only).
- Risk and reward profile. An estimate of the likelihood of the fund losing money on a scale of 1 to 7. Of course, risk and return are usually inversely related.
- Charges.
- Past performance over a number of years and degree of volatility.
- Other elements, such as how to obtain the prospectus, annual and half-yearly reports.
- Name of trustee.
Following your units’ progress
A manager’s report will be sent to you every six months detailing the performance of the fund over the half year or year and the events in the market(s) in which the fund invests, and explaining the manager’s investment strategy. It will also comment on future prospects, list the securities held by the fund and display the fund’s financial accounts.
At least once a year you will receive a statement showing the number of units you hold and latest prices. The statement will also give a run-down of any additional investment, reinvestment or encashments you have made since the last statement.
Between receiving reports and statements you can contact the management company over the telephone. They may be prepared to discuss the investment performance of the fund and current outlook. They will certainly be willing to deal with general administration queries and, of course, give information on other products they might sell you.
Many websites, such as fund supermarket websites (see later), carry details of units. You could visit the fund manager’s website, or go to a general site.
Useful websites
| www.citywire.co.uk | Citywire |
| www.markets.ft.com/data/funds/uk | Financial Times |
| http://www.fundlistings.com | Fund Listings |
| www.ii.co.uk | Interactive Investor |
| www.theia.org | The Investment Association |
| www.morningstar.co.uk | Morningstar UK |
| www.refinitiv.com | Refinitiv |
| www.standardandpoors.com | Standard & Poor’s funds |
| www.trustnet.com | Trustnet |
Switching funds
Many fund management companies allow you to switch from one trust within its stable to another for a charge much lower than the usual initial charge. So, if you think US hi-tech has reached its peak you might ask the manager to transfer your holding to a UK smaller company fund.
Active versus passive?
It costs more to run a fund in which the manager is spending time and effort carefully selecting shares (an ‘actively managed’ fund) than one where the manager simply buys and holds a broad range of shares matching a market index (e.g. FTSE 100), called a tracker (or passive or indexed) fund. Study after study concludes actively managed funds fail to outperform the market (on average). Some active managers will outperform, but how much of that is due to random chance and how much is due to superior ability is very much moot. After all, put 100 idiots at a roulette wheel and some will walk home wealthy – evidence of fat wallets (or their backers’ wallets) does not make them smart. The fund management industry is not populated by idiots. There are some very smart fund managers, using sound investment principles. And, over many years it is possible to observe some extraordinary returns. However, it is difficult to identify real investing skill before the event and many out-performers over three or four year spans are simply lucky.
Trackers will also underperform the benchmark index, but at least the ongoing costs of the fund are significantly less than most actively managed funds. Typically, trackers’ ongoing costs are between 0.2 per cent and 0.3 per cent, while actively managed funds are around 1.5–1.8 per cent if you include the adviser’s or platform’s charge for holding your investments. You need to be convinced of superior security picking skills of your chosen manager to sacrifice 1.8 per cent of your annual return. This small sounding sum could amount to 25 per cent or more of your fund over a decade or so.
If you invested £20,000 in a fund with no charges, and it grew by 6 per cent annually for 20 years, you would get £64,143 – just over £44,000 growth. If you invested in an active fund with the industry typical ongoing charge of 1.67 per cent, your fund would be reduced to £46,689, meaning £17,454 of your growth goes on charges. If the ongoing charge is 2.5 per cent, about £24,000 would be lost due to charges. That is not even factoring in other costs, such as transaction costs of security dealing.
John Authers, a commentator on investment matters at the Financial Times, leaves us in no doubt concerning his view that active funds are generally too costly for the service they provide – see Article 5.2. Bear in mind that the high charges are often levied to cover the fiddly business of dealing with investors putting in only a few thousand pounds. Larger investors, such as pension funds buying unit trusts, benefit from much lower charges. Charges for investors in US funds have fallen under the pressure of investors’ insistence, in the light of the evidence of low costs being vital to overall returns, to an average of 0.55 per cent for equity funds, about half that of 20 years ago.
American investors seek out cheap funds more than Europeans. Consider this though: there is a major problem with too much passive investing. Without a large body of investors and managers actively looking for underpriced securities the market would drift to inefficient prices, so there is a limit to the proportion of shareholdings that should be held passively without thought to the value of the underlying shares.
Article 5.2 - Beware the costs of actively managed funds
By John Authers
Why defend the indefensible? Traditional actively managed mutual funds [e.g. unit trusts] are obsolete. They have nothing left to recommend them. And yet attempts to point out the blatant superiority of newer passive investment products provoke furious defences from brokers.
Their arguments are so threadbare that they can only be motivated by a desire to keep the commissions coming. But they are a formidable obstacle to needed change.
Let us be clear about the model that must be replaced; managers try to beat market indices with a portfolio of about 100 stocks. Such diversification makes it hard to beat the market. But the risk of being caught in a crash is undimmed. And while many managers are smart enough to beat the market, they cannot do so and still pay themselves decently.
A recent survey by the London investment consultancy Style Research of how 425 global equity funds benchmarked against the MSCI World index performed last year makes this clear. Measuring the performance of the funds’ holdings, without including costs, 59 per cent of them beat the index. Once costs to investors were included, only 31 per cent beat the index. So 28 per cent of the funds had index-beating managers who charged too much in fees to allow their clients to beat the index.
Looking at European equity mutual funds, Karl-Heinz Thielmann of Long-Term Investing Research in Karlsruhe found their total average costs (including bid-offer spread, market impact [buy/sell orders move share prices on the market adversely for the trader], and costs caused by managing in- and outflows of money from clients) were about 4 percentage points (3 percentage points in the US). Their outperformance, before costs, was about 2 percentage points.
How, then, to reduce costs? The best answer yet devised is to offer index funds, which merely replicate the index. This can be done cheaply with computers. But index funds tend not to pay much commission. This spurs brokers’ ire.
First, they argue that active managers can take evasive action in a market dive, while index funds blindly fall with the market. This is specious on several levels. Active managers underperform consistently, throughout bull and bear markets. Over the past five years, according to Morningstar, 61 per cent of balanced funds and 67 per cent of US equity funds failed to match their index.
Moreover, they are paid to pick stocks, not to time the market. It is not an equity fund manager’s job to make a big switch into bonds or cash. And the argument for index funds is not that they are lower risk, but that due to their lower costs their returns for any level of risk are likely to be higher than for equivalent active funds.
A second argument is that index funds are guaranteed to lose to the index, thanks to their costs. This is true, but specious. The odds are that they will perform better than an active fund. And they enjoy economies of scale. For example, the SPDR, which tracks the S&P 500, had a 2012 return just 0.01 percentage point less than that of the S&P, according to Bloomberg.
A third argument is that choosing index funds entails ignoring active managers who consistently outperform. But this small band of managers may be exactly the ones to avoid. History shows that persistent outperformance attracts inflows, which increases costs for the fund, and makes it harder to outperform. Eventually performance comes crashing back to earth.
Indexing’s critics have one decent argument. Index funds are dumb. They buy at whatever valuation the market offers. If everyone invested through index funds, markets would cease to function; nobody would be seeking out inefficiencies.
How to deal with this? One way is to find low-cost ways to manage funds without accepting market valuations. For example, funds can buy only stocks that appear cheap by a specific metric. Another option is to abandon diversification and really try to beat the market. This is risky. But according to Morningstar, most sector fund managers, investing only in a small universe of stocks, do beat their benchmarks. When combined with index funds inside pension funds, such funds make great sense.
The industry has far to go before future retirees get the deal they deserve. But its current modus operandi burdens investors with too many costs. This must change. When brokers brandish the rosy five-year returns of active mutual funds, they will be defending the indefensible.
![]()
Source: Financial Times, 5 April 2013.
© The Financial Times Limited 2013. All Rights Reserved.
Article 5.3 discusses the poor performances of European fund managers.
Article 5.3 - Few funds sold to retail investors beat benchmark after fees
By Chris Flood
Less than one in five of the funds sold to retail investors in Europe in the past three years outperformed their benchmark after fees were taken into account, says research by Prometeia.
The Italian consultancy examined the three-year record of 2,500 equity, bond and money market funds, with combined assets of €1.8tn, and found that only 18 per cent beat their benchmark.
Claudio Bocci, head of the asset management advisory team at Prometeia, said: “Many managers are unable to compensate for fees because they are not taking enough active risk, so they are very unlikely to beat their benchmark. This is a structural problem”.
Performance records suggest that many fund managers struggle to deliver consistent success. Half the top-ranked managers of global and European equities, global bond and flexible balanced funds, measured by returns over three years, drop out of the top performance decile over the following 12 months.
Huge gaps also exist between the best and worst managers across all fund types, complicating the decisions facing retail investors.
Mr Bocci said there was widespread misalignment between the fee structures and expected returns of many funds sold to retail investors in Europe.
Prometeia estimated that up to a quarter of the funds (mainly bond and money market products) sold to retail investors faced a near-impossible challenge in delivering above-benchmark returns net of fees.
“Some of these conservative funds have close to a 100 per cent probability that they will fail to beat their benchmark because of costs. This is not a sustainable position,” said Mr Bocci.
Prometeia’s findings echo criticism by the European Commission, which last month highlighted large variations in the cost of investment products and the quality of advice provided to retail investors across Europe. “Today, an average consumer is overwhelmed by the sheer complexity and uncertainty associated with investment products. Most households do not invest at all in capital markets or do so very infrequently across their lifetime” said the commission.
Mr Bocci said he expected further rationalisation of fund selectors’ catalogues as Mifid II would encourage them to use more high-quality products. He added that just a fifth of the 3,700 fund share classes sold to retail investors in Europe could be judged as high quality, according to Prometeia’s assessment based on returns, risks, and performance persistence measured over different timespans.
![]()
Source: Financial Times, 13 May 2018
© The Financial Times Limited 2018. All Rights Reserved.
While many active managers pretend to be actively sifting companies to select only the most underpriced, in reality they create portfolios that are very similar to a broad cross section of the market – ‘index huggers’ or ‘closet trackers’ or ‘closet indexers’. And yet they charge the high fees of proper active managers.
Article 5.4 - Pull closet indexing out of the closet
By John Authers
In the UK, people are trying to pull closet indexing out of the closet. It is a fight that could have global implications.
This is one issue on which there is no need to sit on the fence. The debate between active managers, who try to beat their benchmark, and passive managers, who merely track it, will go on and on. But everyone can agree that there is no case for closet indexing – the practice of running an “active” fund, charging active management fees but, in practice, offering an investment that merely hugs the index.
This is, in effect, a tax on millions of investors, for no economic benefit and helps pump up asset bubbles. It impedes capitalism and the efficient allocation of capital.
A report published last month by SCM Private, a London-based investment adviser, described closet indexation as “a UK epidemic”. After analysing £120bn in UK funds, it alleged that investors could have saved £1.86bn in fees if they had switched from underperforming UK equity funds to alternative cheaper index funds.
SCM Private emotively accused the UK fund industry of “systematic abuse of the public” and alleged that it had failed to behave with integrity. This is strong language, so let us look at the charges in detail.
Closet indexing has been well explored in academia. It is measured by “active share”, a concept invented by the Yale academics Antti Petajisto and Martijn Cremers. For US funds benchmarked to the S&P 500, it measures the fraction of a fund’s holdings that differ from the S&P. For example, if a fund’s holdings are identical to the index, except that it holds no shares in Apple (worth 5 per cent of the index) and has invested that money elsewhere, it will have an active share of 5 per cent.
A passive index tracker has no active share. A fund that invests only in obscure stocks not in the benchmark has an active share of 100 per cent. Once active share drops below 60 per cent, the academics said, a fund is a possible “closet indexer”.
SCM Private found that only 24 per cent of 127 UK funds benchmarked to the FTSE-All Share index had an active share above 70 per cent. This compares with 65 per cent of a sample of US funds that had an active share this high.
Overall, the UK funds had an active share of 60 per cent, compared with 75 per cent in the US.
The chances are tiny that a few tweaks to the index would do well enough to overcome the extra fees that active managers charge, which are on average three times the fees charged by trackers. And indeed 88 per cent of funds with an active share under 50 per cent did not match their index.
Why does this happen? The problem derives from the incentives for fund managers who are paid not to beat the market but to accumulate assets. This is because they charge a percentage fee on assets under management and are judged by comparison to their benchmark index and to their peers. To hold on to assets, therefore, it is vital not to underperform their peers. Make a big contrarian bet and you may be separated from the herd. So everyone herds into the same stocks.
As passive investing through index trackers has taken hold, active managers have grown more conscious of their benchmark index. This is clear from the language they use. Two decades ago, a portfolio manager would say he “owned” a stock. Now he is more likely to say he is “overweight” it, always implicitly comparing with the index.
This phenomenon helps create investment bubbles, as overvaluations naturally occur when everyone invests in the same thing.
It also creates opportunities for those who have the courage to search for them. SCM Private found that 72 per cent of the UK funds with a high active share succeeded in beating their index. This is in line with international research. The Cremers and Petajisto research found that in the US, funds with the highest active share beat the index by more than 1 per cent per year, even after taking their fees into account.
The UK is not alone. Research led by Mr Cremers looked at 21,684 funds in 30 countries, managing some $10tn as of December 2007. Closet indexing was dominant in some countries, accounting for 40 per cent of equity funds in Canada, and 81 per cent in Poland.
It also found that countries with the most explicit indexing were also likely to have less closet indexing, while active funds there would charge lower fees. Passive trackers provided stiff discipline for the rest of the sector. It also found that most active funds fail to beat their benchmark – but that the more genuinely “active” a fund, the more likely it was to outperform.
Fixing the problem needs a radical overhaul of the way fund managers are paid. For now, funds must be forced to publish their active share. Before being flushed down the toilet, closet indexing must be pulled out of the closet.
![]()
Source: Financial Times, 4 October 2013.
© The Financial Times Limited 2013. All Rights Reserved.
Points to bear in mind when choosing a unit trust
Unit trusts should be viewed as medium- to long-term investments, given that the up-front charges are so high. It is no good flitting in and out.
Advertisements showing a fund manager’s performance should be taken with a large pinch of salt. They will be very selective about the starting date (choosing a low point) in order to impress you. Furthermore, there is a mass of evidence to show that past performance is a very poor guide to how well a fund will perform in the future. It is very unusual for a fund to outperform consistently over the medium and longer term. Surprisingly, often top performing funds over one- or five-year periods end up falling to the bottom of the league tables in the next period. Novice investors are often lured into buying recent top performers, only to find that the sector where the fund focuses turns out to be in a bubble, and future returns are disappointing. Even if you find a fund that has shown a sustained high performance you may then discover that what made the fund work well in one economic period serves less well in the next. Also, outperformance may be due to taking more risk.
A dilemma arises for investors when a fund manager leaves a management company. Should you stick with the trust or move with the manager? This is a serious issue given that less than two-thirds of managers have run their funds for as long as three years. Following a ‘star’ fund manager to a new company is not always possible, and besides the costs of doing so can be high. Some funds have one star player, while others have a talented team. Going for a team may leave you less vulnerable to the departure of particular managers. Citywire (www.citywire.co.uk) tracks the performances of individual fund managers rather than funds.
It is possible for your money to be trapped within a unit trust. In 2008, when property prices were plunging and it became difficult to sell property, a number of property unit trusts announced that unit holders could not redeem units without giving months of notice for fear that the managers would become forced sellers of assets at distressed prices. In 2019 Neil Woodford blocked redemptions (a redemption gate) from his Equity Income Fund after serial underperformance led to an investor exodus. He did it to give more time sell unlisted and illiquid shares at better than fire-sale prices.
Article 5.5 - Conflicts of interest in fund manager market exposed by Woodford
Celebrated investor’s decision to run an open-ended fund suited everyone except investors
By Jonathan Ford
In the days since Neil Woodford shuttered his Equity Income Fund to redemptions, many have questioned why the celebrated asset manager ever structured this one-time £10bn monster as an open-ended investment scheme.
The main perceived benefit of such funds is the ATM-like promise of instant liquidity. Which means the manager must always be prepared to liquidate to satisfy redeeming investors. Yet Mr Woodford’s prized forte was long-term investing, not benchmark-hugging. Not only had he put the fund into some illiquid unquoted investments, thinking they would do better in the long term, Mr Woodford had even gone so far as to stop paying his staff short-term incentives. He preferred to put them on straight salaries to keep them focused on the longer goal.
Mixing long-term strategies with ATM promises created a vulnerability that might have been avoided had he established a closed-end fund that was not at risk of opportunistic liquidation. Indeed, the open-ended structure contributed to the pickle that Mr Woodford and his investors now find themselves in.
So why do it? Those seeking an answer could do worse than follow the investor’s dollar. Independent financial advisers such as Hargreaves Lansdown and St James’s Place are the key gatekeepers for retail investors. For the IFAs, there’s a financial advantage to peddling open-ended structures. While these may not be as lucrative, fee-wise, as more specialist asset classes such as private equity, they are marketable to the widest retail audience.
And that’s not their only merit. Open-ended funds are also easily scalable, subject only to demand or the fund manager’s discretion. In this they differ from closed-end schemes, such as investment trusts, which take a fixed chunk of money. IFAs can put such products on their platform’s so-called “best buy” lists for steady sale, negotiating a discount with the manager and inserting their own fees gently into the compensation equation.
Marketing Mr Woodford’s fund was lucrative for Hargreaves Lansdown. When the manager obligingly cut his fees they were able to shoehorn in their own charge of 0.45 per cent per annum on top. The firm carried on flogging the fund long after its decline. As to Mr Woodford himself, well the answer perhaps lies in the symbiotic relationship between the manager and these marketing machines. As a star manager setting up on his own, he had a strong incentive to play by the rules set by the biggest retail gatekeepers.
Whatever the fund management industry claims, the overwhelming desire remains to gather assets, assets and more assets. That’s because success at the top for a manager may be fleeting. While you are still in vogue, there is a visceral wish to cash up when you can. Surveying this patchwork of poor incentives, it is hard to escape the irony. By piling on too many funds too quickly, Mr Woodford actually set himself up to fail. He bid up his chosen pool of stocks with the wall of cash he had assembled. That made their subsequent underperformance more certain. As for the unlisted stocks he bought, they seem to have been a way of diversifying away from overpriced holdings — albeit one that badly misfired. The one party uncatered for in all this, of course, is the end investor. While the intermediaries are all acting rationally in their own interests, its outcome — and that of society — is distinctly third rate.
![]()
Source: Financial Times, 9 June 2019
© The Financial Times Limited 2019. All Rights Reserved.
Some funds can grow too big. For example, a fund focused on small French companies that has €1 billion under management may not be able to limit itself to the true bargains, or even to small companies, given that the manager has to invest somewhere.
Some funds can be too small. Many of the costs of running a fund are fixed, such as the manager’s research time, thus average costs per unit can rise if there is only a few million to invest. The fund management house may bear the extra costs for a time, but if there is no improvement, eventually it will close.
Few fund managers invest a substantial proportion of their own wealth in their funds.
Article 5.6 - Impetus for managers to invest in own funds
By Ruth Sullivan
Fund managers who put their own money into the funds they run are less likely to take undue risks and expose investors to big losses. That is the theory anyway, and there is growing interest in the practice.
“Having skin in the game is gaining traction but is more prevalent in the US and the UK than in continental Europe,” says Amin Rajan, chief executive of Create Research, a consultancy. However, the increase has been slow.
According to a survey of global managers by Citi and Create Research, just 8 per cent put their bonuses into the funds they manage, while a further 13 per cent plan to in the next 12 months. Some asset managers require their fund managers to defer as much as half of their bonus by investing it into their own funds over a three to four-year period, which can be “a big incentive for managers”, says Pars Purewal, at PwC. This requirement is increasing in the UK because of the need to align interests between fund managers and clients and “prevent managers taking unnecessary risks”, he adds.
Much depends on the culture of the asset manager. Some believe it is an essential part of the business ethos, making investors feel more confident. Henderson Global Investors, a UK-based investment house, is one of these. “Most fund managers invest a meaningful amount in their funds [here]. It shows their interests are aligned with investors,” says Jamie Legg, at Henderson.
“It is a genuine conviction in the stocks they run. Why wouldn’t they?” says Mr Legg.
Vanguard Group, a US asset manager, takes it a step further and has “a client pledge to invest our own money alongside our investors”, says Tom Rampulla of Vanguard Investments UK.
However, not all investment houses believe it is necessary for long-only managers to invest in their own funds. Most funds are designed to track and beat indices and most of the returns will be driven by what the benchmark does.
In the US, where disclosure of how much managers invest in their own funds has been obligatory since 2006, there is evidence of a growing trend to co-invest.
![]()
Source: Financial Times, 9 January 2011.
© The Financial Times Limited 2011. All Rights Reserved.
A couple of technical terms
Undertaking for Collective Investment in Transferable Securities (UCITS) are open-ended funds regulated under European law that can be marketed freely across EU member states.
Non-UCITS Retail Schemes (NURS) are funds authorised to be sold to the public in the UK that are not governed by the European regulation of funds under the ‘UCITS Directive’, because they invest in assets, such as gold funds, that the Directive does not permit or comply with different concentration limits. They are required instead to meet standards set by the UK financial services regulator.
Open-ended investment companies
Open-ended investment companies (OEICs, pronounced ‘oiks’) have been around since the late 1990s, and many unit trusts have turned themselves into OEICs. OEICs are very similar to unit trusts, so most of what has already been said applies to them. A crucial difference is that an OEIC is a company that issues shares rather than a trust that issues units. One similarity is that it is ‘open-ended’ in that it can expand or contract the number of shares in issue in response to demand. Also OEICs are regulated by the Financial Conduct Authority in a similar way to unit trusts, so investor protection is much the same. Investment in OEICs may also be made on a regular basis, say £50 per month, or as a lump sum.
An OEIC has an authorised corporate director (ACD) managing the fund. It also has a depositary (usually a large bank) which, similar to the trustee for a unit trust, ensures safekeeping of the assets (custody), collecting of income, the delivery and receipt of underlying securities and the payment of tax. The oversight of the duty of care element is undertaken by the OEIC board of directors. The ACD’s remit is to invest shareholder’s funds in accordance with the OEIC’s objectives under the oversight of the board of directors. Compared with unit trusts, OEICs have a simpler pricing system because there is one price for both buyers and sellers. Charges and dealing commissions are shown separately (which makes them more transparent than unit trusts). When OEICs are bought or sold the price is directly related to the value of the underlying assets and not based on the supply and demand for its shares (as with investment trusts – see later). The price is calculated daily, usually 12 noon in London. Some OEICs charge an exit fee.
The OEIC (and unit trust) may be a stand-alone fund or created under an ‘umbrella’ structure, which means that there are a number of sub-funds each with a different investment objective (one sub-fund may focus on US shares, another on UK shares, etc). Each sub-fund could have different investors and asset pools. The advantage to the investor of the umbrella structure is that reallocating money within one fund management group to different investment categories is made easier and cheaper.
When there are a large number of new purchasers (or sellers) of OEIC shares the fund may incur high costs to buy (sell) underlying securities, such as broker fees and share bid-offer spreads. This damages the interests of older holders of OEIC shares. To balance the interests of the old and new holders the new members may be charged a dilution or adjustment levy (typically 0.5–2 per cent), the proceeds of which are held in the fund rather than being extracted by the manager. An alternative is to apply a swinging single price which adjusts the buy/sell price to include the transaction costs for the shareholder doing the transaction.
Exchange traded funds
Exchange traded funds (ETFs) take the idea of tracking a stock market index or sector a stage further. ETFs are set up as companies issuing shares. The money raised is used to buy a range of securities such as a collection of shares in a particular stock market index or sector, such as the FTSE 100 or pharmaceutical shares. They are open-ended funds – the ETF shares are created and cancelled as demand rises or falls. However, they differ from unit trusts and OEICs in that the pricing of ETF shares is left up to the market place. ETFs are quoted companies and you can buy and sell their shares at prices subject to change throughout the day (unlike unit trusts and OEICs, where prices are set by formula once a day).
Despite an ETF’s price being set by trading in the stock market they tend to trade at, or near to, the underlying net asset value (NAV) – the value of the shares in the FTSE 100, for instance. This is different from investment trusts, which frequently trade significantly below or above net asset value.
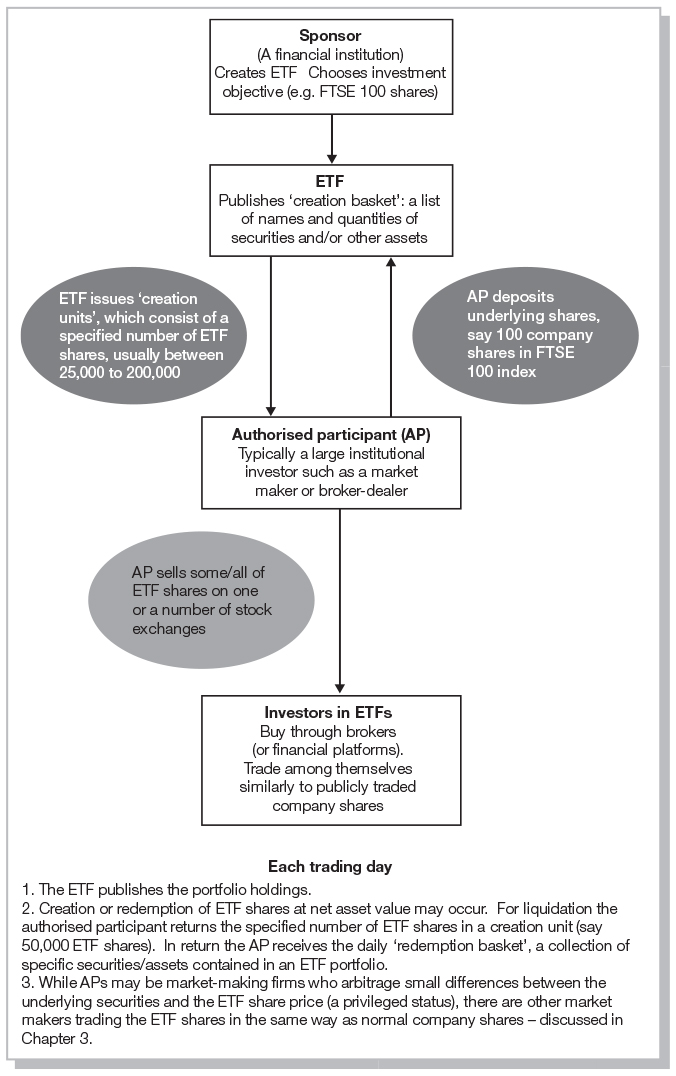
Newly created ETF shares are delivered to market makers (or other ‘authorised participants’) in exchange for an entire portfolio of shares matching the index (not for cash). The underlying shares are held by the ETF fund manager (ETF sponsor), while the new ETF shares are traded by the market maker in the secondary market. To redeem ETF shares, the ETF manager delivers underlying shares/securities to the market maker in exchange for ETF shares. ETF managers only create new ETF shares for market makers with at least £1 million to invest, so private investors are excluded at this level. However, private investors can trade in existing ETF shares in the secondary market.
If the price of an ETF share rises above the value of the underlying shares, there will be an arbitrage opportunity for the market maker. Arbitrage means the possibility of simultaneously buying and selling the same or similar securities in two markets and making a risk-free gain –buying bananas for £1 in one market and selling them for £1.05 in another. In this case the ETF share representing, say, the top 100 UK shares is trading above the price of the 100 shares when sold separately. Market makers, spotting this opportunity, will swap the underlying basket of shares for a creation unit of ETF shares, thus realising a profit by then selling the ETF shares into the market. Then the new supply of ETF shares will satisfy the excess demand and ETF prices should fall until they are in line with the underlying NAV.
If the ETF share price falls below the underlying shares’ value, the market maker will exploit this by having the ETF shares redeemed by the ETF manager. The market maker ends up with the more valuable underlying shares and the supply of ETFs in the market place has fallen, bringing the price back up to the NAV.5
While the essence of the process creating ETFs and the relationships between market makers and ETF managers is as described above, it is a little more complicated than this. If you would like to know the technicalities read more about them below.
An advantage arising from market makers and ETF managers not handing over cash, but instead swapping ETF shares and underlying shares, is that there are no brokerage costs for buying and selling shares. This makes transactions cheap.
Spreads for investors – the difference between the buying and selling prices of ETFs on stock markets – are generally around 0.1–0.3 per cent (although spreads can widen to 10 per cent or more at times of extreme volatility, for example, after 11 September 2001). While there is no initial charge with ETFs, annual management charges plus other costs (the total expense ratio) range between 0.09 and 0.75 per cent but are typically between 0.3 and 0.5 per cent – these are deducted from dividends.
ETFs are sometimes a more expensive way of tracking an index than some particularly cheap unit trust and OEIC passive funds because they incur additional costs in ensuring trading ability through the day and in paying a stock market listing fee. But overall the low-charging providers of ETFs, unit trusts, OEICs and investment trusts have comparable fees, but note the need to look for the low charging ones. A typical ETF, if there is such a thing, has a lower ongoing charge than a comparable unit trust or OEIC. In addition to the ongoing charge there may be fees to make use of an index (the FTSE might charge, for example), to service an account and to pay custodians to look after the assets.
Private investors purchasing ETFs from brokers will be charged a minimum of £10 to £40 per trade. No stamp duty is payable on purchase, nor does the ETF pay stamp duty when it purchases underlying shares, etc. Prices and other information are available at many free websites, such as www.londonstockexchange.com.
There are thousands of equity ETFs, from those that track the US market (S&P 500 index) or European shares (EURO STOXX 50), to more specialised funds such as information technology companies across the globe. There are also hundreds of ETFs with bonds as the underlying securities. In all, over £4,000 billion is invested in ETFs worldwide.
ETFs pay dividends in line with the underlying constituent shares or other income such as interest on bonds, quarterly, semi-annually or annually. This is reflected in the ‘yield’ quoted on financial websites such as iShares (www.ishares.com), Deutsche (etf.dws.com) and Trustnet (www2.trustnet.com/exchange-traded-funds). Make sure the yield you see quoted is the sum of the historic 12-month distribution payments made by the ETF divided by the ETF price after deduction of account charges, to compare across providers. Some yields are what the underlying holdings pay out rather than what the ETF pays. Morningstar (www.morningstar.co.uk/uk/etfs) corrects for this when comparing ETFs.
Recent innovations
We have moved a long way from the simple traditional equity ETFs developed in the 1990s and described above. Nowadays the ETF may not purchase all the shares in the index but merely a sample. This is useful for ETFs invested in, say, Chinese or Vietnamese shares where government restrictions may prevent purchasing all the shares in the index. Also, the exchange-traded concept has been extended beyond equities and bonds to foreign exchange rates, property, commodities and commodity indices (exchange traded commodities, ETCs).6
Instead of the provider holding the underlying instrument or commodity the investment is in swaps or other derivative instruments (holding a ton of actual pork belly for lengthy periods may be a wasting asset). Derivatives are also used for hundreds of equity and bond ETFs.7
The problem with derivative-based ETFs is that there is a risk that the counterparties providing the derivatives may not be able to meet their obligations and then the ETF holder may not have anything tangible backing up the ETF shares. Also if the ETF does not buy the underlying securities but instead relies on derivatives, and then goes bust, it could be more complicated for the investor to retrieve their investment. That said, many markets cannot be accessed through the traditional route and derivative value movement is the only option to track a market. Also swap-based deals can be cheaper than buying shares in 100 companies.
The use of derivatives for many EFTs – ‘synthetic replication’ of an index – has stimulated debate in the ETF world as to whether ETFs consisting solely of derivatives are truly ETFs at all. But, regardless of some misgivings it looked as though the volume of synthetic ETFs would overtake that of the traditional physical ETFs (‘physical-replication’). Then the financial crisis of 2008 happened, when synthetic ETFs looked shaky as financial institutions guaranteeing swaps and other derivatives came close to going bust themselves. Synthetic demand peaked and has fallen since 2012 while the demand for fully backed physical ETFs trebled. Today over three-quarters of ETF assets are held in physicals. Precious metal ETCs must be backed by the physical asset, but softer commodity ETFs are usually synthetic. The Americans never took to synthetic ETFs.
Another ‘innovation’ in the field is the creation of actively managed ETFs. This really does confuse the picture. Instead of passively tracking an index the managers of these instruments try to outperform it by picking winners. Of course, they need compensation for the intellectual effort, which means that fees are higher, negating the most important selling point of ETFs.
A further move is for ETFs to ‘short’ the market, so that they rise in value when the market falls (through derivatives). Going even further, you can get double the effect of the market fall. Not only are these types of ETFs more expensive to hold, but the other side of the coin from gaining double if you guess right is that you lose double if you guess wrong. As well as these ‘inverse ETFs’ there are other ‘leveraged’ ETFs that rise a multiple of an underlying market’s rise.
Advantages and disadvantages
Among the advantages of ETFs are the following:
- They are listed companies on stock exchanges with active secondary markets. Being open-ended, there is no danger of over-supply of shares as ETF managers always stand ready to buy.
- They trade at, or very near to, net asset value and track the index closely (although some are closer than others) – a smaller ‘tracking difference’.
- They can be traded at real-time prices throughout the day.
- They incur low management and other costs, which are transparent.
- No stamp duty is payable.
- Many can be held in an ISA or self-invested personal pension to save tax. Non-UK registered ETFs may not have these tax benefits – check before buying.
- They can be bought to gain exposure to foreign markets cheaply.
- ETFs offer a much wider choice of markets to track than unit trusts trackers, ranging from Brazilian shares to commercial property and hedge funds.
- There is transparency on what your money is invested in with physical ETFs.
There are, however, disadvantages:
- Stockbrokers’ fees can eat into profits of frequent traders.
- If the ETF provider does not buy the underlying securities, but instead relies on derivatives, additional risks are introduced.
- If you want to drip-feed money into your fund each month this is likely to be more expensive with an ETF than a unit trust or OEIC because of the charges associated with buying and selling.
- Physical ETFs may lend out the shares in the portfolio to other financial institutions for a fee (who may, for example, sell them expecting to buy them back later at a profit). If they do not return them, investors in the ETF are exposed to the risk of loss (despite the holding of some collateral from the borrowers). The risk of such a failure is very small, but not unimaginable. Check to see if your ETF provider lends its securities, and whether the fees received are split with you.
- There is no Financial Services Compensation Scheme protection (see Chapter 19) if the fund goes bust.
- ETFs have become so big that their buying and selling actions move markets. Consider a £2 billion ETF invested in junk bonds (see Chapter 6), but a general loss of confidence in the economy will lead to an avalanche of sell orders for the ETF. The EFT sponsor would be obliged to redeem them by selling the underlying junk bonds just at a time of market panic when there are few buyers around.
Article 5.7 - How would ETFs fare in a market downturn?
Exchange traded funds may be cheap, but they come with a host of risks and are largely untested
By Ian Smith
This fast-growing investment vehicle is rewiring investors’ interaction with the public markets, but as it has grown so have concerns about whether it is distorting market valuations and feeding volatility.
With all the money that has rushed into ETFs over the past decade, no one quite knows what will happen when the current bull market for equities, in particular, comes to an end. Are retail investors aware of the risks to which they are exposed? How would the complicated infrastructure underlying these investments function at a time of market stress?
Most ETFs in Europe are so-called “Ucits” products, so fall under the same regulatory rules as their fund cousins, providing some security in the segregation of underlying assets. The end of the current bull market will partly play out through ETFs, and there is uncertainty about how they will withstand sudden shocks.
How it could come undone
If the robustness of ETFs as an investment vehicle has yet to be tested by a sustained market sell-off, there have been other signs to unsettle investors. ETFs played a role in the flash crashes of May 2010 and August 2015, as the market-making activity that underlies even the most straightforward fund broke down.
The US Securities and Exchange Commission’s review into the 2015 episode makes sober reading. According to the SEC, exchange traded products (including ETFs and more) “experienced more substantial increases in volume and more severe volatility” than standard stocks.
The market making activity behind ETFs is intended to make sure that the fund rarely trades at a discount or premium to its net asset value: in other words, it mirrors the value of the stocks or bonds held within it.
But this relies on the market makers, so-called “authorised participants” — commonly an investment bank — buying when units are at a discount to the underlying assets, and selling at a premium.
The suspicion is that those players are happy making a margin by providing liquidity in calm markets, but that they will disappear if things get choppy.
There are nonetheless reasons to be optimistic. In the largest products, where most of the money sits, about 90 per cent of trading that occurs is in the secondary market, according to Vanguard’s research. That means ETF investors are passing investments between themselves, and not having to transact with fund managers.
Those defending ETFs argue that there is a range of investors with different time horizons, including longer-term investors who will hold through the cycle. If buyers could not be found in the secondary market, the market makers will turn to the fund managers, or “sponsors”, to source the units.
In the worst-case scenario — the manager struggles to sell the underlying securities — the ETF investor could be handed them in lieu of cash. So when buying an ETF, an investor should consider whether they are happy, in an extreme case, to end up holding those underlying investments. Would you be happy to dispose of some high-yield bonds?
![]()
Source: Financial Times, 13 October 2017
© The Financial Times Limited 2017. All Rights Reserved.
Investment trusts (investment companies)
Investment trusts (companies) place the money they raise in assets such as shares, gilts, corporate bonds and property. Unlike unit trusts, they are set up as companies (they are not trusts at all) and are subject to company law.8 If you wish to place your money with an investment trust you do so by buying its shares. Investment trusts are floated on the London Stock Exchange where there is an active secondary market. They are described as closed-end funds because they do not create or redeem their shares on a daily basis in response to increases or decreases in demand (in contrast to unit trusts, OEICs and ETFs). The number of shares is fixed for a long period of time, as with any other company that issues shares.
The trust will have a constitution9 that specifies that its purpose is to invest in specific types of assets. It cannot deviate from this. So it may have been set up to invest in Japanese large company shares, US biotechnology shares, or whatever, and it is forbidden from switching to a different category of investment. This reassures the investor that money placed with a particular trust to invest in, say, UK large companies won’t end up in Russian oil shares. Of course, if you want to take the risk (and possible reward) of investing in Russian oil shares you can probably find an investment trust that specialises in these. There are, after all, about 380 investment trusts quoted in London, with total assets of over £160 billion, to choose from.
As a company an investment trust will have a board of directors answerable to shareholders for the trust’s actions and performance. With investment trusts being closed-end funds the amount of money under the directors’ control is fixed, which enables them to plan ahead with confidence unconcerned that tomorrow investors may want to withdraw money from the fund. Investors cannot oblige the trust to buy the shares should they want to sell (in contrast to unit trusts and OEICs). They have to sell to another investor at a price determined by the forces of supply and demand in the secondary market. Purchases and sales are made through stockbrokers in the same way as for any other company share.
The selection of investments for the trust and the general management of the fund may be undertaken by an in-house team of investment managers who are employees of the trust (a ‘self-managed’ trust), or the investment management task may be handed over to external managers. Most are externally managed. In addition to the 380 or so investment trusts, around 100 investment companies are venture capital trusts (VCTs) which are given tax breaks by the UK government to encourage investment in small businesses not listed on a stock market. (See Chapter 17 for more on VCTs.)
Discounts and premiums
There are two factors influencing the share price of an investment trust. First, the value of the underlying assets owned by the trust. This is expressed as a net asset value (NAV) per share. In theory the trust’s share price should be pretty close to the value of the assets held. But in practice they frequently sell at a large discount to NAV – only a few sell at a premium to NAV. Discounts of 10–20 per cent are not uncommon and they have even reached 68 per cent. The main factor that drags the price below NAV is the lack of demand for the shares. Here is a typical scenario.
Example - Net asset value
In year X there is great interest in, say, eastern European smaller companies so an investment trust is set up and offers its shares (say, 50 million) for sale at £1 each. With the money raised, £50 million of eastern European company shares are bought by the trust. For the next year the underlying assets (all those shares in Polish companies, etc) do no more than maintain their value of £1 per investment trust share, and so NAV is constant. Nothing in the fundamentals has changed. However, enthusiasm for investing in these up-and-coming nations grows among the UK investing public. The investment trust shareholders who want to sell find that they can do so in the LSE secondary market at above NAV. New buyers are willing to pay £1.08 per share – an 8 per cent premium to the NAV.
However, in the following year a worldwide recession strikes and investors head for safe havens and pile into bonds and familiar shares at home. The NAV of the trust’s shares falls to 60p as prices plummet on the eastern European stock exchanges. What is worse for the investment trust shareholders is that sentiment has become so pessimistic about eastern European companies that they can only sell their shares for 50p. They trade at a discount of 16.67 per cent to NAV (10p/60p).
Discounts may seem to present an excellent opportunity: you can buy assets worth 60p for 50p. However, they can be bad if the discount increases during the time you hold the shares. As you can see from the last column in Box 5.2, the discounts can be quite substantial. The Financial Times publishes the share prices and NAVs of investment trusts (companies) daily on the ‘Share Services’ pages. Additional information about individual investment trusts is at www.ft.com.
While much of the discount on a typical investment trust is due to negative sentiment there are some rational reasons for shares selling below NAV:
- Investors may think trust managers are incompetent and likely to lose more value in the future.
- NAV is calculated after deducting the nominal (stated book) value of the debt and preference shares. In reality, the trust may have to pay back more on the debt and preference shares than this.
- Liquidating the fund incurs costs (contract cancellations, advisers’ fees, stock brokers’ fees) so NAV is not achieved.
- The NAV is calculated periodically and so might be months out of date – it could be that current investors are allowing for property market declines since the last valuation say.
While most investment trusts invest in stock market quoted companies there are private equity investment trusts which invest in companies not quoted on a stock exchange, either directly buying their shares or by placing the money with other fund organisations that invest in private firms.
Box 5.2 - Investment trusts appearing in the Financial Times
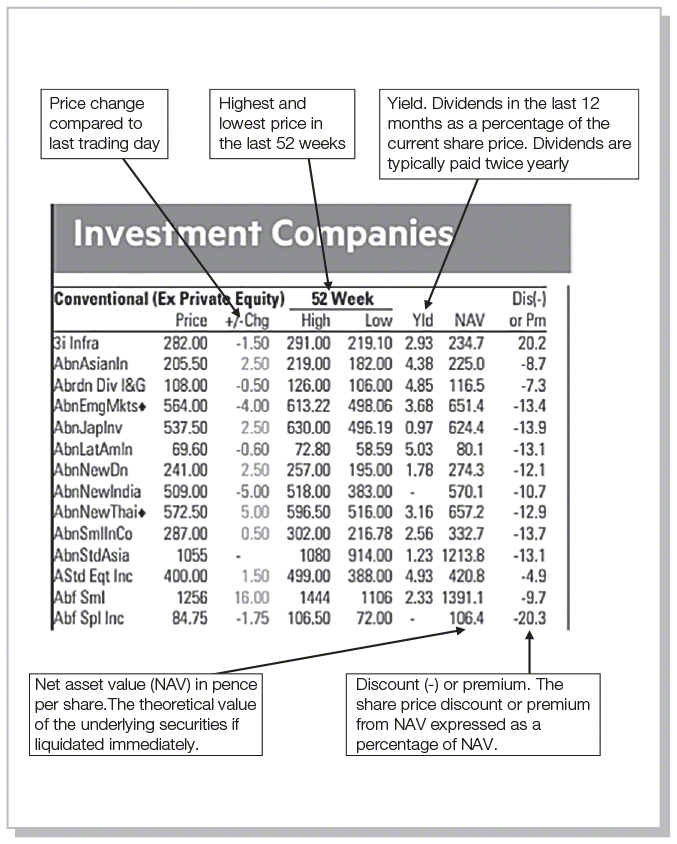
Source: Financial Times, 6 June 2019.© The Financial Times Limited 2019. All Rights Reserved.
Costs for the investor
When buying (or selling) investment trust shares commission will be payable to your stockbroker10 as usual when buying shares (see Chapter 4). There will also be the market maker’s spread between the buying and selling price. This is generally 1–2 per cent, but for less frequently traded trusts it can be 5–10 per cent.
The fund managers’ costs for managing the investments and for administration are charged to the fund, either against annual income or against capital. A typical ongoing charge figure, OCF, (or TER), including the costs of investment management and administration, directors’ fees, audit fees and share registration expenses, is between 1.3 and 2.0 per cent,11 but this excludes performance fees that managers sometimes take. Ongoing charges on some particularly low-cost equity-invested funds can be as low as 0.44 per cent, but most property-focused investment trusts and private equity investment trusts tend to cost north of 2.5 per cent. See www.theaic.co.uk for ongoing charge rates and performance fee rates.
Borrowing
Investment trusts have the freedom to borrow (unlike unit trusts or OEICs). Borrowing to buy assets is fine if the return on assets over time exceeds the interest charged. However, it is a two-edged sword. The risk associated with gearing up returns becomes all too apparent when asset values fall.
Take the case of our trust investing in eastern Europe. If it had sold 50 million shares at £1 each and also borrowed £50 million to buy £100 million of eastern European shares the NAV would still start at £1 per share (£100 million of assets minus £50 million debt owed, for 50 million shares). If underlying asset values fall by 40 per cent because of the fall in the Warsaw Stock Exchange, the net asset value per share falls dramatically from £1 to 20p – an 80 per cent fall – because the assets fall to £60 million, but the debt remains at £50 million:
| Value of eastern European shares | £60m |
| Less debt | £50m |
| £10m | |
| Net asset value per share: £10m/50m = 20p | |
You can see why trusts that borrow a lot can be very volatile.
Tax
Capital gains tax is not payable by a trust on gains made within the trust. The income received by the trust is taxed, but then shareholders receive a tax credit to reflect the fact that tax has already been paid. Shareholders pay capital gains tax on the sale of their IT shares in the normal way (see Chapter 17). ISAs or a personal pension can be used to hold trust shares. Stamp duty of 0.5 per cent is payable when buying IT shares.
Split-capital investment trusts (‘dual capital’ trusts)
Around the turn of the millennium many perplexed trust shareholders lost a lot of money on split-capital investment trusts, largely as a result of not understanding the nature of the financial instruments they had bought. In the late 1990s they were often told that ‘split’ shares were some of the safest you could buy. The reality was that many of these shares were highly risk-loaded.
Split-capital trusts simultaneously issue different types of shares – the shares are ‘split’ into different forms. Generally, they offer income shares that entitle the holder to receive all (or most) of the income from the investment portfolio, such as dividends from underlying shares, and capital shares that entitle the owner to receive all (or most) of the rise in the capital value of the portfolio over the life of the IT, but not to receive dividends. Splits have a specified number of years (usually fewer than ten) of existence so that the capital shareholder knows when these shares will pay out (and the income shareholder knows when payments will cease).
Income shares offer a relatively high income to compensate for the low predetermined sum that will be paid at the end of the trust’s life when the shares are redeemed (some pay the initial amount back, some may only pay 1p at the end). The high yields on these shares seem very attractive to some people (the retired), but these investors must also weigh up the potential loss on capital value of the shares. For example, a £1 share that offers an income of 15 pence per year may seem good value, but not if the capital value is declining at 12 per cent per year. Also the income is not guaranteed and is likely to fluctuate from year to year.
Capital shares attract investors wanting high exposure to rises in stock markets. The drawback is they are last in the queue for payouts after all the other classes of shareholders have received their entitlements. So if the trust goes into liquidation they are unlikely to get anything back.
While splits started with these two categories of shares it wasn’t long before other types appeared. For example, some trusts issued income, capital shares and a third type of share called zero dividend preference shares. ‘Zeros’ pay no income during the life of the trust but they do offer a predetermined return at the end. They are therefore less risky than income or capital shares.
The problem that arose in the period 2000–02 was that many split-capital investment trusts borrowed significant sums of money. Debt interest and the capital repayment on debt take precedence over the payout to zero or to capital and income shares on an annual basis or in liquidation. When the stock market declined, the effect of this gearing was to exaggerate the fall in trusts’ underlying share values. What really messed things up for shareholders of splits was that many trusts surreptitiously invested large proportions of their funds in other highly borrowed splits (over 70 per cent of the fund was invested in other splits in some cases). They were later accused of artificially keeping other splits alive as a form of mutual back-scratching between trust managers. Panic ensued as investors realised the danger to which they were exposed, especially for those in the technology sector. Some lost 90 per cent or more of value on their shares.
Zeros were supposed to be very safe because of the guaranteed payout at the end and the superiority over other shares for any payout. However, the gearing and the cross-shareholding in a declining market meant that in many cases they failed to pay out the promised amounts – some became worthless.
There are two lessons from this story: keep an eye on the borrowing and on cross-shareholdings in other trusts. The FCA has now tackled the latter problem by removing the scope for cross-shareholdings. Note, however, that investment trusts have a lower level of protection for investors than unit trusts or OEICs. They are regulated by company law and the FCA’s listing rules, but people who buy shares in investment trusts other than through advisers are not covered under the Financial Services Ombudsman Scheme. Note however that the person appointed as fund manager must be authorised by the FCA as competent.
Dividends and yields
Investment trusts have an advantage over unit trusts in being able to pay out dividends even if the underlying shares in the fund are cutting their dividends or interest. They can make these payments out of ‘revenue reserves’ (income received in the past but not paid out to shareholders). The use of this power means there might be a difference between the advertised yield, based on the dividend paid by the IT, and the yield based on the income that it receives. The article below describes research showing investment trust out-performing open-ended funds such as unit trusts and OEICs.
Article 5.8 - What makes the investment trust model a winner?
Closed ended funds have outperformed in the past, but this is no guide to the future
By Merryn Somerset Webb
What if I told you there was a type of investment vehicle you could have bought 18 years ago that would have beaten the type you mostly own by about 1.4 per cent per year every year since? You’d do the sums pretty quickly (18 years of that scale of compounding adds up). And my guess is that you’d then want to own it pretty quickly too. Good news. You can have that vehicle.
According to research by Professor Andrew Clare and Dr Simon Hayley of Cass Business School, it is investment trusts (also known as closed-ended funds). These are listed companies, the business of which is investing. Upon listing, they issue a set number of shares that trade and can be bought and sold just like any other share. Unlike the more popular kind of fund in the UK — open-ended funds (OEF) which constantly issue and cancel units based on investor demand — investment trusts have a set pool of long-term capital to invest.
It has long been suspected that closed-ended funds outperform their open-ended counterparts, but these numbers are particularly fascinating. That’s partly because it is the first study of this type to be done by neutral academics rather than industry supporters, but mainly because the gap is way bigger than past studies have suggested (usually about 1 per cent).
Cass did a little work to try to explain the difference. Some of it is down to sector bias — investment trusts have had more of a slant to smaller companies than OEFs (and smaller companies tend to outperform). There’s also a small impact from gearing (investment trusts can borrow money to invest, and this can have a positive influence on returns) and from share buybacks (which reduce the number of shares in issue and so push up the value of the remaining shares).
Then there is a small effect from “survivorship bias” (bad funds die fast). But even after you have added up all these effects, say Prof Clare and Dr Hayley, 0.84 per cent per year of performance remains unaccounted for. As all compounding obsessives know, that’s a difference that adds up to real money.
The next question then has to be, what did Cass not take account of that could explain the rest? One factor is governance. Investment trusts have boards whose job is to represent the interests of shareholders. For disclosure, I sit as a non-executive on two investment trust boards, Baillie Gifford Shin Nippon and Montanaro European Smaller Companies…
Good boards keep admin costs consistently low. They keep the managers on their toes (it’s all too easy for fund managers to forget that they are the service providers to investment companies whose assets they look after, not the owners of those assets). And they can bring valuable experience to the investment process.
There are fees. Cass used net of fee numbers for its research, and the fees charged on investment trusts have historically been lower than those of OEFs. I reckon that could account for 0.3 per cent (ish) of the difference. But the really interesting — and utterly unmeasurable thing — might be manager mindset. Does knowing that they are working with permanent capital help the managers of investment trusts make better long-term decisions? Being academics, the report’s authors can’t be too enthusiastic about this but they do headline their research with the phrase “Investment Trust structure may be more conducive for active management”.
So what’s the catch? When you have lots of data, you have lots of caveats — but the key one is this. These numbers tell us much about the past. They tell us less about the future.
As the authors make clear, you can can’t say that investment trusts outperform. You can only say that they have outperformed. Which is different — and awkward given that all you want to know is what will happen in the future.
I can’t read it any more accurately than anyone else (as regular readers will know). But there are a few factors to consider. First, investment trust fees aren’t lower any more. They are at best on a par with OEF fees, and often more expensive. Second, issuance. Last year saw the highest levels of issuance in the investment trust sector for 10 years (up 77 per cent on 2016). Not all of those funds will survive. Third, gearing. Cash is cheap and boards have started to borrow long term (the Scottish Mortgage Trust has just taken out a 30-year loan). If markets keep going up, all that borrowed money will quickly pay its way. If they do not, it might do the opposite. Let’s not forget that investment trust outperformance has come against a background of generally rising markets. Finally, discounts. These are not discussed in the Cass paper (understandably so, as the authors were mostly attempting to measure managerial skill and compare like with like). That meant looking only at the net asset value of investment trusts, not at their share prices — which can diverge hugely from the underlying asset value represented by each share.
But in the real world, for real investors, the shift in the discount (or premium) to the net asset value can make a major difference. Let’s say you buy a share at a 5 per cent premium to its 100p net asset value (so 105p). The market falls and the net asset value does too, to 80p. At the same time the premium disappears and the shares start trading on a 10 per cent discount, so 72p. You haven’t lost just the 20p in net asset value, you’ve lost 33p. Ouch.
That risk is worth paying attention to. According to Winterflood, the average discount across the investment trust sector has been 9.4 per cent since 1989. Today, it is 4.2 per cent — something that suggests an about turn ahead. You can make a case for discounts being permanently lower if you try. More boards have put in place discount control mechanisms and aggressive buyback policies for example, but generally speaking, ignoring such firm market messages can be a mistake.
So should you be looking to hold more investment trusts in your portfolio? Even with all the worries about discounts, fees and leverage, my answer would still be yes. We can’t explain away the full outperformance of the past without constantly returning to the idea that something in the investment trust structure makes managers better. That doesn’t make investment trusts magic. But it might make them special.
Merryn Somerset Webb is editor-in-chief of MoneyWeek. The views expressed are personal. [email protected]. Twitter: @MerrynSW
![]()
Source: Financial Times, 22 June 2018
© The Financial Times Limited 2018. All Rights Reserved.
Useful websites for investment trusts
| www.theaic.co.uk | Association of Investment Companies |
| www.uk.advfn.com | ADVFN |
| www.bestinvest.co.uk | Bestinvest |
| www.citywire.co.uk | Citywire |
| www.ii.co.uk | Interactive Investor |
| www.investegate.co.uk | Investegate |
| http://www.morningstar.co.uk/ uk/investmenttrusts | Morningstar |
| www.theitlist.co.uk | Theitlist |
| www.trustnet.com | Trustnet |
| www.whichinvestmenttrust.com | Whichinvestmentrust.com |
Investment platforms or supermarkets
Investment platforms (also called fund platforms or investment supermarkets), available online or offline, allow you to invest in a range of unit trusts, investment trusts, ETFs, OEICs, shares, corporate bonds and gilts. You can pick one, two or a dozen funds and other investments from one or many different management companies. Furthermore, you can hold the funds within an Individual Savings Account (ISA) or a Self-invested Personal Pension (SIPP) to obtain tax benefits (see Chapter 17).
Additional services include two investment reports each year showing a valuation and performance record of all your different funds and other investments brought together, and the ability to switch to alternatives funds within a portfolio, ISA or SIPP for a low (or no) charge. Also, a consolidated annual tax report and tax certificate will be sent to you (usually in May) which will detail all the income received into your account in the tax year to 5 April, making your tax return easier to complete. The platforms often employ experts providing analytical reports of funds and shares available to clients, usually on the website.
You can open an online account with a debit card (or send a cheque) and start buying funds with only a £500 lump sum or by adding £50 per month to your account with a regular savings plan. While you are deciding where to invest or just want to sit out of the market, you can simply hold cash within your cash account at the platform. When buying shares or bonds platforms often offer cheap share dealing – for as little as £5 per deal for frequent traders (normally around £10–£15 for infrequent traders).
Investment supermarkets have helped reduce the demand for independent financial advisers (IFAs) because investors can select from a wide range of investments without needing to pay advice fees. Platforms stress that they do not give advice or recommendations, but they do provide information and guidance to try to make investors aware of the various alternative investment options and type of account open to them. Some do this through an online questionnaire, which elicits responses to draw your attention to issues such as your risk tolerance given your family’s financial position. In short, platforms are only for those who are comfortable making their own investment decisions. Before bypassing IFAs you might like to consider the following:
- You may need more tailored advice, especially given the bewildering choice (there are at least 4,000 funds). You will be required to pay for this advice separate to any investments.
- Some are not true supermarkets allowing you to choose from a very wide range, but merely act as portals for selling specific funds they have selected. Others have thousands of funds from all sorts of fund management companies
Holding investments via a platform should be relatively safe given that they are regulated by the Financial Conduct Authority (FCA). Your investments will be held in a ‘nominee’ account, which means you’re not the legal owner but are entitled to receive what you’re owed. If a platform goes bust or runs off with your money you’ll only be covered by the Financial Services Compensation Scheme (FSCS) for up to £85,000 (see Chapter 19).
How are platforms rewarded for the service they provide?
These platforms have an income from the brokerage fees charged for buying and selling shares, investment trusts, ETFs, gilts and bonds for you and from running your ISA or SIPPs (say 0.5 per cent per year of the value held). They also place the cash you deposit with them elsewhere (usually with banks) to gain a higher return than you receive. Furthermore, the platform might charge you for reinvesting dividends received and for transferring your investments to another platform or broker (‘exit fees’). Some platforms have switched to charging a flat fee rather than a percentage of the value of your fund portfolio – say £30 per quarter. Others charge a percentage of the funds’ value in your portfolio, say 0.35 or 0.45 per cent per year as a ‘platform fee’.
Pressure is coming from platforms for fund managers to reduce charges for investors. Hargreaves Lansdown clients pay a platform charge of 0.45 per cent (which falls to 0.25 per cent if your portfolio is between £250,000 and £1 million). Rival Fidelity has an annual fee of £45 if you have less than £7,500 invested, but its standard fee is 0.35 per cent (0.2% if you hold more than £200,000). AJ Bell charge 0.25% custody charge up to the first £250,000 invested. Other rivals charge a fixed amount or charge higher or lower amounts on each transaction. So shop around. Article 5.9 criticises the platform charges.
Article 5.9 - Hit the switch for profiting investment platforms
The FCA needs to make it easier and quicker to move your money
By Merryn Somerset Webb
At a panel I chaired a few weeks ago a representative of a well-known investment platform took the chief executive of a well-known fund management firm to task for the high fees his sector charges. Glass houses, came the reply, glass houses (I paraphrase).
The audience considered this to be fair comment. After all, the granddaddy of the platform sector, Hargreaves Lansdown, regularly reports profit margins of upwards of 40 per cent to its happy shareholders. None of the others, as far as I know, gets to those heady levels of profit but they have a pretty good stab at it — as anyone who has attempted to figure out how much their investment platform charges them every year will know.
There are admin charges, dealing charges, regular investment charges, dividend reinvestment charges, charges for holding cash, charges for withdrawing cash and of course exit fees for those who try to leave. But it is all made more complicated by the fact that all the platforms offer different structures.
Some have minimum monthly charges while others cap the monthly charges. Some give you a number of “free” trades a year or waive the admin fee if you trade in any given month. Some charge flat fees and others charge percentage-based fees. It’s all horribly confusing and there is no one way through it.
You can’t just look at the basic platform fee, figure it gives you enough of a signal and take it from there: you have to factor in your own behaviour. The price, you see, will be different depending on how you invest — how often you trade and which products you trade in and out of, such as shares, exchange traded funds, funds or retail bonds.
A half-percentage point difference in expenses on a £500,000 Sipp growing at 6 per cent over a 10-year period will make a difference to your retirement wealth of £40,000. But it also isn’t just about cost. You will also want to factor in your own ideas of what constitutes value.
Is it purely tip-top service? Is it research and portfolio tools? Is it the certain knowledge that the platform is solvent? No one wants the admin hell of a bankrupt Sipp provider. Or perhaps, as it is for me, is it the ability to exercise what should be your rights as a shareholder (some platforms are better than others at making it relatively easy for you to vote at AGMs, for example)?
Enter the Financial Conduct Authority. Its interim report on investment platforms, published this week, has looked at the market; come to some tentative conclusions; and offered some tentative recommendations. It’s all focused, quite rightly, on value for money. The FCA is bothered by lack of transparency and complications when it comes to charges. It points out that some platforms charge double that of the cheaper alternatives (from 0.22 per cent to 0.54 per cent) and that the uninitiated can have some trouble figuring out how that happens.
These are valid concerns, particularly given that the FCA found that 29 per cent of users do not know whether they pay platform charges or think they do not pay any.
However I am not sure any regulatory action is required here — and certainly there is no reason to make everyone have the same fee system. As long as providers are encouraged to make their fees transparent, comprehensible and comparable, that side of things really is fine.
I don’t mean that they shouldn’t be nagged relentlessly about their fees. Of course they should. They could be encouraged to charge the same for trading and holding all asset classes; to stop charging people for holding cash (this is just plain wrong); and to lay everything out on their websites rather more clearly, for example.
However it is worth noting this nagging is well under way and that services already exist that allow you to figure out your total charges.
Comparefundplatforms.com gives you total annual costs of investing your particular mixture of funds and shares. Yourbroker.info does something similar. You can also go to AJ Bell’s youinvest.co.uk, take a stab at what kind of assets you might hold and how much you might trade them and check out what their charges will come to compared with those of the “market leader” (always Hargreaves Lansdown and always more expensive).
What really matters, then, is not how each platform operates. It is that if we don’t like how it operates and want to switch, we can do it quickly, easily and cheaply. Competition in the fintech market might mean that a new platform suddenly looks better than the old. You might decide you want to use managed portfolio tools that come cheaper elsewhere. You might want better service. You might be shifting from being a stock investor to being a fund investor. Whatever. You have to be able to make that decision and check out.
Successful and honest competition relies on customers being able to switch products as and when they like. That doesn’t happen now. Instead, the FCA report tells us that the switching process is “complex and time consuming”. It is possible to complete a transfer in a few weeks, and some do. But I am told that very often it takes two months and in the worst cases sometimes five months. Imagine the stress of either being out of the market (when all providers tell you endlessly how risky that is) or having your assets in limbo for that long.
Transferring can also be bizarrely expensive: to shift a £500,000 Sipp portfolio from one platform to another can cost up to £1,300.
Merryn Somerset Webb is editor-in-chief of MoneyWeek. The views expressed are personal. [email protected]. Twitter: @MerrynSW
![]()
Source: Financial Times, 20 July 2018
© The Financial Times Limited 2018. All Rights Reserved.
Useful websites
| www.alliancetrustsavings.co.uk | Alliance Trust Savings |
| www.barclays.co.uk/smart- investor | Barclays Smart Investor |
| www.bestinvest.co.uk | Bestinvest |
| www.cavendishonline.co.uk | Cavendish Online |
| www.charles-stanley-direct. co.uk | Charles Stanley |
| www.chelseafs.co.uk | Chelsea Financial Services |
| www.cofunds.co.uk | Cofunds |
| www.comparefundplatforms. co.uk | Compare Fund Platforms |
| www.fundsdirect.co.uk | Fundsdirect |
| www.fidelity.co.uk | Fidelity |
| www.hl.co.uk | Hargreaves Lansdown |
| www.ii.co.uk | Interactive Investor |
| www.selftrade.co.uk | Selftrade |
| www.share.com | The Share Centre |
With-profits policies
Hardly anyone buys with-profit policies these days. After reading the disadvantages you will appreciate why. Because millions of UK citizens still have hundreds of billions of pounds saved in old with-profits funds, I’ll describe the nature of these ‘investments’ here.
With-profits policies could be in the form of an endowment policy (often linked to a mortgage), a personal pension or a long-term investment in with-profits bonds. Many company pension schemes are also invested in with-profits funds. Technically and contractually, a with-profits policy is a form of life insurance (there is a payment on death). In reality, the majority of policies are essentially savings products with a nominal insurance content.
With-profits policies generally work as follows. Life insurance companies set up a fund and invite people to place their savings in the fund either as a lump sum or through a regular savings plan (say, £20 per month). The fund then invests in a range of international and UK shares, bonds, property, etc. The life insurer guarantees a minimum return to be paid out at the end of the policy life, which can be five, ten or even 25 years away. This is called the basic sum assured. Suppose, for the sake of argument, that this is £10,000 in ten years’ time. When the underlying investments in the fund produce returns the policyholders are given ‘bonuses’ – a share of the profits the insurance company has achieved on the invested money. Policyholders receive a reversionary bonus (also called a regular, annual or interim bonus) annually. This is added to the policy’s guaranteed sum.
However, if the year’s returns have been particularly good – say, the stock market rocketed – the policyholders will not receive a reversionary bonus of the same magnitude, because insurance companies attempt to smooth reversionary bonus rates over time, avoiding sharp changes from one year to the next. They hold back profits in good years so that they can maintain a reasonably good reversionary bonus in years of poor investment performance. This is called smoothing.
Once the reversionary bonus is added to the fund it cannot be taken away. So, if the basic sum assured starts at £10,000 and at the end of the first year the insurance company announces a reversionary bonus of 4 per cent the new guaranteed sum becomes £10,400. The guaranteed amount is payable on death or at maturity of the policy.
Thus, as profits are made on underlying investments the insurance company locks in a return for the policyholder that cannot be taken away. So even if, in future years, shares, bond and property markets crumble, the investor is guaranteed a minimum amount. This is assuming the life assurance company manages to avoid liquidation in such dire circumstances – and this is not always a safe assumption. As well as the reversionary bonuses the insurer pays a terminal (final) bonus at the end of the policy (or on death if this is earlier).
A variation on the theme is unitised with-profits funds. Here the premiums paid by individuals buy units of a fund in a similar way to investing in unit trusts. Unlike the conventional with-profits funds there is no basic sum assured but the bonuses are smoothed.
Treat these schemes with great caution
Criticism has been heaped on with-profits policies.
Insurance companies have far too much discretion over bonuses. With-profits policyholders cannot be entirely sure that they are getting the full benefit from the returns generated using their money. There is a lack of transparency in four areas:
- the underlying investment return
- the smoothing of the return
- the charging of costs
- the connection between the with-profits fund and the insurance firm’s other businesses.
The wide discretion of insurance companies has been used to build up orphan assets (inherited estates). These are reserves that an insurance company holds back from policyholders to act as a buffer should the market decline. There were many years when returns on funds were much greater than the bonuses granted on policies. It would seem that the insurance companies have been far too cautious. In other words, policyholders have been underpaid.
There might be a massive penalty imposed for cashing-in early. Only about one-third of 25-year policies are held to maturity. In many cases holders receive less than the money they put in (and less than the guaranteed value) especially if they surrender the policy within the first three to five years.
With-profits policies are marketed as a low-risk product, but this is not always true. For example, Equitable Life was forced to severely cut the bonuses to some policyholders because it had promised high returns to other savers, and was forced by the courts to pay out on the guaranteed annuities, leaving a shrunken pot of money for everyone else. The lack of transparency at Equitable Life meant that policyholders were unable to discern the risk to their savings until it was too late.
Insurance companies have also been accused of being too optimistic at times. For example, many people were sold endowment policies related to house mortgages. The monthly payments into the policies were set at a level thought to be enough to pay off the mortgage in, say, 25 years. When markets turned sour many shocked policyholders received a letter stating that they were unlikely to have enough saved in the policy to be able to pay off the mortgage at the end of the term – unless, of course, they handed over more money to the insurance company to increase the size of the pot.
There appears to be no correlation between the levels of charges and the performance of the funds.
Insurance company bonds
With insurance company investment bonds you invest a lump sum (usually £5,000 or more) with an insurance company for a fixed period, say five years, in return for a fixed rate of interest and a small element of life insurance. Guaranteed income bonds (GIBs) invest money raised in a portfolio of low-risk bonds, such as gilts, and then pay to the holder a regular income net of basic rate income tax once a year (or monthly). With growth bonds the interest accumulates until the maturity date.
Insurance company bonds are relatively safe investments if held to maturity, but returns are low. If you don’t hold to maturity and choose to cash in early (if the insurance company allows this) you will probably suffer a penalty. With-profits bonds provide a guaranteed bonus, which cannot be withdrawn, plus a terminal bonus which is not guaranteed. You need to read the small print with some guaranteed income bonds. It could be that the guaranteed income (say, a spectacular 10 per cent per year) comes at the price of a loss in the capital value – £10,000 at the beginning of five years is only, say £8,000 at the end.
Distribution bonds (also sold by insurance companies) invest in a mixture of equity, fixed income securities (gilts, corporate bonds) and property, but will be biased toward interest paying instruments. Unlike with-profits funds they do not smooth out income from one year to the next or offer the protection of reversionary bonuses, so the payout fluctuates. Exit penalties for cashing in during the first five years can be high. They are more straightforward than with-profits policies because returns are not clouded by smoothing.
Stock market-linked bonds
Offered by insurance companies, banks, building societies and other investment firms, stock market-linked bonds provide a return that goes up with a stock market index. Products with similar characteristics are called by a variety of names, including structured investment products, defined-return bonds, guaranteed equity bonds and protected bonds. As an investor you commit a lump sum for, say, five years. Typically, the provider offers your capital back at the end, plus all of the increase in, say, the FTSE 100 index over the five years up to a maximum of, say, 65 per cent – if the index doubles you will not benefit beyond the 65 per cent limit.
The provider does not actually buy shares but instead uses the money to buy a mixture of interest-bearing securities (or zero coupon bonds) and derivatives which rise in value if the FTSE 100 rises. So, it could be that £8,500 of your £10,000 investment buys bonds which, after five years, give a return of £10,000. Another £1,000 is used to buy call options on the stock market index which gains in value if the market rises (see Chapter 8), and the remaining £500 is a fee for the financial institution.
With the guarantee that you will at least get back your original lump sum these instruments provide an underpinned way of benefiting should the stock market index rise significantly (assuming the financial institution does not go bust during the five years). However, bear in mind that your return is only linked to the stock market index. This is not the same as receiving the returns by holding, say, the top 100 shares. First, you are missing out on an important element of return, the dividend income. Second, you usually only receive a proportion of the capital gain over the five years, not the full gain. Furthermore, there are stock market-linked bonds that don’t provide complete protection on the downside. If the index falls by more than a stated percentage the guaranteed amount will fall below the initial capital. Some providers offer the investor choices, such as a 100 per cent money-back guarantee plus 55 per cent of the rise in the FTSE 100 index, or a 95 per cent guarantee and 110 per cent of the rise in the FTSE 100.
Many financial product providers came under attack for mis-selling what became known as precipice bonds to investors who thought they were buying a safe investment. Precipice bonds offer the return of the original capital, but only in specific circumstances. If the market index falls below a predetermined level the guarantee no longer applies. So, a typical precipice bond may offer 7 per cent annual income over the next three years. It also offers a return of the initial capital at the end of three years if the market index does not fall by more than, say, 20 per cent from its start level. However – and this is where the danger lies – after the 20 per cent barrier has been breached, for every 1 per cent fall in the FTSE 100 the investor loses 2 per cent of the capital value. Hence the nickname precipice bonds – the value of your savings can fall steeply. Look out for names such as ‘high income’ or ‘extra income’ bonds or ‘plans’. Only invest in these products if you understand and can withstand the downside risk.
Kick-out plans offer investors the return of their original capital plus a coupon, say 10 per cent after 12 months, only if the FTSE 100 index is equal to, or higher than, its level at the start. If the index is lower the plan does not pay out, but continues for another 12 months and then another, and so on, until the original index level is passed. When an anniversary is reached where the FTSE 100 index has climbed back to the beginning level the accumulated coupons are paid. If the coupon is 10 per cent and the trigger occurs on the third anniversary, the investor receives the capital plus 30 per cent. With some of these plans if the index falls more than 50 per cent the investor loses 1 per cent for every 1 per cent fall in the index below its starting level. Beware of counterparty risk. Lehman Brothers made some of these guarantees – just before going bust.
Two final points on stock market-linked bonds:
- The complicated payout conditions on all these bonds mean that investors need to be disciplined enough to read the small print.
- Enquire into the payout if you cash in early – is this guaranteed or dependent on market values?
Money markets
Private investors can place money in money market funds. The money markets are wholesale financial markets (those dealing with large amounts) in which lending and borrowing on a short-term basis takes place (less than one year) between institutions. While the minimum amount needed to buy instruments or deposit money in this market is around £500,000 the private investor can access it through money market funds, which gather together small amounts from hundreds or thousands of investors and then invest in a range of short-term securities. Some of these money market funds require the investor to deposit as little as £1,000, while others demand a minimum of £25,000.
The advantage of pooling money when buying wholesale securities means that better rates of return can be achieved by the collective fund. Also, because the fund is well diversified across borrowing companies, governments and other institutions, the money market fund manager can offer relatively safe returns to private investors.
Typically, a money market fund will have no initial charge. When all the annual costs are included the ongoing charge can typically range from around 0.15 to 0.6 per cent.
The following are some typical instruments held by a money market fund:12
- Treasury bills (lending short-term to the government);
- commercial paper (lending for a few days to companies and other organisations);
- certificate of deposits (lending to a bank).
Money market accounts are often offered by high street banks, the interest rates on which vary with the rates paid on the money markets. Thus, the rate fluctuates frequently, sometimes every day. These accounts may be instant access or you may have to give, say, one month’s notice to access your money. The risks with investing in money market funds are low, but there are some:
- The bank or institution running the fund may go bust.
- The managers may bias the investments held toward the riskier end while staying within the definition of money market, such as securities issued by poorly managed companies. Investigate where the manager actually invests.
- When short-term interest rates are very low these funds may offer virtually no return.
Hedge funds
Hedge funds are collective investment vehicles that admit only a small number of wealthy individuals or institutions. They are free from many types of regulation designed to protect investors, being created either offshore, such as in the Cayman Islands, or onshore as private investment partnerships. To place your money with a hedge fund you are generally expected to have a net worth (excluding your main residence) of at least £600,000 and to be prepared to commit hundreds of thousands of pounds to the fund.
Originally, the word ‘hedge’ made some sense when applied to these funds. They would, through a combination of investments, including derivatives, try to hedge risk while seeking a high absolute return (rather than a return relative to an index). Today the word ‘hedge’ is misapplied to most of these funds because they generally take aggressive bets on the movement of currencies, equities, stock markets, interest rates and bonds around the world. They frequently add to the risk by borrowing a multiple of the amount put in by the wealthy individuals or institutions, or use derivatives to lever up return and risk.
The freedom from regulation is a major selling point for hedge funds as it means that they are not confined to investing in particular classes of security, or to particular investment methods. For example, they are free to go short (selling shares they don’t own in the expectation of buying them back at a lower price later), which they wouldn’t be able to do in many regulated environments. They can borrow over ten times the size of the fund to take a punt on small movements in currency rates. Some are active in the derivatives and a range of other highly specialised markets that traditional domestic investment funds are much more cautious about entering.
Conventional fund managers too often pat themselves on the back if they produce a negative return of 15 per cent while the market fell by 16 per cent. Hedge funds are seen as different in that they are not content with negative performance. Another supposed attraction is that the investments and markets they enter are supposed to have a negative correlation13 with domestic equities – an attractive proposition in a declining equity environment market. But the evidence shows that hedge fund returns frequently decline alongside equity market decline.
If the hedge fund does well the managers receive exceptional rewards. A typical fee structure might be 1–2 per cent of the fund value regardless of performance. On top of this 20 per cent of any generated profits are taken by the managers.
It is impossible to state where hedge funds as a whole sit in the risk–reward spectrum. Some are managed to be relatively safe, while others are dedicated to extreme actions in obscure corners of the financial world. Some have outperformed the FTSE 100 index while many have failed completely (only a fraction of those in business five years ago are still operating). Performance statistics are sketchy but, according to Article 5.10 hedge funds have not done very well on average – not much of a surprise given all those fees. One of the major risks investors have largely ignored is the lack of transparency about where their money is being used, which makes it difficult to assess how the fund would survive extreme and unpredictable markets. There is also a greater vulnerability to fraud due to the opacity of funds and absence of regulations. Moreover, there are now thousands of hedge funds to choose from and there is a fear that there simply aren’t enough talented (and honest) managers to go round.
Article 5.10 - Hedge funds suffer worst year since 2011
By Lindsay Fortado and Laurence Fletcher
Hedge funds had their worst year in seven years as financial market turmoil in the fourth quarter of 2018 caught many off-guard.
Hedge Fund Research’s main index, which monitors funds across strategies, was down 4.07 per cent last year, compared with a 4.38 per cent decline for the S&P. The last time that happened was in 2008 at the height of the financial crisis, when hedge funds fell 19.03 per cent while the S&P plummeted 37 per cent.
Money has already started to leave hedge funds as investors grow jittery, but the redemptions have so far been small.

![]()
Source: Financial Times, 9 January 2019
© The Financial Times Limited 2019. All Rights Reserved.
Bringing home the significance of high fees
When a fund manager or financial adviser tells an investor that the annual fees or deductions payable are 1.5 or 2 per cent of the amount invested it is easy to miss the significance of the figure for the future wellbeing of the investor. It seems to be such a trifling amount and the mind can quickly dismiss it.
To explore how the deductions can impact on the amount accumulated within an investor’s saving fund Table 5.1 below displays some theoretical, but realistic, investment returns over a ten-year period, following a lump-sum £20,000 investment at the outset.
In the first case we have the end value available following self-investment in a broad range of shares that give an average of 8 per cent return per year. In this case (as with all the others), we assume away the bid–offer spread costs associated with buying and selling shares in the markets. Rational investors (as opposed to short-term speculators) keep these costs to a minimum, by trading infrequently. After ten years the savings amount to £39,147, thus the investment fund has almost doubled.
Not all investors have the time, inclination or self-confidence to invest in a broad range of shares and achieve reduced risk through diversification. To lift the burden of investing in the equity market they may approach a professional fund manager. Another good reason to invest through a collective fund is that the investor is faced with prohibitively high transaction costs when placing a small amount of money in a portfolio of shares. Furthermore, there is the hassle of managing a personal portfolio, such as dealing with dividends, rights issues and takeover bids.
Thus, investing via a pooled investment fund makes a lot of sense for many people. What is often overlooked is that paying high fees usually results in poorer returns to the ultimate investor rather than excellence. Some high-quality managers do exist and achieve such high pre-fee returns they can justify the enhanced bonuses of the manager. The problem is identifying these professionals in advance. For most of us the safer option is to look for a low-cost option to achieve a broad spread.
A unit trust, with 5 per cent initial fee or adviser’s fee and 1.5 per cent annual charge split between the fund manager and the platform (Case 2 in Table 5.1), shows a large reduction in investor wealth after ten years compared with the self-invest approach: the fund drops from £39,147 to only £31,973. To hand over more than £7,000 to fund managers to achieve returns equal to the market return (which would put them in the category of one of the better performers) seems a little excessive. By shopping around for a low-cost fund more is available at the end – Case 3 produces £34,873.
If you are sceptical about finding an active fund manager who can outperform the market sufficiently well to justify the high fees, then perhaps you would select to put your money into an exchange traded fund which bought all the shares in a broad market index (or cheap market tracking unit trust, OEIC or investment trust) with a cost of a mere 0.3 per cent per year (Case 4). Such an approach will produce £37,988. This is over £6,000 more than the standard actively managed unit trust.
Table 5.1 Investment returns on self-investment and fund investment under various fees deduction scenarios
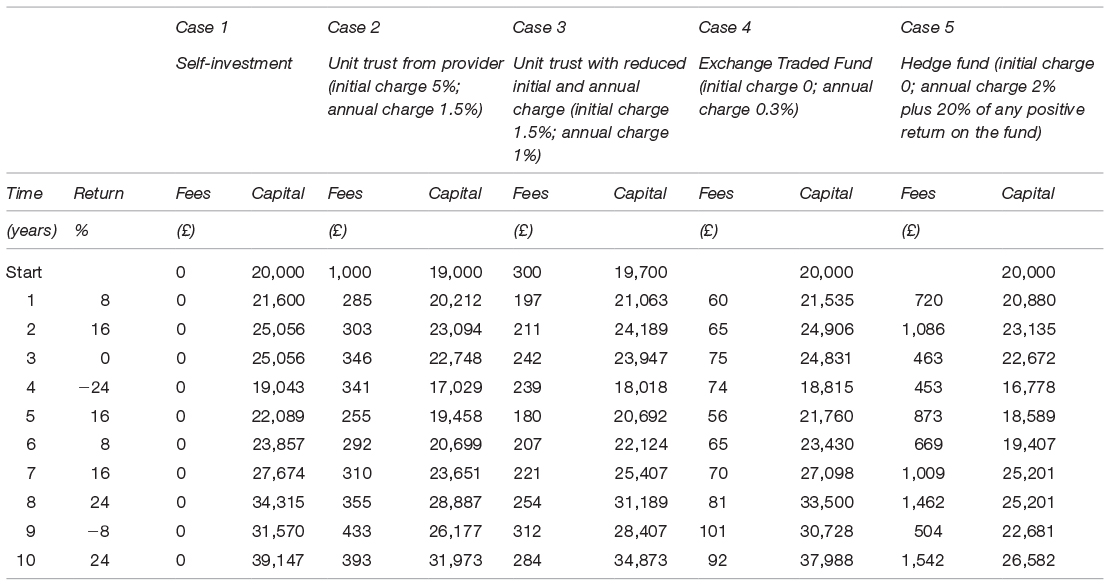
Hedge funds sell themselves on the claim that they can do well in any market, whether the financial markets are booming or collapsing. We discover time and again that hedge funds go down with the rest – with a few exceptions – and that many equity-focused funds are closet market trackers. Again, if you are smart enough to analyse or guess which will outperform perhaps their fees of 2 per cent plus 20 per cent of any positive return are justified.
However, as Case 5 above shows, if the fund merely performs in line with the market, the hedge fund manager takes away so much of the return in the good performing years that the investor is left with only a little more than what they started with. Admittedly, some managers charge less than these percentages. Some also have ‘high water-marks’ which means that they must make good previous years’ negative returns (or, perhaps, a minimum positive return) before charging the performance bonus. This will mitigate this problem, but you still have the difficulty of being really certain that the manager will outperform spectacularly to justify paying a high set annual fee plus bonuses.
Warren Buffett brilliantly describes how fund managers and others in the financial industry have benefitted from the ignorance of ordinary investors in the story of the Gotrocks and the Helpers.
Box 5.3 - Gotrocks and Helpers
By Warren Buffett
Shareholders, through a series of self-inflicted wounds, are in a major way cutting the returns they will realize from their investments. The explanation of how this is happening begins with a fundamental truth: With unimportant exceptions, such as bankruptcies in which some of a company’s losses are borne by creditors, the most that owners in aggregate can earn between now and Judgement Day is what their businesses in aggregate earn. True, by buying and selling that is clever or lucky, investor A may take more than his share of the pie at the expense of investor B. And, yes, all investors feel richer when stocks soar. But an owner can exit only by having someone take his place. If one investor sells high, another must buy high. For owners as a whole, there is simply no magic – no shower of money from outer space – that will enable them to extract wealth from their companies beyond that created by the companies themselves.
Indeed, owners must earn less than their businesses earn because of ‘frictional’ costs. And that’s my point: These costs are now being incurred in amounts that will cause shareholders to earn far less than they historically have.
To understand how this toll has ballooned, imagine for a moment that all American corporations are, and always will be, owned by a single family. We’ll call them the Gotrocks. After paying taxes on dividends, this family – generation after generation – becomes richer by the aggregate amount earned by its companies. Today that amount is about $700 billion annually. Naturally, the family spends some of these dollars. But the portion it saves steadily compounds for its benefit. In the Gotrocks household everyone grows wealthier at the same pace, and all is harmonious.
But let’s now assume that a few fast-talking Helpers approach the family and persuade each of its members to try to outsmart his relatives by buying certain of their holdings and selling them certain others. The Helpers – for a fee, of course – obligingly agree to handle these transactions. The Gotrocks still own all of corporate America; the trades just rearrange who owns what. So the family’s annual gain in wealth diminishes, equaling the earnings of American business minus commissions paid. The more that family members trade, the smaller their share of the pie and the larger the slice received by the Helpers. This fact is not lost upon these broker-Helpers: Activity is their friend and, in a wide variety of ways, they urge it on.
After a while, most of the family members realize that they are not doing so well at this new ‘beat-my-brother’ game. Enter another set of Helpers. These newcomers explain to each member of the Gotrocks clan that by himself he’ll never outsmart the rest of the family. The suggested cure: ‘Hire a manager – yes, us – and get the job done professionally.’ These manager-Helpers continue to use the broker-Helpers to execute trades; the managers may even increase their activity so as to permit the brokers to prosper still more. Overall, a bigger slice of the pie now goes to the two classes of Helpers.
The family’s disappointment grows. Each of its members is now employing professionals. Yet overall, the group’s finances have taken a turn for the worse. The solution? More help, of course.
It arrives in the form of financial planners and institutional consultants, who weigh in to advise the Gotrocks on selecting manager-Helpers. The befuddled family welcomes this assistance. By now its members know they can pick neither the right stocks nor the right stock-pickers. Why, one might ask, should they expect success in picking the right consultant? But this question does not occur to the Gotrocks, and the consultant-Helpers certainly don’t suggest it to them.
The Gotrocks, now supporting three classes of expensive Helpers, find that their results get worse, and they sink into despair. But just as hope seems lost, a fourth group – we’ll call them the hyper-Helpers – appears. These friendly folk explain to the Gotrocks that their unsatisfactory results are occurring because the existing Helpers – brokers, managers, consultants – are not sufficiently motivated and are simply going through the motions. ‘What,’ the new Helpers ask, ‘can you expect from such a bunch of zombies?’
The new arrivals offer a breathtakingly simple solution: pay more money. Brimming with self-confidence, the hyper-Helpers assert that huge contingent payments – in addition to stiff fixed fees – are what each family member must fork over in order to really outmaneuver his relatives.
The more observant members of the family see that some of the hyper-Helpers are really just manager-Helpers wearing new uniforms, bearing sewn-on sexy names like HEDGE FUND or PRIVATE EQUITY. The new Helpers, however, assure the Gotrocks that this change of clothing is all-important, bestowing on its wearers magical powers similar to those acquired by mild-mannered Clark Kent when he changed into his Superman costume. Calmed by this explanation, the family decides to pay up.
And that’s where we are today: A record portion of the earnings that would go in their entirety to owners – if they all just stayed in their rocking chairs – is now going to a swelling army of Helpers. Particularly expensive is the recent pandemic of profit arrangements under which Helpers receive large portions of the winnings when they are smart or lucky, and leave family members with all of the losses – and large fixed fees to boot – when the Helpers are dumb or unlucky (or occasionally crooked).
A sufficient number of arrangements like this – heads, the Helper takes much of the winnings; tails, the Gotrocks lose and pay dearly for the privilege of doing so – may make it more accurate to call the family the Hadrocks. Today, in fact, the family’s frictional costs of all sorts may well amount to 20% of the earnings of American business. In other words, the burden of paying Helpers may cause American equity investors, overall, to earn only 80% or so of what they would earn if they just sat still and listened to no one.
Long ago, Sir Isaac Newton gave us three laws of motion, which were the work of genius. But Sir Isaac’s talents didn’t extend to investing: He lost a bundle in the South Sea Bubble, explaining later, “I can calculate the movement of the stars, but not the madness of men.” If he had not been traumatized by this loss, Sir Isaac might well have gone on to discover the Fourth Law of Motion: For investors as a whole, returns decrease as motion increases.
Source: Warren Buffett, Chairman’s letter to shareholders accompanying the 2005 Annual Report of Berkshire Hathaway. Reproduced with kind permission of the author. © Warren Buffett.
Article 5.11 presents the views of a respected economist on the dangers of paying high fees.
Article 5.11 - The charges laid against us
By John Kay
Over the 42 years that Warren Buffett has been in charge of Berkshire Hathaway, the company has earned an average compound rate of return of 20 per cent per year. For himself. But also for his investors. The lucky people who have been his fellow shareholders through all that time have enjoyed just the same rate of return as he has. The fortune he has accumulated is the result of the rise in the value of his share of the collective fund.
But suppose that Buffett had deducted from the returns on his own investment – his own, not that of his fellow shareholders – a notional investment management fee, based on the standard 2 per cent annual charge and 20 per cent of gains formula of the hedge fund and private equity business. There would then be two pots: one created by reinvestment of the fees Buffett was charging himself; and one created by the growth in the value of Buffett’s own original investment. Call the first pot the wealth of Buffett Investment Management, the second pot the wealth of the Buffett Foundation.
How much of Buffett’s $62bn would be the property of Buffett Investment Management and how much the property of the Buffett Foundation? The completely astonishing answer is that Buffett Investment Management would have $57bn and the Buffett Foundation $5bn. The cumulative effect of “two and twenty” over 42 years is so large that the earnings of the investment manager completely overshadow the earnings of the investor. That sum tells you why it was the giants of the financial services industry, not the customers, who owned the yachts.
So the least risky way to increase returns from investments is to minimise agency costs – to ensure that the return on the underlying investments goes into your pocket rather than someone else’s.
The effect of these costs on returns depends on the frequency with which you deal. Online trading is so inexpensive and easy that you may be tempted to trade often. But only one thing eats up investment returns faster than fees and commissions, and that is frequent trading. Do not succumb. Do not accept the invitation to subscribe to level two platforms or direct market access. The total costs of running your own portfolio should be less than 1 per cent per year.
Investing in actively-managed funds will cost you more. The choice of funds, both open and closed-end, is unbelievably wide. There are more funds investing in shares than there are shares to invest in. This situation doesn’t make sense, and is both cause and effect of the high charges. Costs need to be high to recover the expenses of running so many different, mainly small, funds that all do much the same thing. At the same time, the high level of charges encourages financial services companies to set up even more funds.…
… This plethora of choice would be less confusing if all funds, managers and advisers were excellent, but most are not.
The underlying problem is one of information asymmetry. The marketing of financial services emphasises quality, not price, and for good reasons. It would be worth paying more – a lot more – to get a good fund manager. But since it is hard to identify a good fund manager, good and bad managers all charge high fees, with the consequences described above.…
… The most attractive equity-based funds for small investors are generally indexed funds, exchange traded funds, and investment trusts (closed-end funds) with low charges and significant discounts to underlying assets. These funds provide more than sufficient choice for normal purposes. All of them can be accessed through your online execution-only share-dealing account.
![]()
Source: Financial Times, 31 January/1 February 2009.
© The Financial Times Limited 2009. All Rights Reserved.
_______________
1 Unit trusts have been given the option of single pricing, with charges shown separately. Most still have a bid–offer spread.
2 Some use a mix of historic and forward pricing.
3 Some trusts pay out quarterly or monthly.
4 No UK tax on dividends from investments in foreign securities.
5 Of course, there will also be trading actions in the market place by ordinary investors that bring the ETF price towards the value of the underlying shares. If the ETF is high relative to the underlying then investors will be tempted to sell it, to bring down its price.
6 Unlike ETFs, ETCs may or may not have UCITs safeguards.
7 Swaps allow you to exchange a series of future cash payment obligations. For example, an ETF agrees to receive the percentage return on a share market index such as the FTSE 100 from a counterparty (usually an investment bank). In return the ETF pays the swap dealer the return on another underlying, such as a collection of bonds. The money previously raised by the ETF when it sold shares in itself is invested in these bonds and so the ETF gets the bond return. This can then be passed on to the swap counterparty, so what it receives from bonds it passes on, making this side of the deal neutral. Thus it has a net exposure to the returns on the FTSE 100 in each period (i.e. every trading day). Of course, if the FTSE 100 return for a period is less than the bond return then the ETF makes a net payment to the counterparty and the value of each ETF share falls.
8 There are ‘investment trusts’, which are UK registered and managed in the UK, alongside ‘offshore investment companies’ which are free of some of the UK restrictions.
9 Comprising its memorandum, articles of association and the prospectus on flotation.
10 Investment trusts are also sold through financial advisers and platforms or supermarkets. The trust may also have a savings scheme allowing the investor to buy a few shares each month (starting from as little as £20 per month) or make a lump sum purchase from £250 – see their websites.
11 The ‘annual management charge’, often highlighted by fund managers and shown to be significantly below these percentages, excludes a lot of the costs.
12 For more on money markets consult my guide The Financial Times Guide to Guide to Bond and Money Markets.
13 Negative correlation means that returns go the opposite way: when domestic equities are down the hedge fund instruments are up, and vice versa.