
CHAPTER 2
PROJECTS FOR DELIVERING
BENEFICIAL CHANGE
In this part I describe the project's context, the three elements in the outer ring in Fig. 1.11.
A project is a temporary organization to which resources are assigned to deliver beneficial change. The first step in the management of a project is to identify the need for performance improvement, and then diagnose the change, the new asset, most likely to deliver that performance improvement. You then need to demonstrate how the change will deliver the performance improvement, and this is done through a benefits map.
The need for performance improvement can be a positive thing; all organizations need to improve performance. You may be best at what you do, but if you want to go on being the best you have to remain ahead of the competition (Example 2.1). Or you may be second best in the world, but to become best you have to make a stepwise change in your operations. Or you may have an area of business that is not performing as you would like, and you have to either radically improve it or exit that business.
In this chapter, I discuss how to identify the need for change, diagnose the change required, and draw the benefits map that shows how the new asset will deliver the required benefit. I also consider how projects should be linked to corporate strategy.
Example 2.1 The need for performance improvement
I worked with an insurance company which had had more than 50 percent market share for insurance in the country. They had been very profitable. They were being threatened by low-cost entrants to the market, so they were losing market share. They still had the largest market share, but no longer over half. They had also lost profitability. They were best in their market at what they did, but they were losing that position. They had to improve performance to remain dominant.
2.1 IDENTIFYING THE NEED FOR
PERFORMANCE IMPROVEMENT
There is a simple tool called the performance gap for identifying the need for performance improvement (Fig. 2.1). You have a measure of performance of an area of your business. This may be a quantitative measure, such as level of sales, return on sales, or return on assets. Or it may be a qualitative measure, such as motivation of your employees, environmental performance, or the satisfaction of your customers. Or it may be partially quantitative and partially qualitative, such as rates of absenteeism, noise levels, or number of complaints.

FIGURE 2.1 The performance gap.
For sometime now you have been improving and you want to go on improving to remain ahead of the competition. But you identify that if you remain where you are, performance into the future will actually fall. So the difference between where you are and where you would like to be identifies a performance gap, and you need to fill this gap by undertaking projects to introduce change. If you have a quantitative measure of performance, the predicted size of the gap will indicate the benefit of the change from undertaking the project.
Examples of desired performance improvement have been presented:
![]() In Example 1.2 the Chinese government wanted to improve the economic performance of the costal region on the north side of the Yangtze River. To do that they believed they needed to improve speed of traffic flow across the river at that point.
In Example 1.2 the Chinese government wanted to improve the economic performance of the costal region on the north side of the Yangtze River. To do that they believed they needed to improve speed of traffic flow across the river at that point.
![]() In Example 1.4 the company wanted to improve its quality performance and improve customer satisfaction with its performance.
In Example 1.4 the company wanted to improve its quality performance and improve customer satisfaction with its performance.
![]() In Example 2.1 the company wanted to maintain market share and maintain profitability in its product portfolio.
In Example 2.1 the company wanted to maintain market share and maintain profitability in its product portfolio.
This last example illustrates that performance improvement may mean maintaining current levels. That will be an improvement over the future where current levels are threatened.
The shortfall in performance can be caused by internal or external pressures. Internal pressures can include an aging workforce, changing technology, or strategic initiatives. External pressures can include government legislation, new products introduced by competitors, or changing customer preferences. External pressures driving change are often categorized as being political, economic, social, technical, legal, and environmental, forming the well-known acronym PESTLE. The use of diagnostics or benchmarking can help to identify the need for performance improvement. You can benchmark your performance against other departments from the same company or against other companies. You can make quite detailed and direct comparisons with other parts of the same company, comparing, for instance, productivity, absenteeism, or profit on sales. However, you need to beware that differences in performance are not caused by some fundamental differences in the nature of the work done by the different departments (Example 2.2).
Example 2.2 Differences in performance of different businesses
I worked for a company called Imperial Chemical Industries, ICI, and I was involved in doing investment appraisal for a new process plant for my division making bulk chemicals. The internal rate of return (IRR) was calculated as 15 percent. The main board said that wasn't good enough; they could get 25 percent from speciality chemicals. But if you looked at the end-of-year profits my division was making 15 percent while speciality chemicals was making 1 percent. That was because in bulk chemicals all the costs were in building and operating the plants, whereas in speciality chemicals, all costs were in research and development, spent before the decision to build a plant was taken. Once the decision to build a plant was reached, the returns were high, but there were also high sunk costs to reach that point. However, persuaded by the high IRR from building plants, ICI concentrated on speciality chemicals and withdrew from bulk chemicals. It fell from being the fifth largest company in the United Kingdom and was eventually broken into small businesses. It was wrong to compare the performance of projects in one division with those from another because of the fundamentally different nature of the cost base.
You can also make comparisons with competitors, but the data may be more difficult to come by—your competitors are not going to open their books for you. However, there is a lot of published data. From published company accounts, for instance, you can work out return on sales, return on assets, and levels of working capital. Also it is sometimes possible to compare your performance to published data for the industry, so although you cannot compare your performance directly to a competing company, you can compare to industry norms. For instance, the Construction Industry Institute based in Austin, Texas maintains a database of project performance statistics that can be used to benchmark project performance. A range of diagnostic tools also exists that can help benchmark performance. The CMM model developed by the Software Engineering Institute of Carnegie Mellon University1 can be used to benchmark software development performance, or the OPM3 model developed by Project Management Institute (PMI)2 can be used to benchmark project performance.
Case Study
Throughout the book I use a case study to illustrate the concepts, so we see the project plans and control mechanisms developing as the book progresses. The project is taking place in a company called TriMagi Communications, which supply visual, data, and voice networks, including cable television. Table 2.1 introduces the company and sets out the background to a particular area of performance improvement they hope to achieve. They are seeking two areas of performance improvement:
1. Improve customer quality by:
![]() Never having an engaged line
Never having an engaged line
![]() Reducing the wait time for call to be answered
Reducing the wait time for call to be answered
![]() Reducing the time for a repair engineer to reach customer's premises
Reducing the time for a repair engineer to reach customer's premises
2. Improve productivity and flexibility of staff
2.2 DIAGNOSING THE CHANGE REQUIRED
Having identified the need for performance improvement, we now need to work out what changes we need to make to achieve them. Figure 2.2 illustrates that performance improvement can come from several sources, including:
1. Operational efficiency: changes to work flow, continuity of production, production machinery, the use of automation, and supply chain
2. Organization effectiveness: changes to management processes, information systems, management style, personnel competence, and rewards
TABLE 2.1 Performance Improvement at the TriMagi Communications Customer Repair and Maintenance Offices (CRMOs)
|
TriMagi Background |
|
TriMagi Communications is in business to supply visual, voice, and data communication networks based on its leading edge in glass fibre and laser technology. It will supply two-way cable television services to domestic and educational customers, data communication networks to these and commercial customers, and telecommunication services through its cable and data networks. It will be the first choice provider in the European countries within which it operates. It currently operates in its home base of the Benelux countries (Belgium, the Netherlands and Luxembourg), but plans to expand into other European countries. |
With its expansion in Europe, TriMagi Communications intends to rationalise its Customer Repair and Maintenance Offices, CRMOs, in the Benelux countries, starting in its home base in Holland. There are currently 18 CRMOs in the region. Each office is dedicated to an area within the region. An area office receives all calls from customers within the area reporting faults. The fault is diagnosed either electronically from within the office, or by sending an engineer to the customer's premises. Once diagnosed the fault is logged with the field staff within the office, and repaired in rotation. Each area office must cope with its own peaks and troughs in demand. This means that the incoming telephone lines may be engaged when a customer first calls, and it can take up to two days to diagnose the fault. |
To improve customer services the company plans to rationalise the CRMO organization within the region, with three objectives: |
– never have engaged call receipt lines within office hours |
– achieve an average time of two hours from call receipt to arrival of the engineer at the customer's premises |
– create a more flexible structure able to cope with future growth both in the region and throughout Europe, and the move to "Enquiry Desks," dealing with all customer contacts. |
|
3. Business portfolio: changes to the product, price, and place of same, technology, quality
4. Higher order strategic issues: changes to technology, culture, or overall business strategy

FIGURE 2.2 Achieving performance improvement.
Figure 2.2 illustrates that the time it takes to achieve performance improvement takes longer the further you move down this list, but so too the levels of performance improvement are commensurately greater. So you can achieve "quick and nasty" levels of improvement with operational efficiency, but not very great levels, whereas you can achieve much greater levels of improvement by changing your technology, culture, or strategy, but it will take longer. That means whichever you choose will depend on the levels of performance improvement required, and how long you have got. If you are best in the world and want to maintain that position, or are second best and want to become best, you will probably start by changing your strategy first. If on the other hand you are going to go bankrupt tomorrow if you don't do something quick, you will look to make quick and nasty improvements in operational efficiency.
Diagnostic Tools
There are a number of diagnostic tools that can help identify where the problems preventing performance improvement lie, or what changes can help achieve performance improvement.
Diagnostic Questionnaire. The first type of tool is a diagnostic questionnaire. In effect the maturity models1,2 mentioned previously are diagnostic questionnaires. Or you may have or develop your own questionnaires. Table 2.2 is a questionnaire3 I have used with client organizations to help them pinpoint where their problems lie. I applied this with the insurance company in Example 2.1. The results are given in Example 2.3.
Example 2.3 The cause of falling performance
I applied Table 2.1 with the insurance company in Example 2.1. When we scored them for managerial and financial factors, they scored average plus to good. There were a couple areas of weakness but overall they were good. It indicated that perhaps there was a possibility for some improvement but it was not the cause of their problems. But when we applied the competitive and technical factors a different picture emerged. They were scoring poorly against many of them. They were selling their products through agents, based in shops in the town centre whose average age was over 60. Many low-cost players were entering the market and selling their products over the Internet. Some products such as house insurance and car insurance can be sold easily that way. For others, such as life insurance and health insurance, local laws (PESTLE) make that more difficult. Some low-cost entrants were also selling house insurance with premiums one-third those of my client. Their products were more comprehensive, but it was difficult to make people buying over the Internet aware of this. The company recognized they needed to change their distribution channels for some products and improve the effectiveness of their agent network.
Boston Consulting Matrix. The Boston consulting matrix (Fig. 2.3) can help pinpoint where a company's products are in the product life cycle. (We return to the product life cycle in Chap. 11.) The Boston matrix views products in terms of their market competitiveness and growth, and identifies products at four stages of development: cash cows, rising stars, dogs, and problem children. Cash cows are generating large profits but absorbing little cash for further growth and so are cash positive. On the other hand, problem children, newly introduced products, are not generating significant profits yet but are absorbing money to fund their growth. Cash from the cash cows needs to be used to fund the development of new products to maintain the company's portfolio. All cash cows will eventually become dogs, which are cash neutral, not generating profits but not absorbing any money to fund their
TABLE 2.2 Diagnostic Questionnaire for Organizational Capability
| ||||||
Capability factors | Poor | Weak | Avg− | Avg+ | Good | Excl |
| ||||||
Managerial factors | ||||||
1. Corporate image, social responsibility 2. Use of strategic plans 3. Environmental assessment 4. Speed of response 5. Flexibility of organization 6. Communication and control 7. Entrepreneurial orientation 8. Ability to attract and retain good people 9. Response to changing technology 10. Aggressiveness in meeting competition | ||||||
Competitive factors | ||||||
1. Product strength, uniqueness 2. Customer loyalty, satisfaction 3. Market share 4. Selling and distribution costs 5. Use of experience curve in pricing 6. Use of product replacement life cycle 7. Investment in new products 8. Barriers to entry 9. Takes of market growth potential 10. Supplier strength | ||||||
Financial factors | ||||||
1. Availability of capital 2. Capacity utilization 3. Ease of exit from market 4. Profitability, return on investment 5. Liquidity 6. Leverage, financial stability 7. Capital investment, to meet demand 8. Stability of costs 9. Ability to sustain effort 10. Elasticity of demand | ||||||
Technical factors | ||||||
1. Technical skills 2. Resource and people utilization 3. Level of technology in products 4. Strengths of patents and processes 5. Production effectiveness 6. Value added to product 7. Intensity of labour to make product 8. Economies of scale 9. Newness of plant and equipment 10. Level of coordination and integration | ||||||
| ||||||
growth. If problem children and cash rising stars are not being nurtured there will be no new cash cows to replace the old ones as they wane. If a product is losing performance it may be because it is on the wane. The insurance company in Example 2.3 is finding several of its products turning to dogs, especially home and car insurance. With dogs, you can decide either to shed that product, or to relaunch it and turn it back into a problem child.

FIGURE 2.3 Boston consulting matrix.
Ansoff's Matrix. Ansoff's4 matrix (Fig. 2.4) is a tool that has stood the test of time. An organization that is looking to expand its business can move toward introducing new products or entering new markets. That gives four growth strategies: growth, development, penetration, and diversification. Growth is low-risk but low-potential performance improvement. Diversification is high-risk but high-potential performance improvement.
Porter's Five Forces. Porter's five forces model is also a tool that has stood the test of time. It suggests that an organization operating in an industry faces pressures from five sources:
1. Competitors within the industry
2. Suppliers
3. Buyers
4. New entrants to the industry
5. Substitute products

FIGURE 2.4 Ansoff's matrix.
Substitute products are not new, similar products that are competitors within the industry. They are entirely different products that entice people away from your product, offering an alternative benefit. For instance, video games are a substitute for television, which is a substitute for the cinema. The insurance company in Example 2.3 was suffering pressures from buyers finding new channels in which to buy, and seeking cheaper products, and from new entrants to the market. The Internet had lowered barriers to entry enabling new companies to enter the market to offer competitive products.
People, Systems, and Organization Projects
Figure 2.2 suggests improvements can come from changes in operational efficiency, often achieved by making technical changes, or by organizational effectiveness, achieved by making organizational changes, introducing new management processes, developing people with new competencies and values, or even changing the organization structure. In reality, on most projects you will need to combine both technical and organizational changes. This leads to the concept of people, systems, and organization (PSO) projects, projects that involve a mixture of technical and organization changes, the latter requiring changes to PSO. Often, however, the technical changes are easy and well understood, and people focus on those. In Chap. 5, I introduce a planning process that forces one to address the organizational changes as well, to make sure that not only do you introduce the new technology to make the operational improvements, but that you also introduce the new management processes, that you train and educate the people, and that you make any structural changes to achieve the organizational improvements. Through this technique you can also ensure that you make necessary changes to the business portfolio, markets, technology, culture, and strategy.
During the 1980s and 1990s, there was something of an evolution in people's focus in addressing the need for the organizational changes. In the mid 1980s, people viewed their projects only in terms of the technical changes. They focused on managing the technology, and assumed that the changes to PSO would happen automatically, or worse, weren't required at all. Then, in the late 1980s people began to recognize that the organizational changes were necessary. You have to introduce new management processes to operate the new technology, people need new competencies to operate the new technology and the new management processes, and sometimes you need new organizational structures. However, they behaved as if the technology was the main focus of the project, and the organizational changes would just piggyback on those. By the early 1990s, people realized that often the organizational changes are in fact the drag on the rate at which you can introduce change. Sometimes you need to introduce the change in two steps (tack like the yacht in Sec. 1.4). But you can't introduce all the technical changes and only some of the organizational changes. You have to make technical changes which support the organizational changes. So if you make the organizational changes in two steps you probably also need to make the technical changes in two steps (see Example 2.4). By the late 1990s the pendulum had swung completely the other way. As a result of Business Process Engineering, people now behaved as if the organizational, strategic, and cultural changes were the main focus of the project and the technical changes were merely something that facilitated that. The pendulum has now swung back to the middle; but the risk is it goes too far and people start focusing on just the technical changes again.
Example 2.4 Introducing Internet-based ways of working
Often when replacing manual systems with Internet-based ones, the ideal, Internet-based, user interfaces are completely different than the old manual-based, legacy systems. However, people can be resistant to adopting both Internet-based data entry and new interfaces simultaneously. They want to continue entering data into forms with which they are familiar, while they adjust to using the Internet or Intranet as the medium. Thus the transition should be made in two steps, first making the online user interface look like the old manual forms allowing users to become familiar with Internet-based data entry, and then introducing the new user interface later.
Case Study
After applying the diagnostic in Table 2.1, TriMagi determines that they can use new technology to change the organizational structure of their CRMOs (Table 2.3). It is not that their old technology and structure were wrong; it is just that new technology now exists that makes a different structure better able to meet their quality targets.
TABLE 2.3 Proposed Changes at the TriMagi CRMOs
|
TriMagi |
|
The proposed improvement can be achieved by changing the CRMO structure using new technology recently developed by the R&D department. In the new structure there will be three call receipt offices, two diagnostic offices, and four field offices servicing the entire region. It would be possible to have just one office for each of call receipt and diagnosis, but that would make the service exposed to technical failure. Incoming calls would be switched to a free line in any call receipt offices. It will be logged automatically, and passed on to a diagnostic office. The diagnostic office will try to diagnose the fault electronically, which should be possible in 90% of cases. The diagnostic offices are also able to discover faults before the customer notices them. The diagnostic offices will pass the faults to the field offices to repair the faults, and diagnose the remaining 10%. The field offices will be nominally assigned to an area within the region, but will share cases to balance their workload. With time the call receipt and diagnostic offices can be off-shored to achieve further savings. |
|
In the old days of project management, 50 years ago when projects mainly came from engineering and construction, when the new asset was switched on it immediately gave the desired performance improvement. For instance, if the project is to build a new electricity-generating station, the desired performance improvement was more electricity to meet industrial and domestic demands, and as soon as the new station is switched on you have that. However, with modern change projects, especially PSO projects, including the delivery of new computer systems, how the asset will be used to deliver the performance improvement is not always quite so simple. Some additional steps are required to bridge the gap between commissioning the new facility to achieving the desired performance improvement. For instance, it may be necessary to:
![]() Allow time for people to gain experience to convert new skills into competencies
Allow time for people to gain experience to convert new skills into competencies
![]() Bed down new management systems and processes to gain experience in their use
Bed down new management systems and processes to gain experience in their use
![]() Wait for customers to become aware of a new service and so start to use it more frequently
Wait for customers to become aware of a new service and so start to use it more frequently
![]() Give customers time to gain experience with the new service and so use it more effectively
Give customers time to gain experience with the new service and so use it more effectively
It is important to understand how the new facility will deliver the desired performance improvement for at least two reasons:
1. It will influence the design of the new facility. A standard computer system may be used in many ways, and so its design has to be tailored to meet the exact requirements (Example 2.5).
2. After the system is implemented, the users need to know how they should use it to achieve the desired performance improvement. Further, because it takes sometime for the benefits to work through, they need to be tracked. It can take several months for full benefits to be realized, and it is the responsibility of the users to monitor that the new facility is being used to deliver the desired benefits (Example 2.6).
Example 2.5 Designing the system for the desired performance improvement
A client of mine was implementing SAP. The strategic objective set by the parent company was that my client should aim to maximise annual profits, so the system and associated management systems were designed to achieve that. Before the system was implemented they were bought by another company. The strategic objective set by the new parent company was that they should maximise annual cash flow. This required the SAP system and associated management systems to be redesigned.
To meet these twin requirements it is suggested that you draw a benefits map (Fig. 2.5), to show how the new system will be used to deliver the desired performance improvement, and to track achievement of the performance improvement post project. The right-hand side of Fig. 2.5 shows that there are several problems stopping the organization achieving the desired performance improvement. The left-hand side shows that the new asset delivers several new capabilities to the organization. But they do not themselves immediately solve the problems to deliver the desired performance improvement. Several steps are required. After the project, each of these steps may take several months to achieve, and so the users,

FIGURE 2.5 A benefits map.
as part of the control process, need to track that each of these steps is being achieved, and that with time the desired performance improvement is achieved.
Example 2.6 Monitoring achievement of the benefits
Another client was implementing a Customer Requirements Management System (CRMS). They wanted to improve return on sales, and to do this they felt that they needed to better understand their customers' buying habits, better segment the market, and better communicate with customers. The marketing department decided a CRMS was the solution, and commissioned the information systems department (ISD) to deliver one. At that point, all communication between marketing and ISD ceased. So ISD delivered a system in accordance with best practice. A year after the system was commissioned there had been no improvement. "Yet again ISD have failed," said marketing. No! marketing are not using the system to achieve the desired performance improvement. They are not sure that the system has actually been designed to do what they want (Example 2.5). But even if it has, they are not tracking the benefits realization. It is marketing's responsibility to use the system to achieve the benefit, not ISD's.
Figure 2.5 shows four governance roles associated with the project: the sponsor, the steward, the project manager, and the owner or business change manager.
The sponsor: He or she is somebody from the business who identifies the need for performance improvement and the possible change that will deliver it. He or she does the initial project definition and draws the draft of the benefits map. He or she also wins resources for the project. But the sponsor is not a technical expert and so needs support from the steward.
The steward: He or she is a senior technical manager who advises the sponsor about what the technology can do. The sponsor and the steward conduct the feasibility study and finalize the project definition and the benefits map.
The project manager: He or she defines the project process to deliver the change, and is responsible for managing its delivery. But it is not the project manager's responsibility to embed the change and ensure it is used to actually achieve the performance improvement.
The owner: He or she owns and operates the new asset to achieve the performance improvement and receive the benefit. Either he or she, or a subordinate, sometimes called the business change manager, is responsible for embedding the change and ensures that it is actually used and works to deliver the desired performance improvement. This is done by tracking progress through the benefits map.
I return to these roles again in Chap. 15, where they are fully described.
Case Study
Figure 2.6 shows the benefits map for the case study project.
2.4 PROJECTS FOR IMPLEMENTING
CORPORATE STRATEGY
I spoke above as if the user department acts fairly independently to identify the project opportunity. However, it is important that the project should be aligned with the company's strategic objectives. Example 2.7 describes what can happen when it is not. In reality, the user department will be operating within the corporate planning process, and most identified

FIGURE 2.6 Benefits map for the case study project.
project opportunities will almost automatically fall under the company's strategic objectives. Sometimes the project will be a direct result of the corporate planning process. A new business opportunity will be identified; the performance improvement will come from exploiting that opportunity. Other times, the link will be a step removed. The department will not be achieving its strategic objectives as well as it would like, and the desired performance improvement will be to raise its game to meet its objectives. In both those cases, the project will be aligned with the corporate planning process. Sometimes a department may identify a project that is not immediately linked to the corporate objectives (like Example 2.7). My view is that either the department should change the corporate objectives or drop the project. Example 2.7 is a case where they did not change corporate objectives and that was the right outcome. Example 2.8 is a case where the company did not change the strategic objectives and that was the wrong outcome. Example 2.9 is a case where the company did, and that was the right outcome. In this section, I give a brief overview of the business planning process and indicate how the project should be aligned with it.
Example 2.7 A project not aligned with corporate strategy
I worked with a company in the computer industry running a series of project launch workshops in the research and development department. One project was to develop an accountancy package, which a salesman had suggested as a result of several client requests. However, this was at a time when the senior management of the company was trying to focus on software more orientated towards the requirements of managers (such as estates management and manufacturing planning), rather than functionally orientated packages. When we came to assign resources, the only person available was the project manager, and the project quickly died.
Example 2.8 The graphical user interface
The man who invented the graphical user interface for computers worked for a company not directly involved in the computer industry. "Not part of our strategic objectives," they said. So he left to join Apple.
Similarly, the company first offered the opportunity to fund the development of the telephone turned it down. They are reputed to have said that there would be a need for at most one of those in every town.
Example 2.9 The glue that wouldn't stick
There is the story of the man, who worked for the multinational company, 3M, who invented that glue that would not stick. Innovation is so important to 3M they allow people who work in their research department a day a week to work on their own projects. However, the story goes that the company tried to stop that research project because selling glue that did not stick was not part of their development objectives. Undeterred the man pressed on, and found a use for the glue. He sang in his local church choir and wanted to mark the hymns in his hymnal. Bits of paper often fell out, but if he pasted them with his glue, he could securely mark his place, and remove them at the end of the service. He went back to his organization and said he had found a use for his glue. His organization said that not many people sang in choirs. Undeterred the man made some sample pads of paper pasted with the glue (in blocks of yellow paper), and gave it to the secretaries to try out. Soon, bits of yellow paper were everywhere. The organization decided that perhaps there was a market for this product after all, and the rest, as they say, is history.
The Business Planning Process
There are four essential steps in the business planning process (Fig. 2.7).
1. Define the mission of the business.
2. Set long-term objectives for achieving the mission.
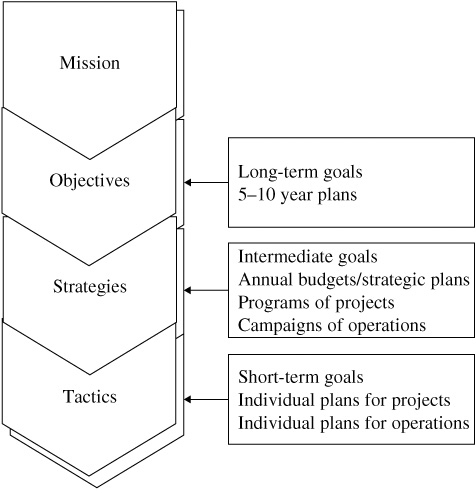
FIGURE 2.7 The business planning process.
3. Develop strategies for achieving the objectives.
4. Develop tactical plans for achieving each element of strategy.
Define the Mission of the Business. The mission is the axiom which initiates the business planning process. It is a statement of the reason for the organization's existence; it's purpose for being in business. It may be a statement as simple as to make profit for the shareholders. However, it is more common to include statements on:
– The type
of products
– The positioning of the products in the marketplace
– The relationship with the employees
– Other hygiene factors
– Relationships with other stakeholders, especially local communities
A mission statement for TriMagi is given in Table 2.4.
Set Long-Term Objectives for Achieving the Mission. Having defined the mission, the company sets objectives for the next 5 to 10 years to deliver it. These are statements of the position the organization will reach in the relevant timescale covering:
– The types and ranges of products, and turnover from each
– Return on sales and assets, and growth of dividends
– Type, number, skills, and remuneration of employees
– Environmental impact
– Social and community activities
A set of objectives for TriMagi is given in Table 2.5. The CRMO supports these objectives.
Develop Strategies for Achieving the Objectives. Having set objectives, the organization can then develop strategic plans for achieving the objectives. These can take several forms.
Annual budgets: These show, year by year, how the business will develop towards the position envisaged in the objectives. Budgets for the current and immediately following year are the plans to which the business is presently working. Budgets for future years become increasingly more speculative, and will be revised annually. For example, each
TABLE 2.4 A Mission Statement for TriMagi
|
TriMagi |
|
TriMagi Communications is in business to supply visual, voice, and data communication networks based on its leading edge in glass fibre and laser technology. It will supply two-way cable television services to domestic and educational customers, data communication networks to these and commercial, customers and telecommunication services through its cable and data networks. It will be the first choice provider in the European countries within which it operates. The company will provide secure, competitive employment for its staff. All its services will be provided in a way which has no impact on the environment. Above all, TriMagi Communications will supply its shareholders with a secure investment which increases in value annually. |
|
TABLE 2.5 A Corporate Objective Statement for TriMagi
| |
TriMagi | |
| |
From its current domination of the market in the Benelux countries, TriMagi Communications will establish operating subsidiaries in the following regions: | |
Year 1: | France |
Year 3: | Germany and British Isles |
Year 5: | Iberian Peninsula, Italy, Austria, and Switzerland |
Year 7: | Scandinavia and Baltic States |
Each new subsidiary will break even within two years, with a turnover of at least 100 million Euro, and from there will achieve a growth of 50% per annum for the next three years. By the fifth year, it will have achieved a return on assets of 20%, and will contribute 10% of turnover to the parent company to fund further product development. | |
Each subsidiary will employ operating personnel, and sufficient technical staff to install and maintain the networks. They may maintain a small marketing effort to develop local opportunities for using the network. These local opportunities will contribute at least 15% of turnover. | |
The parent company will employ technical staff to maintain the company's leading technical edge, and to develop new products and opportunities for using the networks. New products and opportunities will enable established subsidiaries to maintain a growth of at least 20% over and above that available from increased market, or increased market share, beyond their initial five years. | |
The objectives which TriMagi has set indicate that it will maintain its existing operation, in the Benelux countries. It will fund further growth by using the income from those operations to expand into new markets, then achieving further growth as each new market becomes established. Initially, it will sell existing products into the new markets, but, as they become established, develop new products for them. It will also try to use those new products in its old markets, where possible, to achieve further growth. The objectives also imply that the operation in the Benelux countries will split into an operating company, and a parent company undertaking new product development. | |
| |
of TriMagi's subsidiaries would have annual budgets for capital expenditure, income, and revenue costs.
Subsidiary goals and milestones against each objective: The annual budgets show where the business is expected at each year end against the objectives. These can be summarized into a plan against each objective, showing intermediate milestones for achieving each one. These are sometimes called the goals of the business, and may be drawn as one or more milestone plans for the development of the objectives (Chap. 5).
Campaigns or programs for functions, operations, or projects: The annual budgets are set, or are based on, campaigns or programs for individual departments or functions within the organization. These may be campaigns for continuing operations, or programs for new projects. The business planning process is iterative, and so these programs are developed in parallel with the annual budgets, through negotiation and compromise. However, all but the first of the programs below tend to be set within constraints of the annual budgets. The first sets the basis from which the budgets and goals are derived. There are several types of campaign or program including:
1. Programs of corporate planning or marketing: They describe the evolution of technologies, products, or markets of the business (the upper elements in Fig. 2.2). The term strategies is sometimes reserved for the corporate planning program, because that sets the basis for deriving the goals and annual budgets. The marketing campaign is shorter term, and deals more with the balance between products, pricing, distribution channels, and promotional campaigns to achieve annual budgets.
2. Campaigns for existing operations: These are undertaken when a business decides to maintain its existing products, markets, or cash cows. This may be for production, sales, or services.
3. Programs for new projects: These are undertaken when the analysis suggests the business should adopt new products, markets, or technologies, or undertake some other improvement to its existing operations. The projects will deliver new facilities, in the form of product designs, factories, or technologies to produce them, computer systems to manage their production, or new organization structures with trained staff and managers to undertake the production.
The last paragraph of Table 2.5 indicates how TriMagi plans to achieve its objectives.
Develop Tactical Plans for Achieving Each Element of Strategy. Plans for individual campaigns or programs, or for functions, operations, or projects are the tactical level plans. They describe how the organization will achieve each element of its strategic plans. These tactical plans may be marketing plans, production plans, or milestone plans for projects.
The Role of Projects and Operations
I have just shown how the business planning process can identify a need for routine operations and projects. These are the vehicles through which organizations achieve competitive advantage. Either they do more of the same, though always striving to improve efficiency through habitual increment improvement; or they do new things with novel organizations, that is, projects. Until the 1980s, the former dominated. However, with the development of more sophisticated corporate planning techniques, and with the explosion of technical innovation and communication, the second is beginning to dominate. Thus management by projects is becoming the way in which organizations fulfil their business plans. Just like the business as a whole, each operation and project has three levels of planning (Fig. 2.8): the integrative level, the strategic level, and the tactical level. There may be lower, more detailed levels of planning. For particularly large projects, there can be up to seven levels of work breakdown, and we shall return to this concept in Chap. 5.
The integrative level defines the purpose of the campaign or program, as defined by the corporate objectives, and the objectives it must achieve in order to satisfy the annual budgets:
1. For sales and marketing: This will be objectives for turnover expected from each product, budgets for distribution, and promotion and overheads for the sales department.
2. For operations: This will be production targets and budgets for cost of sales.
3. For projects: This will be a definition and specification of what the project is to produce and constraints of time and cost.
The strategic level defines subsidiary objectives each function must achieve to satisfy its overall objectives.

FIGURE 2.8 The projects and operations hierarchy—product breakdown.
1. For sales and marketing: This may be individual campaigns for selected products, product launches, advertising campaigns, or testing of new outlets, each of which may result in a project.
2. For operations: This will be targets for each product, or for efficiency improvements.
3. For projects: This will be a milestone plan or work package plan for the project.
The tactical level defines the detail of how the work to achieve each of the subsidiary objectives is to be achieved.
Selecting Projects
The business planning process may identify several possible projects. Usually, there will be insufficient resources, money, people, and materials to fund them all, and so the organization must assign priorities to select projects which are most beneficial. I will discuss the project prioritization process further in Chap. 16, when I describe portfolio management. There are several quantitative and qualitative techniques for appraising the value of projects, and making this selection. It is not my intention to give a detailed description of them here; that is more appropriate for a book on project appraisal and finance.
What I would like to reinforce is the appraisal processes is repeated at several stages of the project life cycle, using increasingly accurate data. In Sec. 1.2, I suggested that at the end of the concept stage the accuracy of the estimates may be ±50 percent, giving a wide range for the estimate of the potential value of the project (benefit divided by cost), or inversely potential payback (cost divided by benefit). (These are very crude methods of investment appraisal, but as I say I don't intend to go into more sophisticated methods.) However, based on the appraisal at the concept stage a small amount of resource is committed to the feasibility study. At the end of feasibility the appraisal process is repeated, but now the accuracy of the estimates of cost and benefit are typically ±20 percent, giving a narrow range for the estimates of value. If the project still looks worth, a larger amount of resources is committed to design. At the end of design, the estimates are typically accurate to ±10 percent, giving an acceptable range for the estimate of the value that the organization can commit to undertaking the project. For an organization with a large number of project proposals, at this stage, the project may be included in the project portfolio assessment (Chap. 16). So not only is it assessed in its own right, but also in comparison to other project proposals in the portfolio. The best projects are chosen for implementation (whatever "best" means as I will discuss in Chap. 16). These review points are variously called stage-gates, toll-gates, or gateway reviews. These are go, no-go, or go-back decision points. Based on the assessment you either:
1. Go forward to the next stage
2. Cancel the project
3. Repeat the previous stage
1. The performance gap can help identify the need for performance improvement.
2. A shortfall in performance can be caused by internal or external pressures, and can be identified by using benchmarking and diagnostic techniques.
3. In order to achieve the desired performance improvement, the organization will introduce a change, delivering a new facility or asset which will give it new capabilities, and those will enable it to solve the problems or exploit the opportunities which will lead to the performance improvement.
4. Many diagnostic techniques exist to help the organization to identify the change that will enable it to achieve the performance improvement
5. Usually the new capabilities will not solve the problems blocking performance improvement directly. It is necessary to achieve several intermediate benefits before realizing the main benefit. The benefits map shows the link between the new capabilities and the desired performance improvement via the intermediate benefits.
6. The benefits map may be used to change the definition of the desired asset, and the definition of the desired performance improvement. It should also be used to ensure realization of the benefit after the project.
7. There are four governance roles associated with the management of the project and realization of the benefit: the sponsor, steward, project manager, and owner.
8. The project should be linked to the corporate planning process to ensure it will help the organization achieve its long-term goals.
9. The project needs to be appraised repeatedly throughout the life cycle to ensure it will deliver value to the organization.
1. Software Engineering Institute, CMMI® for Development, Version 1.2, Pittsburg, Pa.: Carnegie Mellon University, 2006.
2. Project Management Institute, Organizational Project Management Maturity Model, Newtown Square, Pa.: PMI, 2003.
3. Rowe, A.J., Dickel, K.E., Mason, R.O., and Snyder, N.H., Strategic Management: A Methodological Approach, 3rd ed., Reading, MA: Addison-Wesley, 1989.
4. Ansoff, H.I., "Strategies for diversification," in Harvard Business Review, May, 113–124, 1957.