
CHAPTER 16
PROGRAM AND PORTFOLIO
MANAGEMENT
Up to now I have spoken very much about the project in isolation. However, the reality is that the vast majority of projects take place as one of a group of projects, either a program or a portfolio of projects. The traditional project management assumption is of the large, isolated project with a dedicated team in which:
![]() They deliver well-defined, independent objectives, which provide the full benefit on their own.
They deliver well-defined, independent objectives, which provide the full benefit on their own.
![]() They are relatively independent of other projects and operations with few minor interfaces.
They are relatively independent of other projects and operations with few minor interfaces.
![]() They have a dedicated team, wholly within the control of the project manager; the manager may desire a larger team, but he or she sets the priorities for the team's work day-by-day.
They have a dedicated team, wholly within the control of the project manager; the manager may desire a larger team, but he or she sets the priorities for the team's work day-by-day.
In the construction of a building, a fence is put around the construction site. The project will not be dependent on other projects, the only interface with the outside world being the connection of services across the boundary. People working on the construction site will be managed by the project manager, wholly within his or her control.
All the early books on project management were written about this type of project but in my view it represents less than 10 percent of all project activity. The majority of projects take place as part of a program or portfolio of small- to medium-sized projects (SMPs), in which:
![]() They deliver mutually interdependent objectives where the full benefit is obtained only when several projects have been completed (Examples 1.3 and 16.1).
They deliver mutually interdependent objectives where the full benefit is obtained only when several projects have been completed (Examples 1.3 and 16.1).
![]() They are dependent on other projects or operations for elements essential to their completion, such as data, new technologies, or raw materials.
They are dependent on other projects or operations for elements essential to their completion, such as data, new technologies, or raw materials.
![]() They borrow resources from a central pool and the resources remain within the control of the resource managers; the manager must negotiate release of the resources to the project and may loose them at little or no notice as the organization's overall priorities change.
They borrow resources from a central pool and the resources remain within the control of the resource managers; the manager must negotiate release of the resources to the project and may loose them at little or no notice as the organization's overall priorities change.
Example 16.1 Related projects
A borough council I worked with was building a new shopping centre, sports complex, and car park together with new road access and new services. This was broken into five projects, which now could not be totally ring fenced. The road had a separate interface with the car park, the shopping centre, and the sports complex and those were linked to the services. Furthermore, the full benefit would not be obtained from the shopping centre and the sports complex until the link road and car park were completed. The sports centre and shopping complex would also be used by the same people so would generate benefit for each other.
I have used the terms small- to medium-sized, large, and major projects. It is common to categorise projects in this way. However, there is little agreement about what these mean and there is a wide difference between industries. What constitutes a large information systems project may be considered small in the construction industry. I saw an advertisement for a course which claimed to be about managing "mega" projects and went on to classify that as projects over $2 million!!! In the process plant industry that is miniscule. For a given organization, I define a large project as one which costs around 10 percent of company's turnover, a medium-sized one is one-tenth of that, and a small one is one-tenth of that. A large project usually justifies a dedicated team; small- to medium-sized projects share resources with other projects. A major project is 10 times bigger than a large project and the risk is such that no one organization can undertake the project on its own.
In this chapter I describe the management of projects as part of a group of projects. There are two types of project grouping, those that share common resources called a portfolio and those which contribute to a common or shared objective called a program. In the next section I define these more carefully and discuss their governance role. In managing a portfolio of projects, which share common resources, there are three issues: prioritizing projects to receive resources, sharing resources between those projects you have decided to do, and managing interfaces between the projects. In managing a program of projects which contribute to a common objective, the two issues are deciding which projects to do, and linking the program and project governance structures. Finally in this chapter, I describe different types of project office and their different roles.
This is an area that has changed considerably since I wrote the first edition of this book. As little as 10 years ago, people did not distinguish between programs and portfolios.
I try to keep the definitions simple. Some people seem to engage in quite tortuous definitions. I don't think that is necessary. Simple definitions capture the key feature of what we are discussing.
Programs
A program of projects is a group of projects which contribute to a common, higher order objective. The parent organization has a change objective which may require contributions from several different areas, or several different types of project for its achievement. For instance in Example 1.3 to develop a palm nut oil industry, the Malaysian government needs to develop new plantations, transport infrastructure, factories, and sales outlets. In Example 16.1, the borough council is developing a shopping and leisure facility with shops, sports facilities, car parking, and road access.
Somewhat against the trend, I personally think there is little difference between program and project management. Yes there is a big difference between managing a $50,000 project and a $50 million program, but not any greater difference in my view than between managing a $50,000 project and a $50 million project. The problem is the word "project" is used to describe a wide range of endeavours, from $50,000 to $5 billion. I coined the word "projette" to describe anything under about half a million dollars. So when people say project management and program management are different they are comparing the $50 million program with the $50,000 project because that is the context they are talking about. They are not comparing the $50 million program with the $50 million project.
However, there are some subtle differences between projects and programs. The main one is with the nature of the objectives. Projects tend to have what are labelled SMART objectives: specific, measurable, achievable, realistic, and timelined. The most famous example is when in 1963 President Kennedy set the target of sending a man to the moon and bringing him back safely by the end of the decade. It was specific, measurable, and timelined (respectively). Whether in 1963 it was realistic and achievable is a bit open to question, though it turned out to be both of those things (as long as you don't believe the conspiracy theorists). The objectives of a program tend to be just smARt; they are less specific and so as a consequence less strongly measurable and timelined. For instance the palm nut oil industry is less specific than a palm nut plantation. It is not so specific at the start about how many plantations, factories, roads, and the like. In fact, as we shall see, you may start out with a target, but change your view as the program progresses and you get feedback on what you are achieving. With the actual shopping and sporting complex I describe in Example 16.1, there was only limited space in which to build it and so the objectives were quite specific, measurable, and timelined. But with a larger shopping, sporting, and leisure complex, it may be more like the palm nut plantation with the exact scope of the program less well defined at the start. In discussing program management, I will describe how to deal with situations where the objectives are just smARt.
Also with a program, the governance structure of the individual projects needs to be nested within the governance structure of the program.
Portfolios
A portfolio of projects is a group of projects which share common resources. (The program has common outputs; the portfolio has common inputs.) The resources may be money or people, but can also be data or technology. Thus with a portfolio there are several management issues:
1. You need to prioritize projects within the pool of resources you have. You only have a limited number of resources, and so only can do a limited number of projects.
2. Having chosen which project you want to do, you need to share the resources between them. The average number of resources should be in balance, but you may find that resources demands for different projects peak together and there may be unexpected events which also cause resource clashes.
3. Where projects are sharing data and technology, the projects become coupled, especially where one project is producing something another needs to use to make progress. The project plans need to be linked to manage that interface. Project interfaces are also risks which need to be managed as such.
Sometimes the projects in a portfolio may be totally independent other than they are sharing resources. Sometimes they may be contributing to a common outcome. The projects in Example16.1 are also sharing resources and so also constitute a portfolio, whereas the projects in the palm nut oil industry are all quite independent of each other. The plantations may be at opposite ends of the country and are well away from the factories. The U.K.'s Office of Government Commerce, in their standard Managing Successful Programs,1 do refer to the projects comprising a program as a portfolio of projects, but the assumption is that they are more like Example 16.1, the palm nut plantation.
The word portfolio was borrowed from the finance industry, where people have a portfolio of investments, and indeed the projects an organization is doing is part of its portfolio of investments. The consequence is that in the project management field the word portfolio can be used in two ways. It can refer to a collection of projects sharing common resources, or it can refer to the sum total of an organization's investments, including all the projects and programs it is doing. I use the term investment portfolio for the latter.
Sometimes, especially for smaller organizations, the firm's investment portfolio will consist of just one portfolio of projects. Sometimes it will consist of several programs, several large projects and several portfolios of miscellaneous small- to medium-sized projects. Certainly where an organization is doing several small, medium, and large projects, it needs to create separate portfolios for the small- and medium-sized projects. As we shall see in the next section, the small- and medium-sized projects cannot compete alongside the large projects for resources; they get lost in the noise. The small- and medium-sized projects each have to be treated as separate portfolios. When prioritizing resources at the organizational level, you need to prioritize resources between the large projects and programs, and the portfolios of small- and medium-sized projects and programs. Then you need to prioritize the small- and medium-sized projects and programs within those portfolios.
In Sec. 2.2, I suggested an organization needs to achieve a balance of products within its product portfolio, and introduced the Boston consulting grid (Fig. 2.3) as one way of illustrating that. Likewise an organization needs to balance the projects within its investment portfolio. It needs projects for:
![]() Innovation, including developing new products, services, or production processes
Innovation, including developing new products, services, or production processes
![]() Operational improvements
Operational improvements
![]() Marketing, including launching new products or opening new market segments
Marketing, including launching new products or opening new market segments
![]() Strategic realignment
Strategic realignment
Within the last category there can be:
![]() Mandatory projects such as responding to new legislation
Mandatory projects such as responding to new legislation
![]() Repositioning projects to reposition the organization up the performance curve (Fig. 2.2)
Repositioning projects to reposition the organization up the performance curve (Fig. 2.2)
![]() Renewal projects to renew products or facilities
Renewal projects to renew products or facilities
Governance
In the last chapter, I said there are three levels of governance in the project-based organization:
1. At the level of the board
2. Within the context of the organization linking the board to individual projects
3. At the level of the individual project
Programs and portfolios are part of the middle level. Both help define the objectives of projects, and ensure the right projects are done to achieve the organization's desired development objectives. Programs do this by identifying the higher order development objectives required and then define the program of projects required to deliver individual components of that. Portfolio management does it by deciding which projects best deliver the organization's development objectives and assigning resources to them. Both
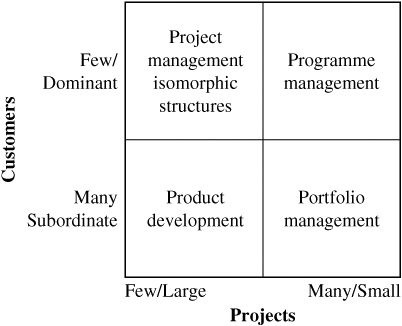
FIGURE 16.1 Four governance structures.
help define the method of achieving the objectives. Programs do that by identifying individual projects to deliver components of the objectives. Portfolios do that by sharing resources between projects and managing interfaces. Both also provide a means of monitoring progress.
Anne Keegan and I identified four different governance structures depending on the size of an organizations projects and customers2 (Fig. 16.1). In this figure, the size of projects and customers is relative. A project is large if it represents around 10 percent of a company's turnover or more. It is small if it is around 1 percent or less. If projects are large, there are necessarily few of them to make up the company's turnover, and if they are small there are necessarily many of them. Likewise, a customer is large if it represents around 10 percent of turnover or more, and small if it is around 1 percent or less. Again if customers are large there are necessarily few of them. But they are also dominant; losing one such customer can have a huge impact on the company's turnover. If the customers are small, there are necessarily many of them, and losing one is less significant. This matrix defines four governance structures:
1. Large projects for large customers: These are traditional projects, which most of the early books are written for. The governance and organization structure of these projects tends to change as you move through the project life cycle, as illustrated in Table 6.5.
2. Small projects for large customers: This is program management. Concept and feasibility are done at the program level, so the project manager just applies the management cycle: plan and design, organize, implement, control progress, and link up. The projects themselves are homogeneous, with the team composition and size not changing during the project. Governance on the project is nested within that for the program. The program manager and sponsor interface with the customer, and the project manager responds to them.
3. Small projects for small customers: This is portfolio management. Again the projects tend to be fairly homogeneous, because they are small. The project life cycle and management life cycle tend to merge, and the project team is fairly homogeneous throughout its life.
4. Large projects for small customers: This tends to be product development, where you are developing a single product to be used by several customers. You develop portfolios of customers, that is, segment the market to understand their different requirements.
I suggest a five-step process for portfolio management:
1. Maintain a list of all current projects in a project database.
2. Report the status of all projects through a central project-reporting system.
3. Prioritize and select projects through a transparent system maintained centrally.
4. Plan and assign resources on all projects centrally.
5. Evaluate the business benefits of all projects postcompletion.
In the investment portfolio; the data should be maintained centrally and the decisions taken at board level. Within a miscellaneous portfolio, centrally means within that portfolio with decisions taken by the manager and sponsor of that portfolio. When I use the word "project" in this section, it can also mean program or miscellaneous portfolio.
I also call these "steps," but the process will take place in a different sequence depending on the circumstances. An organization like that in Example 16.2 that needs to get to grips with portfolio management will work through the steps in the order listed above. The company in Example 16.2 needed to know what projects it was doing and the status of all projects. It needed to get to grips with the assignment of resources, and once it had done that it would need to prioritize the acceptance of new projects. But once an organization has got to grips with portfolio management, all five steps will be going on all the time within the portfolio. But within the life of a single project, they will take place in the order 3, 1, 4, 2, 5. I am going to talk through the steps roughly in the order they are encountered by the project.
Example 16.2 Failure in portfolio management
I worked with a well-known food manufacturing company at their London factory. They were having a problem completing key strategic projects. The company had had more than 50 percent market share for canned food in the United Kingdom, but had recently lost that position, but still had the largest market share. However, they risked losing that position in the next few years.
For the last four-and-a-half years they had been trying to build a new canning line. This was going to halve the cost per can leaving the factory gate. The project had originally been planned for two years, had already taken four-and-a-half years and had at least six months to run. It was at least 100 percent behind schedule. My client was the manager of a computer project to implement a material-monitoring system, which was also going to reduce the cost per can leaving the factory gate. He couldn't get factory managers to commit to attending project meetings. Production needs always took precedence over the project. Without user input, his project could not progress. The factory had also just started a Six Sigma implementation.
I started by planning the resource requirements of those three projects. It turned out that over the next six months they would require 30 percent of the factory managers' time. So if they were working Monday to Friday on production needs, they had to work Saturday and Sunday morning to fulfil their input to just those three projects. I next drew up a list of all the ongoing projects. There were 100. The three largest required 30 percent of the factory managers' time. The company had no idea.
I also asked for a plan and progress report on the new canning line. The company had recently spent £1 million buying a licence for mainframe project management software, and the only plans they were able to give me were schematic plans in a well-known PC-based system—for this project that was 100 percent behind schedule. The engineering director was sacked shortly afterwards.
The first step is to decide whether to add a project to the portfolio or not. To do that projects have to be rank-ordered according to a set of criteria. The two key criteria are the benefit of the project and its risk. These are plotted in Fig. 16.2. However, other criteria may be included in the ranking, including:
![]() Strategic importance
Strategic importance
![]() Opportunity for learning
Opportunity for learning
![]() Stakeholder acceptance
Stakeholder acceptance
You may calculate a weighted average of all the criteria to determine the actual ranking of projects. In Fig. 16.2, there is a hurdle rate for acceptance of projects, the upper line. Projects in the top left-hand corner are acceptable. The line slopes up because higher risk projects are required to have higher returns. There is a lower hurdle rate, and projects below that, the bottom right-hand corner, are usually rejected. Projects in the middle band are borderline and other criteria may be considered.
The decision to accept or reject projects will be taken at a portfolio prioritization meeting. For the investment portfolio, this typically takes place once every three months. Within a miscellaneous portfolio it may take place more frequently. At the meeting you look at all the projects currently on the list of proposed projects. This will include all new projects proposed since the last meeting, and any brought forward from the last meeting. The prioritization is quite brutal. You know how many resources (money and people) you have available to work on new projects. You transfer projects from the proposed list to the list of new projects, working down in rank order, until you have exceeded the resource availability.
With one of my clients in the financial services industry it didn't quite end there. They would then look at the next project on the proposed list and ask if it was higher priority than one already in progress. If the answer was yes, the one in progress was cancelled and the proposed one added on top of the list of new projects. This would carry on until ones on the proposed list were not higher priority than ones in progress.
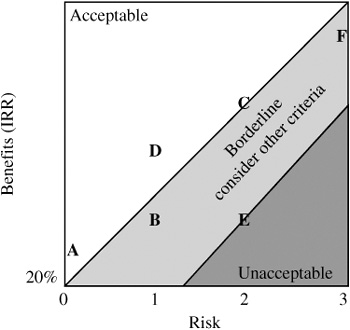
FIGURE 16.2 Benefit-risk diagram.
TABLE 16.1 Six Large Projects and Programs
| ||||
Project | Cost (million) | IRR | Risk | Project type |
| ||||
Program A | $30 | 21% | 0 | Operational improvement |
Program B | $30 | 22% | 1 | Operational improvement |
Program C | $30 | 26% | 2 | Capital expansion |
Project D | $30 | 24% | 1 | New product |
Project E | $30 | 22% | 2 | New product |
Project F | $30 | 26% | 3 | Strategic repositioning |
| ||||
It is still not the end for projects on the proposed list. For some you might decide their time is not now, but in the future their priority might increase, and so they may be carried to the next or a subsequent meeting. All other projects will be rejected and deleted from the list.
As a simple example, consider a firm with proposals for six large projects and programs each costing $30 million, 60 medium-sized projects each costing $3 million, and 600 small projects each costing $0.3 million. It has proposals for $540 million worth of projects but only has $300 million to spend. For the large projects, the benefit (measured by internal rate of return), risk (measured by where the project sits in Fig. 10.1), and project type are shown in Table. 16.1. They are also plotted in Fig. 16.2. We have to decide how many of the large projects (and programs) we are going to do, and then that says how much money is left over for the medium- and small-sized ones. You can see from this simple example how the small- and medium-sized projects cannot compete alongside the large ones. They just cannot be seen in the noise. Programs A and C and Project D are clearly acceptable and Project E unacceptable. If you do A, C, and D you will have $220 million left over for the medium and small projects, perhaps $110 million to each portfolio. But you may decide you want to do one or both of B and F. They actually score equally on the benefit-risk plot, being on a line parallel to the two hurdle lines. You may prefer B because it is lower risk. You may prefer F because it offers opportunities for strategic repositioning and therefore potentially unknown returns over and above the direct ones. If you do one you have $180 million left over for the small and medium projects and if you do both $150 million left over. Your call.
Postproject Evaluation
I want to deal next with postproject evaluation. There is a fundamental flaw in the previous step: project sponsors are encouraged to inflate the potential benefit of their project and deflate the cost and the risk. If there is no check that projects deliver what their sponsors promise, then expect sponsors to continue to make their projects seem better than they are. Thus postproject evaluation is essential, and project sponsors must be held accountable if their projects fail to deliver the expected benefits (see Example 16.3). It is acceptable if the project delivers a benefit within the expected risk. For instance if Project F in Table 16.1 were to deliver an internal rate of return (IRR) of 20 percent, the hurdle rate at zero risk, that would be acceptable because it is within the range expected given the risk. But if it delivered an internal rate of return of just 15 percent, the sponsor should be made to explain why the benefit was less than predicted.
Example 16.3 Postproject evaluation
I worked with a bank, advising on project categorization. On my first visit they wanted to categorize projects as part of the project prioritization process. They were applying a process similar to that described above. But projects were failing to deliver their promised benefit and so the bank was failing to deliver its growth targets. At the time of my second visit nine months later, the CEO had changed. The new CEO took a different approach. He said they did not need to prioritize projects; they were a bank, access to money was not a problem. Any project that delivered the hurdle rate of internal rate of return, given its level of risk (Fig. 16.2) would be funded. But, a postproject evaluation would be done on every project and sponsors would be answerable if projects failed to deliver the promised benefits.
The Project List and Status Reports
I discuss these two together because the project status report in effect encompasses the project list. This needs to be kept simple. You need a single page showing all the projects in the portfolio and their current status and then a single page for each project. Figure 16.3 is a traffic light report showing the status for all the projects in a portfolio. For the chosen key performance indicators (Sec. 3.3), here cost, time, risk, and forecast first year revenue, each performance is shown as being on one of three status:
Green (light grey in Fig. 16.3): at or ahead of plan (say no worse than 5 percent over estimate)
Amber (grey in Fig. 16.3): just behind plan but not causing concern (say between 5 and 10 percent over estimate)
Red (Black in Fig. 16.3): causing concern (say more than 10 percent over estimate)
What you choose as the limits for the three status levels would depend on the levels of contingency and tolerances you set. For instance with Table. 8.5 the raw cost estimate is 1000, and status green would be anything up to a forecast cost at completion of 1050; that is within the contingency. Status amber would be anything up to 1100; that is within the tolerance, and below the project's budget. Status red would be a forecast cost at completion over 1100; that is over budget. Perhaps black would be anything over 1200. Similar levels could be set for the estimated completion date, forecast risk, and predicted first-year revenue.
For each project, a single-page report is also produced to support the portfolio traffic light report. This can be in the form of a project dashboard (Fig. 3.1) or a single-page

FIGURE 16.3 Traffic light report.
report such as that shown in Fig. 3.2. The advantage of the latter, incorporating the milestone report (Fig. 13.6), milestone tracker diagram (Fig. 9.16), and the earned value chart (Fig. 8.8) is that you can see the progress since the last report. With the project dashboard you just get a snapshot of the project as of today; it might have slipped further since the last report and you can't tell. Example 16.4 gives an example of the use of this in practice.
Example 16.4 Portfolio reports
I did a series of courses for project sponsors with an electronics company. On one of the courses, a senior manager was briefing the delegates and he said the managing director reviewed progress on the top 30 projects once a month. The delegates said that was impossible. It would take a day to review progress on each project so he would spend the whole month reviewing the projects. The answer was he received a traffic light report and a single page report for every project. Two-thirds of the projects (say 20) would be at status green. He would spend 5 minutes on each of those, the first two hours in the morning. Two-thirds of the rest (say 6 to 7) would be at status amber. He would spend 15 minutes on each of those, the rest of the morning. So that would leave three to four projects at status red. He would spend an hour on each of those, do a more thorough investigation, telephone the project manager and sponsor. The ones at status red would take all afternoon.
Sharing Resources
We now need to share the resources between those projects we have chosen to do. The resource requirements should on average balance across all the projects we have chosen to do, but there is a job to do here, for at least two reasons:
1. The resource that will dominate the prioritization of projects is money and so the demands for people may not be in balance and particularly not across all different resource types—some may be underutilized and others overutilized.
2. The resource demands may be in balance with the timescale we did the prioritization over (three months) but not day by day.
First, I will describe what people used to do to share resources and why it doesn't work, and then I will describe the technique I developed which is now accepted as best practice.
In the bad old days of project management, the common approach was to develop a plan for each project, with its resource requirements, and then combine all the individual project plans into one gigantic portfolio plan. That gave the total requirements for each resource. The computer was then asked to schedule all the projects so that the resource requirements did not exceed availability. Now the computer needs to be given a rule to prioritize one project or activity over another when there is a resource clash, and computers are dumb things, so once given a rule, they will apply it blindly and unquestioningly. One possible rule is to make Project A priority1, Project B priority 2, and so on. What happens? Project A gets what it needs. Project B gets what it needs from what is left. And Project C is stop-start-stop-start, never finishing, and wasting loads of money. Another rule is to give priority to activities by size of float. What happens? Every activity is scheduled by late start. You cannot abdicate management responsibility to the computer. You must retain management control. You do plan each project, but you must make decisions at a strategic level, and then plan each project within that framework. Thus I propose a six-step process for managing the prioritisation of resources across projects in a program:
1. Develop individual project plans, at the strategic (or milestone) level.
2. Determine the resource requirements and duration of the individual projects, at that level.
3. Incorporate each individual project into a rough-cut capacity plan (or master project schedule, MPS) as a single element of work, with an idealized resource profile based on the profile and duration calculated at Step 2. Time units here will be weeks or even months.
4. Schedule each project in the master project schedule, according to its priority, to achieve an overall resource balance, and assign it a time and resource window.
5. Manage each project to deliver its objectives within the time and resource window.
There are several provisos to this process:
1. If you are doing internal development projects, you can move projects around, perhaps delay the start, or extend the duration, to achieve a resource balance. If you are a contracting firm doing projects for clients, you don't have that luxury. You cannot tell a client you will start a project a month late because you don't have the resources. The only way contracting companies find to deal with this is by hiring subcontract staff. Typically, contracting companies have between 20 and 40 percent peripheral workers. It might be the forward plan shows the resource requirements dropping, but that is as an assignment comes to an end. The company has five bids out, expecting to win one on average. If it doesn't win any, it will need to lay contract staff off (much cheaper than making core workers redundant). If it wins one, it will retain all the existing workers. If it wins two it will need to find new workers. If it wins three, it will not be able to cope. How can you manage that uncertainty other than by using subcontract staff?
2. I first met an organization doing this in the ship repair industry. But the resource profile of all ships is the same. If you delay one project to solve a problem with shipwrights, you solve a similar problem with fitters, plumbers, riggers, and all the resources; not necessarily at the same time, but in phase. That does not work with projects involving professional people which tend to be much less homogeneous. As you solve a problem with hardware engineers, you create a bigger problem with systems analysts or marketing people. So even for internal projects people find they need to use peripheral workers.
This process involves three groups of people: portfolio managers, project managers, and resource managers (Fig. 16.4).
Portfolio Managers. Demands for new projects in the portfolio come to the portfolio managers. They ask project managers to plan the projects, defining the duration and summary resource requirements. The portfolio managers add the project to the rough-cut capacity plan. Resource managers give the portfolio managers the resource availability, and the portfolio managers give the individual projects a start and finish date and resource availability to balance the overall requirements.
Project Managers. Project managers then schedule the individual projects using the tools described in Part 2. In particular, they break the projects into work packages with individual start and finish dates. They then make resource demands on the resource managers in one of two ways as described in Sec. 6.2. Either they ask resource managers to second people onto the project (they have to do this for work packages involving resources from several departments), or they ask the resource manager to take responsibility for delivering individual packages of work (they can do this for single resource packages of work).
Resource Managers. Resource managers then need to resource projects in accordance with those demands. The demands should balance. But if the resource levelling in the rough-cut capacity plan is accurate to ±5 percent and there are 10 projects in the portfolio and each project has been broken into 10 work packages, the demands made on the resource

FIGURE 16.4 Portfolio management.
managers will only be accurate to ±50 percent (the error is proportional to ![]() , Sec. 5.1). Thus the resource managers still have a job to do smoothing the demands day by day.
, Sec. 5.1). Thus the resource managers still have a job to do smoothing the demands day by day.
Caveat. Maintaining the portfolio resource plan is not easy. As we have seen, there are problems with different profiles for different resources. Further unexpected events happen which can throw the plan out. But if you have the plan, you can cope with the unexpected events. You can work out their impacts and try to deal with them. If you don't have the plan you are completely out of control. It is not easy, it is not perfect, but it helps considerably.
Impact Matrix
I said above that resources are people and money, and in discussing prioritization I was dealing with money, and in discussing sharing of resources I was dealing with people. But resources can also be technology, data, plant, equipment, and the like. These create linkages between projects. Linkages are risks and so need to be managed. The risk management process is to identify the risk, assess the risk, and take action to reduce it, and this suggests how the linkages can be dealt with.
Identify. The impact matrix is a tool to identify the linkages. It is very simple. You put the projects down the rows and across columns and mark in the body of the matrix where there is a link. You are usually not concerned which direction the impact is so you only need a half matrix.
Assess. Rank the impacts as major, medium, or minor.
Reduce. Take action to reduce the major impacts. One way is to group the projects into subportfolios, where the major impacts are between the projects in the subportfolio and not with others. Then the control of those impacts can be the responsibility of one person.
Programs follow a life cycle very similar to a project. The difference is that during the early stages—concept, feasibility, and design—you identify that to achieve your change objectives you need to do a number of unrelated things. Thus, rather than breaking the program into work packages, you break it into several subsidiary projects, which will be managed and delivered independently. There are four fairly significant differences between projects and programs. These differences are all related to each other, and in fact one follows the other.
smARt Objectives. The first, as I discussed above, is that for most programs the objectives are not as specific, measurable, and timelined as you would expect for a project. For the program in Example 16.1, the objectives were SMART. The program consisted of four projects, the shop, the sports centre, the car park, and the road access, and they were all clearly defined. However, on many programs this is not the case, and indeed is one of the great advantages of program management, you can start working on something when you don't know precisely what the program will encompass. You can't precisely define the change objectives you want to achieve, and so you can't precisely define all the outputs the program will deliver, but you can define enough to identify early projects with SMART objectives. The development of the palm nut industry in Example 1.3 was like this. In fact the early stages of the program may help you define what the later stages will deliver. I suggest the idea of a fish-tail program (Fig. 16.5). You have a vision of the end state you would like to achieve, perhaps two years away, but this is not precisely defined. So you start working on early projects (or projettes) which can be precisely defined, and link those into the growing system. That helps you clarify the end objective. Perhaps when you are 6 months into a 24-month program the end objective has been clarified and is now 2 months away, not 18. We will also see shortly, that you may never achieve the end objective, deciding at some point that you have done enough.
Early Benefits Realization. A major difference between the $50 million program and project is the opportunity for early benefits realization. With the project, you do all the work of the project, and only after you commission the project deliverable at the end can you begin to get any revenue returns. Thus a large amount of money is tied up before you can get any returns. This would happen if you were building a new power station, airport, or bridge; the whole thing must be finished before you can use any of it. But with the palm oil industry to the shopping and sporting complex that is not the case. With the former you can build one plantation and one factory, and use the income from that to fund the development of further plantations and factories. With Example 16.1, you could complete the road access, car park, and shop, and receive benefit from those while building the sports hall.

FIGURE 16.5 Fish-tail program.
With a larger out of town shopping centre you might do it in several phases, and use the income from the early phases to fund the later phases.
Cyclic Delivery. This then clearly lends itself to undertaking the program in phases. You undertake the projects in several phases (Fig. 16.6) gaining benefits realization from the early phases to pay for the later ones. But you also decide at the completion of each phase whether you want to continue with the program. The steps of the cycle are as follows:
Initiation: The first step, done once only, is initiation. During the concept, feasibility, and systems design stages, you plan what projects you think the whole program will entail and divide them into several stages. You then define precisely the projects for the first cycle.
Project execution: You execute the projects for the current cycle.
Project delivery and linkup: As the projects from the current stage are delivered, you measure what the program is achieving and what benefits are being realized. You then decide whether you want to continue with the program. There are several possible outcomes here:
![]() You may continue as first envisaged.
You may continue as first envisaged.
![]() You may terminate the program early because you are not achieving the benefits expected.
You may terminate the program early because you are not achieving the benefits expected.
![]() You may decide to terminate the program early because the early stages delivered more benefits than expected, and so there is little left for later stages of the program to achieve.
You may decide to terminate the program early because the early stages delivered more benefits than expected, and so there is little left for later stages of the program to achieve.
![]() The program may be 95 percent complete, but it is not cost effective to do the last 5 percent.
The program may be 95 percent complete, but it is not cost effective to do the last 5 percent.
![]() The program may have achieved all the objectives you originally envisaged, so you stop.
The program may have achieved all the objectives you originally envisaged, so you stop.
![]() The program has been so successful you decide to do additional work.
The program has been so successful you decide to do additional work.
Renewal: If you decide to move into the next cycle, you need to define precisely the projects for this cycle, and revise the schematic definition of projects for planned future cycles. You then return to project execution.
Dissolution: If you decide not to continue, you dissolve the program. As part of this, you need to decide how any outstanding work will be dealt with.

FIGURE 16.6 Cyclic delivery of programs.

FIGURE 16.7 Governance roles on projects and programs.
Governance. All the roles identified for a project in Sec. 15.2 also exist for the program: the sponsor, the steward, the manager, and the owner or business change manager, and people fulfilling those roles on the project report to the person fulfilling the same role on the program (Fig. 16.7). In fact, the role of the business change manager, responsible for embedding the change and achieving the benefit was first identified in program management. The project manager cannot be responsible for embedding the change because he or she will be moving on to manage projects in the next cycle of the program. The project manager has to hand over the project outputs and the new capabilities and leave it to somebody from the business to embed the change and achieve the early benefits realization. On programs, the responsibility for delivering the new capabilities and the responsibility for embedding the change are clearly distinct, the former held by people from project and program management and the latter held by people from the business or user departments.
Our understanding of the project office has also changed considerably in the past 10 years. It started life as something supporting a large or major project, where all the project planning and control support was located. Through a process which Monique Aubrey and Brian Hobbs3 call "Balkanization" the role of the project office has divided and evolved. Jack Duggal4 identified five roles for the project office:
1. Supporting planning and control on a large project or program
2. Decision support for portfolio management, as described in Sec. 16.2
3. Governance, including the development of policies, procedures, and systems and the production of compliance reports
4. Data and knowledge management, training, and consultancy
5. Communication and relationship management
The first of these is a temporary role that lasts as long as the project or program. All the rest are permanent. Thus the project office has evolved from a temporary governance role, associated just with a large project and ceasing to exist when the project ends, into a permanent feature of the organization.
Duties of the Project Office
To fulfil these roles, the project support office can undertake a number of duties:
Maintaining the Master Project and Program Plans. The project office maintains the master project, program, and portfolio capacity plans on a central (computer) system:
![]() For a large project, that will be a stand-alone plan.
For a large project, that will be a stand-alone plan.
![]() For a major project or program, it may be broken down into subproject plans.
For a major project or program, it may be broken down into subproject plans.
![]() For a portfolio, the project office will maintain the capacity plan and individual project plans.
For a portfolio, the project office will maintain the capacity plan and individual project plans.
In all cases there must be clearly defined levels of access for different managers. All managers will need to interrogate the plans at all levels. However, they will only be able to make changes at their level of responsibility. Changes must be within the tolerance set at the higher level. If that is not possible, the approval of the higher level manager must be sought. Sometimes, the ability to make changes is limited to the project office staff. Managers can only recommend. In this way the integrity of the system is maintained.
Maintaining the Company-Wide Resource Plan. The resource aggregation at the project level provides the company-wide resource plan. The project office can take a company-wide view of the resource availability and assign resources to individual projects (within the constraints set by investment portfolio). Individual projects are not in a position to do this, unless they have a dedicated resource pool.
Providing Resource Data to the Project Initiation Process. When the organization is considering whether to initiate a new project, the project office can compare the resource requirements to projected availability. The project office does not have the power to veto a project, it is up to senior management to accept or reject it. However, if there are insufficient resources, senior management must decide whether to stop another project, or buy in resources from outside. That is extremely valuable information. Better not to start a project, than stop it half finished.
Issuing Work-to Lists and Kit-Marshalling Lists. At regular intervals, as agreed with project managers or as set by the company's procedures, the project office will issue work-to lists and kit-marshalling lists (Chap. 13). Giving this work to the project office ensures it is done regularly, and that it is done to a consistent style, in a way which people from across the organization can readily understand.
Facilitating the Control Process. The project office can manage the control process, relieving project staff of some of the bureaucratic processes, allowing the latter to concentrate on their project work. Figure 6.5 is a responsibility chart showing a procedure for this control cycle. The project office will of course facilitate the control of time, cost, quality, scope, resource usage, (organization), and risk. This activity requires the project office to:
![]() Progress, receive, and process the turnaround documents
Progress, receive, and process the turnaround documents
![]() Analyze the consequences of the progress information
Analyze the consequences of the progress information
![]() Perform the what-if analysis
Perform the what-if analysis
![]() Revise the plan with the appropriate manager
Revise the plan with the appropriate manager
![]() Reissue work-to lists for the next period
Reissue work-to lists for the next period
Issuing Progress Reports. Following on from the control process, the project office can issue progress reports. These may go to:
![]() Project managers
Project managers
![]() Program and portfolio managers
Program and portfolio managers
![]() Other senior managers
Other senior managers
![]() Client
Client
The reports issued will be defined by a procedures manual. The data gathered in turnaround documents may be used for other purposes, such as:
![]() Payroll
Payroll
![]() Recording of holidays and flexitime
Recording of holidays and flexitime
![]() Raising of invoices
Raising of invoices
![]() Recording project costs for the company's accounting systems
Recording project costs for the company's accounting systems
For the last, it is vital that costs are recorded by the project and sent to the accounts system, and not vice versa. With the latter, information can be received several months after costs are incurred, which is far too late for control. The data can be recorded separately for each system, but then it almost never agrees. The dispatch of this data, which may be electronic, will be done by the project office as part of the reporting process. It is important to review the data before dispatch, rather than allowing it to go automatically to ensure its integrity. However, this can be simplified by building in automatic checks.
Operating Document Control and Configuration Management. Projects can involve the transmittal of a large amount of information. The project office can coordinate that transmittal. This may include
1. Keep a library of progress reports for ready access by any (authorized) personnel.
2. Record all correspondence to and from clients and subcontractors. As part of this process, the project office may include acknowledgement slips, and monitor their return to ensure receipt of the correspondence. Technical personnel can be lax in the recording of correspondence, which can cause problems if there is a claim. To avoid this, some organizations insist that all outward correspondence goes via the project office, and a copy of all inward correspondence is logged there. Since all correspondence becomes part of the contract, the need to log it cannot be stressed enough.
3. Monitor all correspondence between project personnel. On a large project, this can drastically reduce the channels of communication. However, it is more efficient to have a central clearing point for communication on projects with as few as four people. This can be essential if people have not worked together before, on projects with tight timescales, and on projects involving research scientists, who do not tend to be very communicative.
4. Maintain the records for quality control and configuration management, to ensure they are properly completed, before work commences on the next stage.
5. Monitor the despatch of design information to site or subcontractors to ensure it is received and the latest information used. I have known of cases where drawings are lost in the post, and of course the intended recipients have no way of knowing they should be using new data. Acknowledgement slips solve this problem.
6. Manage issues. Issues can arise on a project, which may or may not lead to a change or a claim. The project office can manage the decision-making process.
Producing Exception Lists. As part of the control process, the project office may produce exception reports. They will produce variance reports at each reporting period, but exception lists will highlight items which have become critical.
Purchasing and Administration of Subcontracts. Where there is not already a purchasing department within the parent organization, the project can take over the procurement function. There is a view that in some project-based organizations a very high proportion of total expenditure on projects is through purchased materials or sub-contract labour, and so this function should be within the control of project or program management.
Maintaining the Client Interface. The project office may manage the relationship with the client. This includes the issuing of progress reports, the control of communications, and the dispatch of invoices. It also involves producing reports against agreed milestones, and the maintenance of links with opposite numbers in the client organization so that any threats to the contract can be worked through together. Contacts with the sponsor and other decision makers can help to ensure continued support for the current contract, which will ease its delivery, and help to win new work.
Acting as a Conscience. Effective project management requires that all the control procedures described are well maintained. Some can become bureaucratic, and distracting for the technical staff. While the project is running smoothly, they can seem unnecessary, and not receive adequate attention. However, if the project does go wrong, the data and plans are required to plan recovery or defend a claim. It is then too late to start recording the data and maintaining the plans. It must be done from the start. The project office can relieve project staff of the bureaucratic burden. Because they maintain the plans as their day-to-day duties, they become efficient at it, so the cost of the administrative overhead is less than if project personnel do it. Indeed, the service and support they give can speed up the work of the project. In fulfilling this role, the PSO act as a conscience, because they ensure the regular reports are filed, and they will not let certain major milestones be met until appropriate documentation is completed.
1. A program is a set of projects contributing to a common goal.
2. A portfolio is a set of projects sharing common resources.
3. There is a five-step process for managing portfolios:
![]() Maintain a list of all current projects in a project database.
Maintain a list of all current projects in a project database.
![]() Report the status of all projects through a central project reporting system.
Report the status of all projects through a central project reporting system.
![]() Plan and assign resources on all projects centrally.
Plan and assign resources on all projects centrally.
![]() Prioritize and select projects through a transparent system maintained centrally.
Prioritize and select projects through a transparent system maintained centrally.
![]() Evaluate the business benefits of all projects postcompletion.
Evaluate the business benefits of all projects postcompletion.
4. To prioritize projects you need some way of rank-ordering the projects, and then choose projects up to the limit of resources. The two main criteria for rank-ordering projects are:
![]() Benefit
Benefit
![]() Risk
Risk
5. There is a five-step process for sharing resources between projects:
![]() Plan each project individually.
Plan each project individually.
![]() Determine its resource requirements.
Determine its resource requirements.
![]() Add to the master project schedule or rough-cut capacity plan.
Add to the master project schedule or rough-cut capacity plan.
![]() Assign each project a time and resource window to balance resources.
Assign each project a time and resource window to balance resources.
![]() Manage individual projects within their time and resource window.
Manage individual projects within their time and resource window.
6. Programs differ from large projects in four ways:
![]() The objectives are less specific, measurable, and timelined, smARt, not SMART.
The objectives are less specific, measurable, and timelined, smARt, not SMART.
![]() You aim for early benefits realization, using revenue from early projects to fund later ones.
You aim for early benefits realization, using revenue from early projects to fund later ones.
![]() The program is delivered through several cycles of projects.
The program is delivered through several cycles of projects.
![]() The governance structures are more focused.
The governance structures are more focused.
7. The project office has up to five functions:
![]() Supporting planning and control on a large project or program
Supporting planning and control on a large project or program
![]() Decision support for portfolio management, as described in Sec. 16.3
Decision support for portfolio management, as described in Sec. 16.3
![]() Governance, including the development of policies, procedures, and systems, and the production of compliance reports
Governance, including the development of policies, procedures, and systems, and the production of compliance reports
![]() Data and knowledge management, training and consultancy
Data and knowledge management, training and consultancy
![]() Communication and relationship management
Communication and relationship management
8. The role of the project support office is to:
![]() Maintain the master project and program plans
Maintain the master project and program plans
![]() Maintain the company-wide resource plan
Maintain the company-wide resource plan
![]() Provide resource data to the project initiation process
Provide resource data to the project initiation process
![]() Issue work-to lists and kit-marshalling lists
Issue work-to lists and kit-marshalling lists
![]() Facilitate the control process
Facilitate the control process
![]() Issue progress reports
Issue progress reports
![]() Operate document control and configuration management
Operate document control and configuration management
![]() Produce exception lists
Produce exception lists
![]() Purchase and administration of subcontracts
Purchase and administration of subcontracts
![]() Maintain the client interface
Maintain the client interface
![]() Act as a conscience
Act as a conscience
1. OGC, Managing Successful Programs, London: The Stationery Office, 2003.
2. Turner, J.R. and Keegan, A.E., "Mechanisms of governance in the project-based organization: The role of the broker and steward," European Management Journal, 19(3), 254–267, 2001.
3. Hobbs, J.B. and Aubry, M., "A multi-phase research program investigating project management offices (PMOs): The results of phase 1," Project Management Journal, 38(1), 2007.
4. Duggal, J.S., "The project, program or portfolio office," in J.R. Turner (ed.), Gower Handbook of Project Management, 4th ed., Aldershot, U.K.: Gower Publishing, 2007.