
Shipping Events
It's your first day at Example.com and your new boss swings by your desk to tell you about the first project you're going to tackle: log management. Your job is to consolidate log output to a central location from a variety of sources. You've got a wide variety of log sources you need to consolidate but you've been asked to start with consolidating and managing some Syslog events.
Later in the project we'll look at other log sources and by the end of the project all required events should be consolidated to a central server, indexed, stored, and then be searchable. In some cases you'll also need to configure some events to be sent on to new destinations, for example to alerting and metrics systems.
To do the required work you've made the wise choice to select Logstash as your log management tool and you've built a basic plan to deploy it:
- Build a single central Logstash server with a single node Elasticsearch cluster on it (we'll discuss scaling more in Chapter 8).
- Configure your central server to receive events, index them and make them available to search.
- Install a Filebeat on a remote agent.
- Configure Filebeat to send some selected log events from our remote agent to our central server.
- Install Kibana to act as a web console and front end for our logging infrastructure.
We'll take you through each of these steps in this chapter and then in later chapters we'll expand on this implementation to add new capabilities and scale the solution.
4Gb of RAM or better.
Our Event Lifecycle
For our initial Logstash build we're going to have the following lifecycle:
- The Filebeat on our remote hosts collects and sends a log event to our central server.
- The Logstash server on our central host takes the log event from and indexes it.
- The Logstash server sends the indexed event to Elasticsearch.
- Elasticsearch stores and renders the event searchable.
- The Kibana web interface queries the event from Elasticsearch.
Now let's implement this lifecycle!
Installing Logstash on our central server
First we're going to install Logstash on our central server. We're going to build an Ubuntu 16.04 host called smoker.example.com with an IP address of 10.0.0.1 as our central server.
Central server
- Hostname: smoker.example.com
- IP Address: 10.0.0.1
As this is our production infrastructure we're going to be a bit more systematic about setting up Logstash than we were in Chapter 2. To do this we're going to use the available Logstash packages.
Installing Java
Logstash's principal prerequisite is Java and Logstash itself runs in a Java Virtual Machine or JVM. Logstash requires Java 8 or later to work!
So let's start by installing Java. The fastest way to do this is via our distribution's packaging system installer, for example yum (or in more recent releases dnf) in the Red Hat family or Debian and Ubuntu's apt-get command.
On the Red Hat family
We install Java via the yum command:
$ sudo yum install java-1.8.0-openjdkyum command has been replaced with the dnf command. The syntax is otherwise unchanged.
On Debian & Ubuntu
We install Java via the apt-get command:
$ sudo apt-get -y install default-jreTesting Java is installed
We then test that Java is installed via the java binary:
$ java -version
openjdk version "1.8.0_91"
OpenJDK Runtime Environment (build 1.8.0_91-8u91-b14-3ubuntu1~16.04.1-b14)
OpenJDK 64-Bit Server VM (build 25.91-b14, mixed mode)
Any Java versioned prefixed 1.8 indicates Java 8.
Installing Logstash
First let's install Logstash. To do so we need to add the Logstash APT repository to our host. Let's start by adding the appropriate GPG key for validating the packages.
$ wget -O - https://artifacts.elastic.co/GPG-KEY-elasticsearch | sudo apt-key add -You may also need the apt-transport-https package.
$ sudo apt-get install apt-transport-httpsNow let's add the APT repository configuration.
$ echo "deb https://artifacts.elastic.co/packages/5.x/apt stable main" | sudo tee -a /etc/apt/sources.list.d/elastic-5.x.listWe then run an apt-get update to refresh our package list.
$ sudo apt-get updateAnd finally we can install Logstash itself.
$ sudo apt-get install logstashNow let's install some of the other required components for our new deployment and then come back to configuring Logstash.
/usr/share/ directory, /usr/share/logstash.
Installing Logstash via configuration management
You could also install Logstash via a variety of configuration management tools like Puppet or Chef or via Docker or Vagrant.
You can find Chef cookbooks for Logstash at the Chef supermarket.
You can find Puppet modules for Logstash on the Puppet Forge.
You can find an Ansible role for Logstash here.
You can find Docker images for Logstash on the Docker Hub.
You can find a Vagrant configuration for Logstash on GitHub.
Elasticsearch for search
Next we're going to install Elasticsearch to provide our search capabilities. Elasticsearch is a powerful indexing and search tool. As the Elastic team puts it: "Elasticsearch is a response to the claim: 'Search is hard.'". Elasticsearch is easy to set up, has search and index data available RESTfully as JSON over HTTP and is easy to scale and extend. It's released under the Apache 2.0 license and is built on top of Apache's Lucene project.
We're going to install a single Elastichsearch node on our central server as a initial step. In Chapter 8 we'll talk about scaling Elasticsearch for both performance and reliability.
Installing Elasticsearch
Elasticsearch's only prerequisite is Java. As we installed a JDK earlier in this chapter we don't need to install anything additional for it. Elasticsearch is currently not well packaged in distributions but it is easy to download packages. The Elasticsearch team provides tarballs, RPMs and DEB packages. You can find the Elasticsearch download page here.
As we're installing onto Ubuntu we can use the DEB packages provided:
First, if we haven't already, we install the Elastic.co package key.
$ wget -O - https://artifacts.elastic.co/GPG-KEY-elasticsearch | sudo apt-key add -Now, again assuming we haven't already down it above, we add the Elastic repository to our Apt configuration.
$ echo "deb https://artifacts.elastic.co/packages/5.x/apt stable main" | sudo tee -a /etc/apt/sources.list.d/elastic-5.x.listNow we install Elasticsearch.
$ sudo apt-get update
$ sudo apt-get install elasticsearchInstalling the package should also automatically start the Elasticsearch server but if it does not then you can manage it via the service command:
$ sudo service elasticsearch startAnd enable it to run at boot.
$ sudo systemctl enable elasticsearchYou can then check is Elasticsearch is running with the status command.
$ sudo service elasticsearch statusIf it is NOT running you'll see failed start output. If your failed output looks like this:
● elasticsearch.service - Elasticsearch
   Loaded: loaded (/usr/lib/systemd/system/elasticsearch.service; disabled; vendor preset: enabled)
   Active: failed (Result: exit-code) since Thu 2016-11-03 13:11:32 UTC; 2s ago
     Docs: http://www.elastic.co

. . .

Nov 03 13:11:32 smoker.example.com systemd[1]: Started Elasticsearch.
Nov 03 13:11:32 smoker.example.com elasticsearch[1541]: OpenJDK 64-Bit Server VM warning: INFO: os::commit_memory(0x000000008a660000, 1973026816, 0) failed; error='C
Nov 03 13:11:32 smoker.example.com elasticsearch[1541]: #
Nov 03 13:11:32 smoker.example.com elasticsearch[1541]: # There is insufficient memory for the Java Runtime Environment to continue.

. . .
Then Elasticsearch doesn't have enough memory to run! You'll need a host with at least 4Gb of RAM to run Elasticsearch.
Installing Elasticsearch via configuration management
You could also install Elasticsearch via a variety of configuration management tools like Puppet or Chef or via Docker or Vagrant.
You can find a Chef cookbook for Elasticsearch on the Chef Supermarket.
You can find a Puppet module for Elasticsearch here.
You can find an Ansible role for Elasticsearch here.
You can find Docker images for Elasticsearch here.
You can find a Vagrant configuration for Elasticsearch here.
Introduction to Elasticsearch
Now we've installed Elasticsearch we should learn a little about how it works. A decent understanding is going to be useful later as we use and scale Elasticsearch. Elasticsearch is a text indexing search engine. The best metaphor is the index of a book. You flip to the back of the book1, look up a word and then find the reference to a page. That means, rather than searching text strings directly, it creates an index from incoming text and performs searches on the index rather than the content. As a result it is fast.
Under the covers Elasticsearch uses Apache Lucene to create this index. Each index is a logical namespace, in Logstash's case the default indexes are named for the day the events are received, for example:
logstash-2012.12.31Each Logstash event is made up of fields and these fields become a document inside that index. If we were comparing Elasticsearch to a relational database: an index is a table, a document is a table row and a field is a table column. Like a relational database you can define a schema too. Elasticsearch calls these schemas "mappings".
It's important to note that you don't have to specify any mappings for operations, indeed many of the searches you'll use with Logstash don't need mappings, but they often make life much easier. You can see an example of an Elasticsearch mapping here. Since Logstash 1.3.2 a default mapping is applied to your Elasticsearch and you generally no longer need to worry about setting your own mapping.
Like a schema, mapping declares what data and data types fields documents contain, any constraints present, unique and primary keys and how to index and search each field. Unlike a schema you can also specify Elasticsearch settings.
Indexes are stored in Lucene instances called "shards". There are two types of shards: primary and replica. Primary shards are where your documents are stored. Each new index automatically creates five primary shards. This is a default setting and you can increase or decrease the number of primary shards when the index is created but not AFTER it is created. Once you've created the index the number of primary shards cannot be changed.
Replica shards are copies of the primary shards that exist for two purposes:
- To protect your data.
- To make your searches faster.
Each primary shard will have one replica by default but can also have more if required. Unlike primary shards, this can be changed dynamically to scale out or make an index more resilient. Elasticsearch will cleverly distribute these shards across the available nodes and ensure primary and replica shards for an index are not present on the same node.
Shards are stored on Elasticsearch "nodes". Each node is automatically part of an Elasticsearch cluster, even if it's a cluster of one. When new nodes are created they can use unicast or multicast to discover other nodes that share their cluster name and will try to join that cluster. Elasticsearch distributes shards amongst all nodes in the cluster. It can move shards automatically from one node to another in the case of node failure or when new nodes are added.
Configuring our Elasticsearch cluster and node
Next we need to configure our Elasticsearch cluster and node name. Elasticsearch is started with a default cluster name and a random, allegedly amusing, node name, for example "Frank Kafka" or "Spider-Ham". A new random node name is selected each time Elasticsearch is restarted. Remember that new Elasticsearch nodes join any cluster with the same cluster name they have defined. So we want to customize our cluster and node names to ensure we have unique names. To do this we need to edit the /etc/elasticsearch/elasticsearch.yml file. This is Elasticsearch's YAML-based configuration file. Look for the following entries in the file:
# Use a descriptive name for your cluster:
#
#cluster.name: my-application
#
# ------------------------------------ Node ------------------------------------
#
# Use a descriptive name for the node:
#
#node.name: node-1
We're going to uncomment and change both the cluster and node name. We're going to choose a cluster name of logstash and a node name matching our central server's host name.
cluster.name: logstash
node.name: "smoker"
We then need to restart Elasticsearch to reconfigure it.
$ sudo service elasticsearch restartWe can now check if Elasticsearch is running and active.
Determining Elasticsearch is running
You can tell if Elasticsearch is running by browsing to port 9200 on your host, for example:
$ curl http://localhost:9200This should return some status information that looks like:
{
  "name" : "smoker",
  "cluster_name" : "logstash",
  "cluster_uuid" : "RyF1O9JLQqafAb6jzKIZkQ",
  "version" : {
    "number" : "5.0.0",
    "build_hash" : "253032b",
    "build_date" : "2016-10-26T05:11:34.737Z",
    "build_snapshot" : false,
    "lucene_version" : "6.2.0"
  },
  "tagline" : "You Know, for Search"
}
You can also browse to a more detailed statistics page:
http://localhost:9200/_stats?pretty=trueThis will return a page that contains a variety of information about the state and status of your Elasticsearch server.
{
  "_shards" : {
    "total" : 0,
    "successful" : 0,
    "failed" : 0
  },
  "_all" : {
    "primaries" : { },
    "total" : { }
  },
  "indices" : { }
}
You can install a wide variety of plugins to Elasticsearch that can help you manage it.
You can list and install a plugin using the elasticsearch-plugin command that ships with Elasticsearch, for example:
$ sudo /usr/share/elasticsearch/bin/elasticsearch-plugin listplugin.
Plugins are generally available in the Elasticsearch server via URLs with a specific URL path, _plugins, being reserved for them.
Creating a basic central configuration
Now we've got our environment configured we're going to set up our Logstash configuration file to receive events. We're going to call this file central.conf and create it in the /etc/logstash/conf.d directory.
/etc/logstash/logstash.yml file that you can use to configure Logstash's command line options and configuration.
$ sudo touch /etc/logstash/conf.d/central.confLet's put some initial configuration into the file.
input {
  beats {
    port => 5044
  }
}
output {
  stdout { }
  elasticsearch { }
}
In our central.conf configuration file we can see the input and output blocks we learned about in Chapter 2. Let's see what each does in this new context.
The central.conf input block
For the input block we've specified one plugin: beats, with one option: port. The beats plugin starts a server on our Logstash central host to listen, on port 5044, for incoming events from Beats. On our client nodes we're going to use a Filebeat to send our events to the central server.
The central.conf output block
The contents of central.conf's output block is fairly easy to understand. We've already seen the stdout plugin in Chapter 2. Incoming events will be outputted to STDOUT and therefore to Logstash's own log file. I've done this for debugging purposes so we will be more easily able to see our incoming events. In a production environment you would probably disable this to prevent any excess noise being generated.
We've added another plugin called elasticsearch. This plugin sends events from Logstash to Elasticsearch to be stored and made available for searching. We're not configuring any options, which will mean that Logstash tries to connect to an Elasticsearch cluster located on the localhost on port 9200. In our case this will be the Elasticsearch cluster we installed earlier.
Running Logstash as a service
Now we've provided Logstash with a basic centralized configuration we can start our Logstash process. You can now run or restart the Logstash service.
$ sudo service logstash startAnd ensure it starts when the host is booted.
$ sudo systemctl enable logstashChecking Logstash is running
We can confirm that Logstash is running by a variety of means. First, we can use the init script itself:
$ sudo service logstash status
● logstash.service - logstash
   Loaded: loaded (/etc/systemd/system/logstash.service; enabled; vendor preset: enabled)
   Active: active (running) since Sat 2016-11-05 10:45:34 UTC; 2s ago
. . .
Finally, Logstash will send its own log output to log files in the /var/log/logstash/ directory.
An interlude about plugins
So far we've seen a couple of different plugins. Plugins provide support for a wide variety of inputs, filters and outputs that we can use to ingest, manipulate and output our log data. Logstash ships with a wide variety of useful plugins by default. You can also add additional plugins or even write your own (see Chapter 9). Since version 1.5.0 Logstash plugins have been packaged at RubyGems. This is designed to make it easier to package and distribute them.
Plugins are managed with the logstash-plugin binary. It's located in the /usr/share/logstash/bin directory. This is the default installation location created by the Logstash packages. Let's use it now to list all of the currently installed plugins.
$ sudo /usr/share/logstash/bin/logstash-plugin list
logstash-codec-collectd
logstash-codec-dots
logstash-codec-edn
logstash-codec-edn_lines
logstash-codec-es_bulk
logstash-codec-fluent
logstash-codec-graphite
logstash-codec-json
. . .
We see a list of all the plugins and codecs installed on the host. If we don't find the plugin we want we can see if it's available on the Logstash GitHub plugin organization.
We can then install a new plugin with the logstash-plugin binary. Let's install Logstash's JMX input plugin. We find it on GitHub here. We can install it by referencing the plugin repository name: logstash-input-jmx
$ sudo /usr/share/logstash/bin/logstash-plugin install logstash-input-jmx
Validating logstash-input-jmx
Installing logstash-input-jmx
Installation successful
We can also update an existing plugin.
$ sudo /usr/share/logstash/bin/logstash-plugin update logstash-input-jmxOr remove plugins.
$ sudo /usr/share/logstash/bin/logstash-plugin uninstall logstash-input-jmxThe Kibana Console
Also available for Logstash is a powerful web interface called Kibana that you can use to query and display your log events. The Kibana web interface is a customizable dashboard that you can extend and modify to suit your environment. It allows the querying of events, creation of tables and graphs as well as sophisticated visualizations.
Kibana is a separate product that we can install on our central Logstash host or on another host. It connects directly to our Elasticsearch instance and queries data from it.
Installing Kibana
We're going to install Kibana on our smoker.example.com host. Kibana is available as a download from the Elastic website and as packages for Ubuntu and Red Hat distributions.
Let's install Kibana now. First, if we haven't already, we install the Elastic.co package key.
$ wget -O - https://artifacts.elastic.co/GPG-KEY-elasticsearch | sudo apt-key add -Next, unless we've already done it above, we need to add the Elastic APT repository to our host.
$ echo "deb https://artifacts.elastic.co/packages/5.x/apt stable main" | sudo tee -a /etc/apt/sources.list.d/elastic-5.x.listWe then run an apt-get update to refresh our package list.
$ sudo apt-get updateAnd finally we can install Kibana itself.
$ sudo apt-get install kibana/usr directory, /usr/share/kibana.
Configuring Kibana
To configure Kibana we use the kibana.yml file in the /etc/kibana/ directory. The major items we might want to configure are the interface and port we want to bind Kibana to and the Elasticsearch cluster we wish to use for queries. All of those settings are at the top of our configuration file.
# Kibana is served by a back end server. This controls which port to use.
server.port: 5601

# The host to bind the server to.
server.host: "0.0.0.0"

# The Elasticsearch instance to use for all your queries.
elasticsearch.url: "http://localhost:9200"

. . .
Here we can see that our Kibana console will be bound on port 5601 on all interfaces. The console will point to an Elasticsearch server located at http://localhost:9200 by default. This matches the Elasticsearch server we've just installed. If we installed Kibana on another host we'd specify the host name of a node of that cluster.
The configuration file also contains other settings, including the ability to setup TLS-secured access to Kibana.
Running Kibana
To run Kibana we use the kibana service.
$ sudo service kibana startThis will run the Kibana console as a service on port 5601 of our host.
And we need to ensure Kibana starts when our host boots.
$ sudo systemctl enable kibanaWe then see the Kibana console by browsing to http://10.0.0.1:5601.
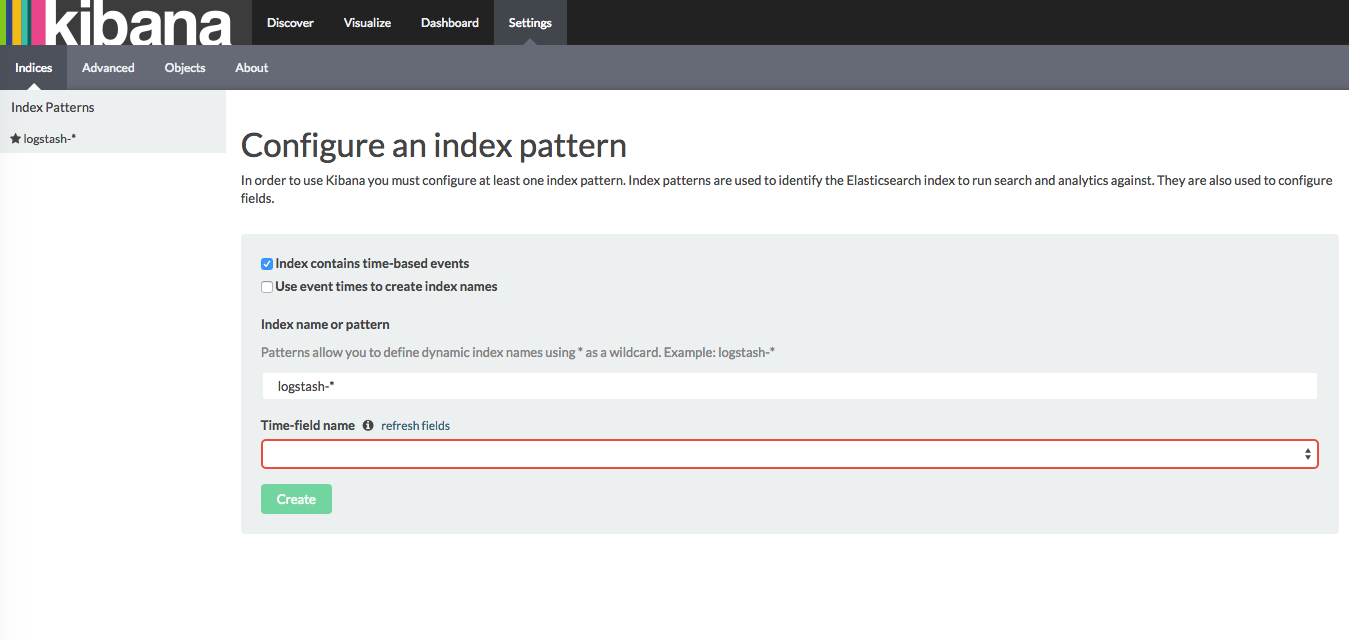
From this setup screen we need to select the indexes that Kibana will search and visualize. By default Kibana has populated logstash-* as our index pattern. We also need to select which field contains event timestamps. Open the dropdown and select @timestamp. Then click the Create button. This will complete Kibana's configuration.
.kibana to hold its configuration. Don't delete this index otherwise you'll need to reconfigure Kibana.
Now click Discover on the top menu bar to be taken to Kibana's basic interface. The Discover interface lists all events received and all the fields available to us. It includes a historical graph of all events received and a listing of each individual event sorted by the latest event received.
It also includes a query engine that allows us to select subsets of events.

We're not going to show you how to do much with Kibana itself primarily because web consoles change frequently and that sort of information and any images we'd show you dates quickly. Thankfully there are some really good sources of documentation that can help.
The Kibana User Guide at the Elastic.co site is excellent and provides a detailed walk through of using Kibana to search, visualize and build dashboards for log events.
Installing a Filebeat on our first agent
Our central server is now idling waiting to receive events so let's make it happy and set up a Beat, specifically the Filebeat, to send some of those events to it. We're going to choose one of our CentOS hosts, maurice.example.com with an IP address of 10.0.0.10 as our first agent.
Agent
- Hostname: maurice.example.com
- IP Address: 10.0.0.10
On the agent we're going to begin with sending some Syslog events to the central Logstash server.
Installing the Filebeat
Next we need to install and configure a Filebeat on the remote agent. Let's install it now.
First, we download the Yum GPG key.
$ sudo rpm --import https://artifacts.elastic.co/GPG-KEY-elasticsearchWe'll now add the Elastic Yum repository to our host. Create a file called /etc/yum.repos.d/elastic.repo and add the following content.
[logstash-5.x]
name=Elastic repository for 5.x packages
baseurl=https://artifacts.elastic.co/packages/5.x/yum
gpgcheck=1
gpgkey=https://artifacts.elastic.co/GPG-KEY-elasticsearch
enabled=1
autorefresh=1
type=rpm-md
We then install Filebeat via the yum command.
$ sudo yum install filebeatOur agent configuration
Now we've got our base in place, let's edit our Filebeat's agent configuration in /etc/filebeat/filebeat.yml. By default, when installed, a Filebeat collects all of logs from files in the /var/log directory. Filebeats collects logs using components called prospectors. Let's look at the Prospectors section of the Filebeat configuration and make some changes.
#=========================== Filebeat prospectors =============================
filebeat.prospectors:

# Each - is a prospector. Most options can be set at the prospector level, so
# you can use different prospectors for various configurations.
# Below are the prospector specific configurations.

- input_type: log
  document_type: syslog
  paths:
    - /var/log/secure

. . .
We've added one option: document_type. The document_type adds a type to our log events, in our case we've add this with a value of syslog. We're going to use this type to route and manipulate log events later in this book.
The paths option specifies a list of paths to crawl and fetch log entries from. In the default case this will be all files, *.log, in the /var/log directory. We've updated this line to only prospect from one file: /var/log/secure. This file holds security-related events.
By default, Filebeat outputs directly to an Elasticsearch cluster. We're going to quickly change that to point to our new central Logstash server. To do this we find the Elasticsearch output section.
#-------------------------- Elasticsearch output ------------------------------
#output.elasticsearch:
  # Array of hosts to connect to.
#  hosts: ["localhost:9200"]

. . .

#----------------------------- Logstash output --------------------------------
output.logstash:
  # The Logstash hosts
  hosts: ["10.0.0.1:5044"]

. . .
We comment out the output.elasticsearch block and uncomment the output.logstash section. Inside that block we specify the IP address of our central Logstash server, 10.0.0.1, and the port we specified in our beats input on the central server: 5044.
Installing Filebeat as a service
Now we've provided Filebeat with a basic remote configuration we can start it as a service.
$ sudo service filebeat startAnd ensure it's enabled at boot.
$ sudo chkconfig --add filebeatChecking Filebeat is running
We can confirm that Filebeat is running by a variety of means. First, we can use the service command:
$ sudo service filebeat status
● filebeat.service - filebeat
   Loaded: loaded (/lib/systemd/system/filebeat.service; disabled; vendor preset: enabled)
   Active: active (running) since Thu 2016-11-03 21:36:55 UTC; 5min ago
     Docs: https://www.elastic.co/guide/en/beats/filebeat/current/index.html
. . .
Finally, Filebeat will send its own log output to log files in the /var/log/filebeat/ directory.
Sending our first events
We've now got our central server and our first agent set up and configured. We're monitoring and sending all log events from log files in the /var/log directory. Any new events logged to it should now be passed to Filebeat and then sent to the central server. They'll be processed, passed to Elasticsearch, indexed and made available to search.
So how do we send some initial events? The /var/log/secure file is the destination for security-relevant system logs including log in activity. So let's login to our host via SSH and generate some messages. Now let's generate a specific event by SSH'ing into Maurice.
smoker$ ssh [email protected]logger here to generate some events. We'll see logger again in Chapter 4.
On the central server though one of our outputs is Elasticsearch via the elasticsearch plugin. So we can confirm that our events are being received and sent to Elasticsearch, indexed, and are available to search by querying Elasticsearch.
We check this by querying the Elasticsearch server via its HTTP interface. To do this we're going to use the curl command.
$ curl "http://localhost:9200/_search?q=type:syslog&&pretty=true"
{
  "took" : 3,
  "timed_out" : false,
  "_shards" : {
  "total" : 10,
  "successful" : 10,
  "failed" : 0
},
"hits" : {
"total" : 5,
"max_score" : 0.5945348,
"hits" : [ {
  "_index" : "logstash-2016.11.05",
  "_type" : "secure",
  "_id" : "ZSMs-WbdRIqLmszB5w_igw",
  "_score" : 0.5945348, "_source" : {"message":"Dec 9 07:53:16 maurice.example.com sshd[2352]: pam_unix(sshd:session): session opened for user root by (uid=0)","@timestamp":"2016-11-05T07:53:16.737Z","@version":"1","host":"maurice.example.com","path":"/var/log/secure",type":"syslog"}
},
. . .
Here we've issued a GET to the Elasticsearch server running on the localhost on port 9200. We've told it to search all indexes and return all events with type of syslog. This type was set by the document_type option we set in the Filebeat configuration on the remote agent.
We've also passed pretty=true to return our event stream in the more readable 'pretty' format. You can see it's returned some information about how long the query took to process and which indexes were hit. But more importantly it's also returned some events which means our Elasticsearch server is operational and we can search for our events.
When we look at the output from Elasticsearch we should see events related to our login attempt. Let's look at one of those events:
{
  "message":"Dec 9 07:53:16 maurice.example.com sshd[2352]: pam_unix(sshd:session): session opened for user root by (uid=0)",
  "@timestamp":"2016-11-05T07:53:16.737Z",
  "@version":"1",
  "host":"maurice.example.com",
  "path":"/var/log/secure",
  type":"syslog"
}
We see it is made up of the fields we saw in Chapter 2 plus some additional fields. The host field shows the hostname of the host that generated the event. The path field shows the file /var/log/secure that the event was collected from. Both these fields are specific to Filebeat, that processed this event.
The message gives us the exact message being collected. The @timestamp field provides the date and time of the event. and the @version shows the event schema version. Lastly, the event type of syslog has been added by the file input.
Looking at our events in Kibana
Querying Elasticsearch isn't the ideal way the examine our events. We do have a console, Kibana, we can use to examine events. Let's take a look at one our log events in the console. We browse to 10.0.0.1:5601 and we should see the Discover tab. Our events should have automatically populated in the tab and we can use the available fields to query or dissect specific event.

Summary
We've made a great start on our log management project. In this chapter we've installed and configured Logstash and Elasticsearch on a central server.
We've installed and configured Filebeat on a remote agent and we can easily replicate this configuration (preferably using configuration management tools like Puppet and Chef).
We're collecting log events from a Syslog log file and transmitting them to our central server. We're indexing them and making them searchable via Elasticsearch and the Kibana web interface.
In the next chapter we're going to expand on our implementation and look at processing some additional log sources, especially in situations when we can't deploy an agent.
Not the first Puppet book.↩