CHAPTER 7
Transitioning to a
New Culture of Market-Driven
Supply Chain
Chapter 7 takes us from setting up the cultural change to the actions of transition in implementation. This chapter also describes the follow-on work required to consolidate the gains, to expand the application globally, to formally update the vision, and to continually improve the processes.
The guiding design principle of Chapter 7 is change culture. You need to have a culture of change, and you need to change the culture. You need to start the transition.
The Transition Plan
Transitions to new cultures do not happen by the principle of “if at first you don't succeed, try, try, again.” They do not happen if you just start something and believe that you will thus just get better. I have heard this principle espoused by the leading S&OP consulting firms. The approach has been tried over and over and succeeds only a very small percentage of the time. The approach of “let the system do it” also fails. That approach assumes that some software developer knows your business and your people well enough to have come up with the perfect solution to your problems. These two principles have failed repeatedly. This is why some 90 percent of all companies with S&OP do not have the commercial side fully engaged and do not produce significant business results.
The transition to the new market-savvy S&OP culture must be methodically planned using proven culture-change techniques.
Change Agent Model
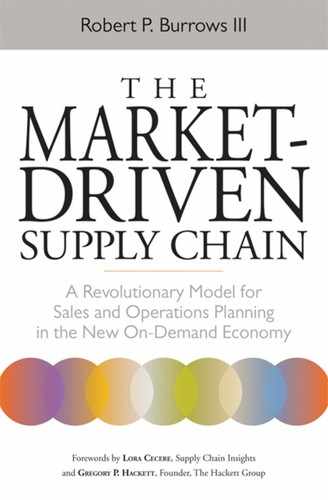
The approach we espouse is a transition planning technique combining the best-known culture-change approaches and a basic cause-and-effect analysis technique. The change agents in our model are powerful: leadership, strategy, communication, money, metrics, and education. All six of these agents are required. The cause-and-effect relationships are shown using a familiar Ishikawa diagram, used so effectively in Lean Six Sigma and adapted to our purposes. The chart shown in Figure 7-1, and as depicted in the HPMS program described in Chapter 5, has six fixed boxes (three on top and three on the bottom) representing the agents of change or causes in our cultural-change situation.
The figures in this book are all in black-and-white. This chart is normally shown in color. So, I will describe what the colors should be and what they represent. When used in actual practice: The box at the extreme left, the one with the north-south lettering, represents the current state, or the S&OP process you have now. Unless you found your process is working well, the color should be red. If you do not currently have an S&OP process at all, then this is whatever you call your current planning process and you should also color it red. Everyone has a planning process even if it is “seat of the pants.” The box on the extreme right, again with north-south lettering, is the future state, or where you have determined to go after completing the design work of Chapters 1 through 6. The color would be shown as green when the future state is fully implemented. If you cannot finish the implementation, the box may become yellow at some point in time. Both of these boxes (current state and future state) need not have any further details included in this chart.
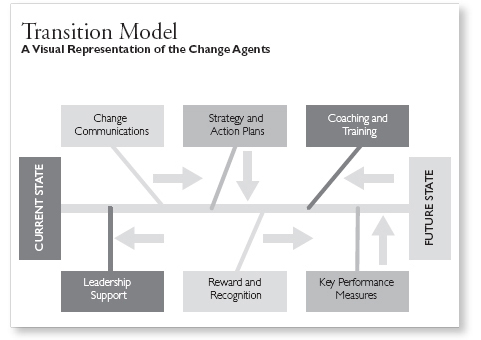
Figure 7-1. SIX AGENTS OF CULTURAL CHANGE.
The causes for the transition to the desired state are outlined in the six boxes at the top and bottom.
The different lines and arrows in the chart should be the same colors as the associated boxes. So a red box indicating a change agent currently working against you would have a red line pointing back toward current state and a red arrow pointing backward. If the change agent is neutral, neither helping nor hindering progress, its color would be yellow. Its line would be yellow with a vertical orientation, and the arrow is yellow, pointing toward the center. If the change agent has become a significant help to achieving change, the box would be green, the line would be green and angled toward the future state end, and the arrow would be green, pointing to the right.
The six boxes representing the agents of change are always the same in title, but they vary considerably in content from company to company or from profit center to profit center inside one company. The six are described as follows:
1. Change Communications. Here we describe how the change should be presented. The elements are as follows:
![]() Branding. The new process should have a name—a brand, so to speak—that is simple and catchy, one word or an acronym.
Branding. The new process should have a name—a brand, so to speak—that is simple and catchy, one word or an acronym.
![]() Channels of Communication. The venues or publications to be used should be described. There are usually four to six; they include a letter from the CEO, a sticky bun meeting, a newsletter, an e-mail blast, an employee meeting, or perhaps a retreat.
Channels of Communication. The venues or publications to be used should be described. There are usually four to six; they include a letter from the CEO, a sticky bun meeting, a newsletter, an e-mail blast, an employee meeting, or perhaps a retreat.
![]() Messages. The key messages should be outlined. Again, there are usually four to six. These include goals to be achieved, strategy, people sought for inclusion, methods, and/or benefits to individuals, customers, or shareholders.
Messages. The key messages should be outlined. Again, there are usually four to six. These include goals to be achieved, strategy, people sought for inclusion, methods, and/or benefits to individuals, customers, or shareholders.
2. Strategy and Action Plans. The critical factors or changes in approach are described in this change-agent box:
![]() List three to four major strategies in the box.
List three to four major strategies in the box.
![]() Do your thinking and boil the strategy down to key phrases that depict action.
Do your thinking and boil the strategy down to key phrases that depict action.
![]() Start each of the four statements with a verb.
Start each of the four statements with a verb.
3. Coaching and Training. Describe specific guided participatory education activities you will use to accentuate the process, behavior, and vision changes:
![]() Include formal education programs, with specific titles and content described in another document.
Include formal education programs, with specific titles and content described in another document.
![]() For coaching, involve conducting pilots, proofing new processes, and developing real-world examples.
For coaching, involve conducting pilots, proofing new processes, and developing real-world examples.
![]() Describe the organizational depth of the expected training.
Describe the organizational depth of the expected training.
4. Leadership Support. Provide for passionate leaders at various levels:
![]() Certainly, CEO support is required.
Certainly, CEO support is required.
![]() List your approach to gaining ownership among leaders in traditional change-resistant organizations.
List your approach to gaining ownership among leaders in traditional change-resistant organizations.
![]() Give thought to the choice of leaders and who or what organizations should be given responsibility.
Give thought to the choice of leaders and who or what organizations should be given responsibility.
5. Reward and Recognition. Money and certificates motivate in powerful ways:
![]() Describe the specific compensation changes required to gain planning and execution alignment, as opposed to the normal performance incentives.
Describe the specific compensation changes required to gain planning and execution alignment, as opposed to the normal performance incentives.
![]() Emphasize team certification or recognition (not individual), such as having implemented a set of processes that score above a nine out of ten in audits.
Emphasize team certification or recognition (not individual), such as having implemented a set of processes that score above a nine out of ten in audits.
6. Key Performance Measures. Both internally and externally measured metrics should be included:
![]() Emphasize the quantitative goal of the overall change process. Again, team metrics are important.
Emphasize the quantitative goal of the overall change process. Again, team metrics are important.
![]() Metrics should include process metrics such as forecast accuracy, performance metrics such as free cash flow goals, and customer metrics.
Metrics should include process metrics such as forecast accuracy, performance metrics such as free cash flow goals, and customer metrics.
Transition Model in Practice
This chart in Figure 7-1 is used initially to communicate, at a high level of abstraction, the essence of the implementation effort or cultural change requirements. Management will gain a good understanding and a useful overview of the essential facts of the work to be done.
The chart is also used as an introductory or overview chart in each monthly progress meeting. The colors of the boxes and their associated lines and arrows should change as progress is being made. Boxes that stay persistently red should attract most of the attention in monthly meetings. The green boxes may be the lead-ins during your meetings, as you should lead with the positives. The content of the boxes, as we describe later, should not change; if it is necessary to change the contents, a significant explanation is required. The transition plan can be reset and should be periodically, but not at every update meeting. Changing the plan should be an event with appropriate emphasis and approvals given by senior management.
The transition model should be developed for the implementation steps in your journey toward a market-savvy S&OP. The model can be used for many different types of cultural change efforts. As an example, consider a company trying to engage the whole organization in committing to a set of shared values. Shared values are often listed in a mission statement developed in the office of the chair or by an executive committee. These shared values are most often not embraced or put into action down through the organization. However, they are critical and should be part of the culture.
We have a client whose shared values are as follows:
![]() Teamwork
Teamwork
![]() Creativity
Creativity
![]() Passion
Passion
![]() Accountability
Accountability
![]() Integrity
Integrity
The company had a good chance of gaining acceptance and conformance to these shared values because senior management worked through the leadership to develop the list in the first place. Senior management held an off-site meeting about corporate strategy. The impetus was a particularly challenging financial situation being faced in the coming years. A new strategy was required. Shared values were considered a key part of the strategy, as they should be.
The transition model was used to accomplish the change in the culture.
![]() Four venues: A Web conference, newsletter, town meeting, and visual display (posters around the office, in restrooms, etc.).
Four venues: A Web conference, newsletter, town meeting, and visual display (posters around the office, in restrooms, etc.).
![]() Four messages: Why shared values are important, how people would be expected to use them, changes in performance reviews, and new training offerings.
Four messages: Why shared values are important, how people would be expected to use them, changes in performance reviews, and new training offerings.
![]() The idea was to demonstrate how the shared values were required to achieve strategic alignment throughout the organization.
The idea was to demonstrate how the shared values were required to achieve strategic alignment throughout the organization.
![]() Coaching and training was to be accomplished with a formal educational program and in daily exercises for ten minutes in each department throughout the company.
Coaching and training was to be accomplished with a formal educational program and in daily exercises for ten minutes in each department throughout the company.
![]() Recognition and reward were treated seriously:
Recognition and reward were treated seriously:
![]() A percentage of the bonus was tied to personal demonstration of the shared values.
A percentage of the bonus was tied to personal demonstration of the shared values.
![]() A recognition program was established to point out exemplary demonstration of the shared values.
A recognition program was established to point out exemplary demonstration of the shared values.
![]() An un-reward was established for behavior inconsistent with shared values.
An un-reward was established for behavior inconsistent with shared values.
![]() A key performance metric was an employee self-assessment on a defined scale of one to five. The assessment was used in the annual reviews.
A key performance metric was an employee self-assessment on a defined scale of one to five. The assessment was used in the annual reviews.
The transition plan presented to management at the approval session and in each monthly meeting had the content shown in Figure 7-2.
When the transition plan is applied to your market-savvy S&OP, the boxes will have content depicting the plans to move from the current state. The current state would be defined using a guided participatory assessment against criteria, as described in Chapter 5 and Chapter 6, as well as in Parts I and II. In addition, the team may have completed some benchmarking against other companies known to have installed advanced S&OP processes.

Figure 7-2. EXAMPLE OF A TRANSITION PLAN.
Individual boxes contain a very brief synopsis of program details.
The transition plan would then outline communication of the branding of the new process and the key principles. I recommend you have one branding and communication plan for all segment-level S&OPs combined, but an individually tailored transition plan for each segment's customer-facing team to have as a guide. The strategy should consist of the vision from Part I of this book and the behavior changes and analytics from Part II. The coaching and training should include formal guided participatory education of people being added to the design team and then for team members in other geographical areas or profit centers. The leadership support strategy should be based on alignment of management to free cash flow and market-share growth goals of the market-savvy S&OP. Reward and recognition should come from completing the implementation of the new process at a rating above 8, an A rating, as described in Figure 7-3. The key performance measures should be the metrics the team defined in the three categories shown on the high-level S&OP process map (Figure 5-1).
Measuring Transition Progress
A Gantt chart should be developed to document the work steps to accomplish the transition plan. The work plan should show work steps, the lead person, team members, person-day estimates for each team member, timelines, and phase start and stop dates. Each action step will likely go through the following phases to completion:
![]() Design
Design
![]() Proofing and testing
Proofing and testing
![]() Education
Education
![]() Execution
Execution
![]() Rollout and monitoring
Rollout and monitoring
In the color version of the transition chart in Figures 7-1 and 7-2, a change from red to green in each of the six change-agent boxes is determined by how progress is made against the transition plan timeline and phase completion schedule. Red, green, and yellow arrows could be shown on the Gantt chart when used in senior management meetings and team meetings.
During the transition plan execution, the design team should be made aware of the eventual audits, the audit criteria, and the process emphasis. Figure 7-3 shows a scoring form for the audit. This form is the same form the external auditor will use to record his or her assessment of the ratings. The process numbers shown on the form are from Figure 5-4—the 26 horizontal planning processes in segment-level S&OP. (The form also includes three globalization processes, which are described later in the chapter.)

FIGURE 7-3. PROCESS RATING AND SCORING CHART.
The fundamental or required processes on the left are given a heavy weighting in the final score calculation.
The team should use the audit list to prioritize its work. The ten fundamental processes shown at the left are the processes you must have performing at a high rating to be recognized by your peers as a company practicing market-savvy S&OP. You must have a rating of 9 or 10 in every one of the fundamental processes and a perfect 10 for at least four of the ten to pass the audit and be rated as having a market-savvy S&OP process. The fundamental processes are the ones that are most important to your achieving competitive advantage and to having strong free cash flow. Meanwhile, there are 16 supporting processes, shown at the right on the form. You can average an 8 on the supporting processes and still pass. None of the processes are easy to install and execute at a high level, but the supporting ones may already exist in part in your organization and be somewhat less time-consuming to complete.
Instituting the Audits and Recognizing the Team Responsible
Both internal and external audits of the new processes are important. Once the transition plan has been nearly fully executed, the team should begin the internal audits of the actual processes being executed.
Preparing the Rating Criteria
You must prepare a chart of the rating criteria for each of the 26 processes. It is best to do this in collaboration with your external auditor to ensure completeness and consistency of thought. Each of the 26 processes should have one page in the audit book containing the pertinent information. Any more than one page would be excessive detail hindering ease of understanding. Figures 7-4 and 7-5 are examples of the assessment criteria for two processes, strategic integration and risks/ opportunity analysis.
The audit criteria should reflect the movement from a Level I S&OP to a Level IV or market-savvy S&OP. The progression is one of becoming centered on customers. The On-Point Group offers an audit design workbook with suggestions for all 26 segment-level S&OP processes, plus three additional processes required when you expand beyond segment-level S&OP to global concerns.

FIGURE 7-4. AUDIT BOOK PAGE FOR PROCESS #1, STRATEGIC INTEGRATION.
The developmental progression is from simply having a plan to having customer alignment and customer metrics in the strategy.
Process #26—S&OP process governance—is more of a checklist than any of the other processes. I mention #26 here when I am not outlining all the processes because the title does not give the reader as much of a clue as to content as the other titles seem to do. The list should include all of the following elements:
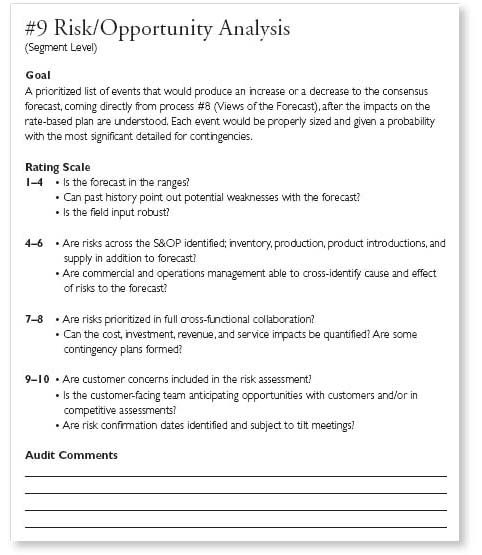
FIGURE 7-5. AUDIT BOOK PAGE FOR PROCESS #9, RISKS/OPPORTUNITY ANALYSIS.
The pattern is the same as in the previous example; the criteria show progress in development, in this case, from looking at ranges in the forecast to having customer-facing teams involved in adding opportunities found from external collaboration.
1. A calendar of meetings, pre-meetings, and key events or deadlines maintained by the day for 12 months going forward
2. An S&OP process map
3. A process description book and an audit criteria book, with one page per process
4. A documented list of agenda topics for each meeting and pre-meeting
a. Actual agenda with expected time allowances
b. Agendas available 24 hours in advance
5. A record of adherence to the published meeting schedule
6. A record of attendance at the meetings and a plan for encouraging full attendance
7. Documents prepared and available 24 hours ahead (a log should be kept)
8. Meeting minutes taken and distributed within 24 hours
9. Action items documented and a formal follow-up process provided (as discussed in Chapter 5)
10. Documents retained for a rolling 12-month period
The audit rating for process #26 is a count of the checklist items considered fully implemented at a good level of quality and available for audit.
Performing the Internal Audit
In practice, an internal audit is performed using these process-specific rating criteria. The internal audit team should look for evidence the criteria are being met in the actual S&OP documents shared in pre-meetings and S&OP meeting and kept as a permanent record. The external auditor should then be able to readily find the documents in the materials used during the formal audit.
Each company is different in subtle ways, and each segment is different. Where you are different, make sure you have not violated the design criteria in your process design and execution. For the ten fundamental processes, some creativity should be tolerated, but not a violation of the spirit of the design principles.
The process-rating questions in each section of the rating criteria (examples shown as Figures 7-4 and 7-5) are thought-starters. You should not be tied down to a yes or no answer. The processes are supposed to be flowing and interrelated.
The external auditor may not ask all the questions. The external auditor is looking for documentation that the process is being used to manage the business. The assessment will be based upon how decisions are actually made, what information is regularly made available, and the quality of the cross-functional balance being achieved.
Each of the seven guiding principles should be seen in the Level IV process criteria, which is a rating of 9 or 10, as shown in the chart in Figure 7-6. The progression in concept should also be as shown in Figure 7-6.
Performing the External Audit
The external audit is a formal process conducted over several days. The external auditors must have experience with top-performing S&OP companies, or at least they have visited and benchmarked the leading companies. This is no place for a novice or someone with good intentions who is not actually proficient in market-savvy S&OP. The external audit needs to provide specific benchmark information and continuous improvement input into the final audit report. The audit is, in essence, a learning experience, not a final destination.
The auditors should meet with the audit coordinator prior to the formal audit meetings to ensure the materials will be ready and any special circumstances are considered and allowed. They should also discuss the agenda details for approval. Audits normally require three days to complete. The outline is as follows:
Day 1—Business overview, presentations by the profit-center leaders on the following:

FIGURE 7-6. CONCEPTUAL DESIGN OF THE RATING CRITERIA.
Each of the seven guiding principles should be considered in defining the qualifications of the rating levels. The gradients are shown here.
![]() Strategy
Strategy
![]() AOP
AOP
![]() Competitive advantage assessment
Competitive advantage assessment
Day 2—Inputs to the S&OP meeting, including:
![]() Customer-facing team activity
Customer-facing team activity
![]() Views of the forecast
Views of the forecast
![]() Capacity and RBP activity
Capacity and RBP activity
Day 3—S&OP meeting and follow-up, including:
![]() Metrics of all three types: process, performance, and customer
Metrics of all three types: process, performance, and customer
![]() Achieving business results
Achieving business results
![]() Governance practices
Governance practices
The external auditors should principally be listeners throughout the three-day presentation. They are not permitted to make comments about the specific strategies or decisions being made; those are in the exclusive purview of management. The auditors are concerned only with the process of strategy development and its completeness; the process of decision making and its collaborative quality; and the actual business results achieved as proof of the process execution quality. During the afternoon of the third day, the auditors should take time to discuss their individual findings and reach consensus conclusions supported by specifics. A preliminary report without final rating and scoring should be provided to allow the team to clarify certain points the auditors may have misunderstood.
Shortly following the audit, a formal written report should be prepared by the auditors and reviewed with senior management. A formal review meeting with profit-center management would then be held. If necessary, a corrective action plan should be devised and a follow-up audit schedule roughly defined. As mentioned earlier, the final report should offer suggestions for continuous improvement and a benchmark review from top-performing companies.
Awards and Certifications
Recognition of achieving the top rating should be a priority of the CEO. A formal recognition award ceremony should be held when several profit centers of S&OP teams pass the external audit with a rating of 400 or better. The team should be recognized as Certified in Advanced Sales and Operations Planning. (The On-Point Group offers a certification when we are called upon to be the external auditors.) Having a plaque that can be seen near the CEO's office is a good way of reinforcing the recognition. Having a plaque inside the S&OP team room or profit-center headquarters is a good addition.
Moving to a market-savvy S&OP process is a journey that can take one to two years to complete. The business results should herald the accomplishment.
We also recommend annual audits of teams that have completed the process and been recognized. People change, organizations change, customers change, and the external audit conclusions may change. Thus, having an annual touchup is a good idea.
Expanding to Business Units Domestically and Globally
The most successful companies start with one profit center or S&OP team and fully implement a transition plan and final audit before moving on to add further profit centers. The first one should be selected to be a big winner. Start small, or at least with a team having enough passion and commitment to complete the transition. Once you have one good market-savvy S&OP process in actual existence, more can be added, and probably reasonably quickly.
The expansion should start with the guided participatory education and appraisal described in Chapter 5. Certainly, some education can be started before the first S&OP is totally finished.
As more and more teams are established, the need to align them will become apparent.
Alignment Across S&OP Teams Globally
The transition plan and audit plan described is for a segment-level S&OP. Next, you must move to expand to multiple segments within a profit center, to profit centers within regions, and, of course, to multiple regions leading to the total global company S&OP.
Two new processes are required in the pre-meeting activity leading to the segment level S&OP. First, you must define the import and export CFCF families, ideally the subfamilies, to be included in the RBP process. The import families may include outsourcing alternatives and alternate sources within the company overall. The export families would represent requirements placed on your capacity from another part of the company.
In practice, each capacity resource should be the responsibility of one S&OP team. The assignment of responsibility would be made based on which S&OP team buys most of the capacity. The performance to schedule, inventory, and service metrics are the joint responsibility of the two or more S&OP teams. A team that buys capacity from another team cannot simply throw up its hands and capitulate to whatever performance is achieved.
The second new process is the forecast of requirements from another S&OP team that will used in the development of the overall forecast in the full forecasting process and will be input into the S&OP and RBP cycle plans.
These two processes involved with import and export CFCF families are defined (as shown in Figure 7-3) as 3A and 8A. They do not add to the process count (the 26 horizontal processes), but they are recognized within the pre-meetings associated with those numbered processes.
There is also a third new process, defined as 20A. These are the executive S&OPs, or aggregation of S&OP into the formal management reporting structure. Segments within a profit center roll up to the profit center S&OP, and profit centers roll up in the natural form of the global reporting structure. Certainly, some time is required to accomplish the aggregation; however, the aggregation of the S&OPs should be a natural and readily accomplished task. The requirement is to keep the essential detail in view as the aggregation is accomplished.
One major advantage of using a segment-level S&OP is to preserve the opportunity to aggregate by common segments. Thus, a profit center or regional management team in Europe may have segments that are identical to those in North America and in Asia. The common segments can be aggregated to a global view of performance in the common businesses. Companies such as Goodyear can use this opportunity to roll up, say, all consumer tire businesses or all aviation businesses to a global view, even though regional management is responsible for the profit and loss performance and free cash-flow generation. The segment rollups allow for a good look at worldwide capacity utilization, comparative performance, future trends, and global product development alignment.
Process Clubs
Process clubs are gatherings of people with a passion for one or two processes. The members should come from multiple S&OP teams and global regions. Each process club is responsible for improving the analytics used in S&OP.
Process clubs deal with differences in definition of core analytical values. For example, what is an order when calculating a service performance metric? Some may think an order is one that is entered by the customer, no matter the condition. Some may think an order is one that is accepted by the company after errors in content or policy are corrected. An order for delivery last week would not normally be allowed to be entered as is and have a past-due condition from the outset. What is inventory? Where do you include in-transit between profit centers? The idea is to have metrics and analytics that can be compared across S&OP teams.
The process clubs can have productive discussions about engaging the correct people in the process, overcoming barriers to cultural change, and many other topics.
The process club program is a major continuous improvement element. Process clubs can be used to help an S&OP team move past a stalled installation by sharing experiences and approaches.
We recommend an active schedule of process club meetings at least quarterly. The advent of video conference capabilities in laptop computers has rendered the process club idea a very practical and economical program.
Chapter 7 brings us through the transition to the new culture of market-savvy S&OP. The journey is truly transformational. And, it continues as you develop a change culture that is constantly updating and realigning, primarily due to your own strategic initiatives but also as you sense the competitive forces changing and your customer's strategies changing.
Here are the major lessons of Chapter 7:
![]() A methodical transformational approach is required, not an IT system and not a wish list.
A methodical transformational approach is required, not an IT system and not a wish list.
![]() Six agents of change are included in a transition model.
Six agents of change are included in a transition model.
![]() The model provides a quick reference synopsis of the entire transition plan and strategy on one chart used by the team and senior management to enhance participation.
The model provides a quick reference synopsis of the entire transition plan and strategy on one chart used by the team and senior management to enhance participation.
![]() The major phases of each transition work step are to be shown on a transition Gantt chart: design, proof and test, educate, execute, and rollout and monitor.
The major phases of each transition work step are to be shown on a transition Gantt chart: design, proof and test, educate, execute, and rollout and monitor.
![]() A process rating and scoring technique should be used to mark progress in the development of the 26 market-savvy S&OP processes.
A process rating and scoring technique should be used to mark progress in the development of the 26 market-savvy S&OP processes.
![]() Formal quarterly audits bring the transition orchestration to points of crescendo where people stop, take note, and realign the transition work.
Formal quarterly audits bring the transition orchestration to points of crescendo where people stop, take note, and realign the transition work.
![]() A three-day external audit is used to bring the transformational journey to a satisfactory conclusion.
A three-day external audit is used to bring the transformational journey to a satisfactory conclusion.
![]() Annual external audits of one day each keep the process execution sharp and current.
Annual external audits of one day each keep the process execution sharp and current.
![]() The segment-level S&OP can be expanded to a profit center and a global process with ease, once the individual segment S&OPs are in place.
The segment-level S&OP can be expanded to a profit center and a global process with ease, once the individual segment S&OPs are in place.
![]() Process clubs are used to help individual teams move past sticking points in the transition journey and act as the vehicle of continuous improvement.
Process clubs are used to help individual teams move past sticking points in the transition journey and act as the vehicle of continuous improvement.
Case Study: Medical Technology Company
A publically held medical technology company developed and manufactured lasers for corrective eye surgery. The company was in the industry from the beginning. Along the way, it decided its products were not being adopted by eye surgery centers fast enough. As a result, the company went into competition with eye surgeons, opening and operating its own surgery centers. The plan backfired. The market began to switch loyalty to competitors with comparable products. Market share was forfeited, and cash flow turned negative.
A new management team was hired to change the downward spiral and bring the company back into profit and growth. We were hired to assist.
Situation. Cash flow was negative because of high investments in underutilized assets. The lasers had to be produced and then sent to the surgery centers, where they generated revenue only when they were actually used. The company would receive payment for each eye surgery done upon notice over the Internet directly from the machine itself.
The company was valued at the value of its cash reserve. The investors were not placing any value on the future growth or cash-flow potential of the company.
The new management team sought relief from declining market share through acquisition. A new laser technology had been developed by a small startup R&D company in the southeastern United States. The new technology solved one of the biggest complaints about complications from the standard surgery.
The manufacturing facility of the new acquisition was attached to its R&D center. Being of an R&D heritage, the culture allowed scientists to stop production for every idea germinating in their fertile brains. The company did not actually ship equipment at anywhere near the pace required to capture enough market share for comfort before competition caught on and hit the market with competing products.
Worse, the suppliers to the acquisition's manufacturing facility were the very same small R&D support shops used during product development. The suppliers were good at making one-of-a-kind subassemblies and circuit boards, but they had no capability to ramp up to production volumes with high levels of productivity and no automation to help sustain quality and repeatability.
One alternative was to move production from the acquisition's facility in the USA to the company's existing production facility in Europe. The factory in Europe had significant experience in laser manufacturing with similar manufacturing technology as in the acquisition's factory in the USA.
Actions. A cultural change process was undertaken in the European plant to develop a cross-functional management team able to handle high levels of change. The management leads of each functional area were encouraged to share leadership from month to month as a way of gaining respect for each other's particular challenges. The people in production were hired from engineering schools and technical positions. They could thus work with technical specifications of products and create standard work practices, without lengthy industrial engineering programs typical of manufacturing facilities using people who were skilled but less technically educated.
All six agents of the transition model were activated to achieve change in the European plant. The acquisition's manufacturing facility was totally resistant to change from an R&D culture to a production culture.
One of the biggest obstacles to the transition in the European facility came from U.S. manufacturing management, principally from the acquisition's management. The team in Europe was primarily female; only the quality control department was headed by a male. The gender problem actually became a major factor, much to our chagrin. The leadership box would stay red, if we were using a colored transition chart (Figure 7-1, shown in black-and-white only) until we finally had enough performance data to convince the associated leadership of the strength of the shared management approach with females in charge.
The new laser was transferred out of the U.S. plant to the European plant when the change culture in Europe was ready. New high-technology suppliers were identified and contracted to provide lower-cost components.
Business Results Achieved. Shipments of the new laser began to rise quickly. The market-share capture took place before the competition had a chance to finalize their “me-too” product offerings. Cash flow improved significantly. Based on the improved cash flow, the market valuation for the company increased.
A major strategic player became interested in the company and one day announced it wanted to buy the company for nine times its valuation when the new management team took over. The deal was struck and the shares changed hands. The acquiring company management was initially shocked to find a nearly all-female management team steaming along in a European plant with excellent performance metrics. The new management discussed needing to make an immediate “correction.” Fortunately, they did nothing for several months. The new management was pleased with the cash flow and eventually became resigned to not fixing what was not broken in Europe.
Time to Start
You may now be wondering: Where do I go from here?
1. Form a team, a cross-functional team.
2. Do the work described in the Wright Medical Technology case study at the end of Chapter 5.
3. Calculate a quantitative goal for cash-flow improvement. This is a big hairy audacious goal.
4. Begin the education.
Market-savvy S&OP will generate profound benefits for your company. The cost of not implementing is probably the loss of the entire business. Most businesses fail because they lose contact with their customers. Businesses grow when they have the cash to fund products and programs to deliver the value the customer desires.
The market-driven supply chain will become a competitive weapon. The competitors who are first to implement will have a significant competitive advantage, similar to being first to market with a new product. So take the challenge and change your culture to a customer-centric one with high growth and strong cash flow. At the end of the day, it is more fun to work in a market-savvy culture and to win.