
4
Cost Management
What is the cost baseline?
The cost baseline is the basis for the earned value reporting system. It is the budget for the estimated cost of the project spread over the time periods of the project. As we noted in Chapter 1, in managing a project we are concerned about three baselines: the schedule baseline, the cost baseline, and the scope baseline. These three baselines comprise the goals of any project and deliver to the stakeholders what was asked for, in the time predicted, and for the money that was estimated.
The cost baseline is the part of the project concerned with the amount of money that the project is predicted to cost and when that money will be used. The three baselines are closely related, and changes to one of them will result in changes to the others. If a change is made in the project scope baseline, either by adding or removing some of the work that is required, the schedule baseline and the cost baseline will probably have to be changed as well. It is foolish for managers to change the project scope without considering the effect on budgets or schedules, yet it is done to project managers all the time.
Tell me more . . .
In order to develop the cost of the project and complete our project plans, it is necessary to do a bottom-up, definitive, detailed cost estimate for all the activities of the project. The cost of all of the planned activities spread over time is the operational budget, sometimes called the performance budget.
Some care must be exercised when planning the cost baseline. Since this is the basis for our performance measurement system, we must be careful that the budget is shown on the cost baseline at the same point in time where we expect the actual cost to occur. This can be quite a problem. Suppose we show the budgeted expenditure for an item we are purchasing to be on a particular date, say April 15. To the project management planners this is the date that the project team completes the work that will make the purchase take place. In other words, the project team decides what it needs to purchase and issues a purchase requisition to the purchasing department to actually buy it. The actual expenditure, the time when the money is actually spent, the time when the company actually issues a check to the company supplying the parts to the project team, might be several months later. Because of the time delay, the actual cost will be below the budgeted cost for several months. This will, of course, have the effect of making the performance reports look better than they are. If there are many delays in the reporting of actual cost in the project, the entire project may look much better than it really is. Of course, sooner or later the actual costs are shown. Then the project performance suddenly falls.
The cost baseline is not enough money to get the project done. In addition to all the work that has been identified, we will have some other work to do that was not planned. This unplanned work is the result of risks we took. Some of the risks in the project were identified and planned for while others come as a complete surprise. We will discuss risk management in Chapter 8. Risks are just project work activities that have a probability associated with them. The probability is a measure of the likelihood that they will or will not have to be done in the course of the project. The risks that have been identified must have an estimated cost associated with them as well as a probability. Multiplied together, the result is the expected value of the risk. For example, suppose that there is a risk of 5 percent that the paint on our project will not adhere properly and we will have to strip it off and repaint. If the cost of the repair is $1,000, it would not make much sense to budget $1,000 into the project for this risk. If we did this, all of our projects would be greatly overbudgeted. While it will indeed cost $1,000 to make the repair, it is only necessary to budget the expected value, 5 percent of $1,000 or $100. If the project is painted acceptably the first time, we will have an extra $100 in our project risk budget; if it is not, we will spend the $100 and $900 more.
Since any project will have many risks, some of them will result in extra cost and work, and others will not. If our estimates for probability and impact were correct, at the end of the project the budget for these risks should end up to be equal to the total expected value of all of the risks that actually took place in the project.
This takes care of the identified risks, but what about the risks that came as a surprise and were not anticipated? These risks, the unidentified risks of the project, must be budgeted as well. Unfortunately, the budget for these risks is going to be a bit of a guess. We can only rely on our past experience with other similar projects to come up with this estimate. These budgets for unknown and unidentified risks are generally estimated very roughly as some percentage of the total project. The percentage should be quite small, however.
Where the budget for unknown risks is higher than a very small percentage of the project cost, there is a chance that the risk identification process was poorly done and that many of the risks that could have been identified were not. In this case the budget for the unknown risks is frequently inflated as a way of compensating for this lack of identification. A much better solution would be to spend more time identifying the risks that can be identified, evaluating them properly, and setting aside a small amount of budget for the unknown risks.
Why do we have two separate reserves to take care of the risks?
There are two kinds of reserves set up to budget for risks: the contingency reserve and the management reserve. The contingency reserve contains the money to do the risks that were identified. The management reserve contains the money to do the risks that were not identified. These two reserves are separated in order to have more control over how they are spent. Use of the two reserves usually requires one additional level of management approval. The normal operating budget of the project is controlled by the individual responsible for the work; the contingency budget is controlled by the person to whom that responsible individual reports. The management reserve requires one more level of approval, the person to whom the responsible person’s supervisor reports.
In normal-size projects this puts the contingency reserve under the approval of the project manager and the management reserve under the approval of the project manager’s supervisor. It should be noted that someone outside the project approves the spending of funds from the management reserve in this case.
Tell me more . . .
Our budget philosophy in project management is to allow the responsible members of the project team to manage their own activities. This means that where budgets are concerned, each person on the project team should have the budgeted cost of work scheduled, the BCWS, allocated to the activity she is responsible for. The BCWS budget can be spent by the responsible person without having to get additional approvals. The Project Management Institute has redesignated the BCWS to be called the planned value or PV. It remains to be seen whether the rest of the world will adopt this designation.
There is some danger in assigning the contingency reserve and management reserve to the same individual, however. If this is done, the reserves are tempting pockets of money that might be used to cover poor performance instead of risks that come to be.
For this reason the contingency reserve must have the approval of a manager one level above the individual responsible for the activity where the risk has occurred. This is for risks that have already been identified. When this approval takes place, money is removed from the contingency reserve and added to the operating budget, the BCWS for the activities affected by the risk. When a previously identified risk occurs, the preplanned money to take care of this risk is removed from the contingency budget and allocated to the normal operating budget. The BCWS is adjusted for the amount of money that is added to the project operating budget, and the BCWS is adjusted for the points in time when the new expenditures will occur. The budget at completion, the BAC, will also change.
The management reserve is also tempting. Since the management reserve is money available to take care of risks that have not even been identified, it is tempting for the manager to use this money improperly. Therefore, another level of authority is required for approval for using funds in the management reserve. When this approval takes place, the funds are removed from the management reserve and added to the operating budget, the BCWS for the activities affected by this risk.
Notice that since the risks are all probabilistic in nature, they are not included in the project operating budget and are not included in the BCWS for each activity. Therefore, the operating cost accounts for the project, and the budget at completion for the project does not include the reserves either.
To summarize, the operating budget or the cost baseline is equal to the budgeted cost of work scheduled and does not include the management reserve or the contingency reserve. When risks occur in the project, funds are removed from the appropriate reserve and added to the cost baseline. The total expected expenditures for the project are therefore the sum of the operating budget plus the contingency budget plus the management reserve. The amount of money that is contained in the contingency budget is the sum of the expected values of the identified risks in the project. The amount of money in the management reserve is a percentage of the project or the contingency reserve. The value of the management reserve should be quite small since money in the management reserve is relatively uncontrolled. The amount of funds put into the management reserve is a function of the amount of risk in the project. Very risky projects tend to have larger management reserves than less risky projects.
Why am I concerned with cost budgeting?
Cost budgeting or setting the cost baseline for a project is very important since it forms the foundation for the measurement of performance in the project. Ultimately our performance measurement system is going to measure the actual costs of the project in terms of time and quantity and compare that to the planned expenditures in terms of time and quantity. Any error we have in the amount of budget set aside for a particular activity in our project or the timing of that expenditure will result in over- or understating the performance of that part of the project team. If one of the tasks in the project is budgeted for $2,000 when it should have been budgeted for $1,500, the performance on this overbudgeted task will be unjustifiably high. Worse, the actual cost of the task could actually be $2,000 because work tends to fill the time allowed and spend the amount for which it was budgeted. Most managers will not take corrective action when tasks are being done within their predicted budget.
Setting of budgets also has an effect on the business itself. All companies have financial managers who must concern themselves with the timing of the expenditures of the company and making sure that there are funds available to pay the bills. Budgeting too much for a project means that excessive funds that are not required will be on hand. Not budgeting enough for the project means that funds will have to be found for the project on short notice.
Tell me more . . .
Placement of the budget in terms of the amount of money that will be spent on the individual tasks of the project as well as the timing of those expenditures is necessary for any performance measurement system to work. It is also important in helping the company manage its cash reserves so that enough, but not too much, money is available when it is required to pay bills that become due.
Any performance measurement system will be a measure of the comparison of the expected result to the actual result. In the case of projects, we are usually interested in the measurement of performance in terms of the amount of money that is being spent and the time in which it is spent. The earned value reporting system is excellent for measuring project performance but requires careful placement of the project plan in terms of quantity and timing of the planned expenditures. If the planned expenditures are not in close synchronization with the actual expenditures in terms of quantity and timing, the project will indicate a level of performance that is higher or lower than is actually the case. Suppose we have a project with a sizable amount of internal labor being used to complete many of the project tasks. We plan the expenditures for this work according to the project schedule. The project schedule shows when the work is taking place. Each person working on project tasks reports the work by task worked on and by the number of hours spent on each task. We will assume that we are doing this on a weekly basis. So, for example, Saralee works on four different tasks during the week. She works twenty hours on task one; ten hours on task two; four hours on task three, and six hours on task four. The time card she reports this on is sent into the payroll system in the accounting department and processed through the computer system. Corrections are made in the payroll system, and a report comes to the project manager one week later. At that point the time is shown as actual cost, but it is a week later than the time when the work was actually done. In addition, if the project manager finds a mistake on the report, it will take another week for the report to be corrected.
Figure 4-1 shows the overall effect of timing on cash flows. The timing of planned and actual cash flows must be the same or project status and performance reports can be misleading.
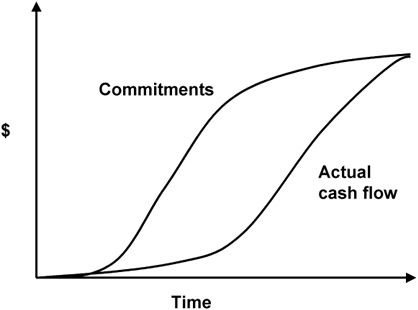
FIGURE 4-1: COMMITMENTS AND ACTUAL CASH FLOW
This problem can become worse if there have been errors in reporting from other projects or functional areas. What we mean by this is that one department or project team accidentally charges time to one of your project tasks. If you catch it at all, it is in a report that you see one week later. If you find the error and make the correction, it will be another week before the report shows it correctly. If the change requires approval of the person who made the mistake in the first place, it may take another week for the change to be made. All this makes the timing late for the actual cost to be recognized. Meanwhile the work has been done, and the completed work has been credited to the project, but the actual cost is less than it should be, and the performance is unjustifiably high for that task.
Material cost is a problem as well. Frequently the task of ordering material for a project is considered complete when the project team has finished the work.
Figure 4-2 shows that there is quite a lot of time involved between the time when the project team finishes the work of writing the requisition for materials for the project and the time when the actual cost of the expenditure is recognized. It is most convenient for the project team to recognize the completion of the work when the work of the project team is complete, but it is more accurate if the cost is recognized at the time the invoice is paid. In terms of the timing of the completion of the task, it is better to show the task as being completed when the person doing the work has completed the work.
As far as the quantity of money spent on the material is concerned, it may be better to show the expenditure when the actual invoice is paid. Final payment for items purchased usually includes the cost of inbound shipping and any other price adjustments. The shipping cost is usually not included in the original requisition but is included in the final cost of the purchase.
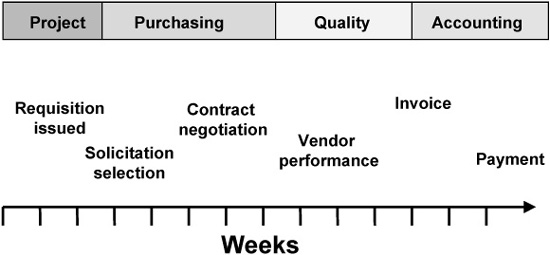
FIGURE 4-2: TIMING THE BUDGET
It is extremely important that the timing and quantity of the planned expenditures and the timing and quantity of the actual expenditures be synchronized. It is less important that they be recognized at the precise time they occur than it is that planned and actual costs be recognized at the same time. It does not matter very much if the planned and actual expenditure on any material is shown early in the project or late in the project. It does matter that the planned and actual costs be shown at the same time. If actual costs are shown later than they were planned, the project will be shown as healthy when it could be in trouble. If actual costs are shown before the planned costs, the project will appear to be in trouble when it is not.
Suppose we have a project that requires the purchase of a piece of equipment to be used exclusively for this project. This equipment has an estimated cost of $50,000. The completion of the equipment investigation and the issue of the requisition are scheduled for April 1. It takes the vendor two months to deliver the equipment. The payment for the equipment is made one month after delivery. Suppose our earned value reporting system recognizes the equipment in the plan when the project team generates the purchase requisition, but the actual cost is not recognized until the invoice is paid. Table 4-1 is an excerpt from the project’s earned value reporting system.
In this example, because of the error in timing for reporting the $50,000 expenditure, all of the cost performance index (CPI) calculations during the month of April, May, and June (through June 23) show the project having a CPI greater than 1.00. This indicates that the earned value (EV) of the total project is greater than the actual cost (AC) for the project. In reality the project’s CPI should be 1.00 for the entire time.
CPI = EV / AC
Financial managers for our company also depend on the accuracy of our estimates and the timing of our budgets. Money costs money whether we borrow it or get it from our investors. The cost of money is generally expressed in terms of the interest rate, which is just a way of stating the amount of money it costs to use money. When we use someone else’s money, we have to pay them for the use of it.
The challenge to the financial manager is to have enough money on hand to pay all the bills as they come due but not have a surplus of funds that the company is paying to have on hand but does not need. In the example above, if the project plan called for the acquisition of the $50,000 piece of equipment on April 1 and the invoice was not paid until July 1, we were holding the money unnecessarily for three months. The cost to hold the money is approximately $1,250, assuming a 10 percent annual interest rate.
50,000 × ¼ yrs × 10 % interest = $1,250
While $1,250 might not seem like a lot of money in a single purchase on a single project, if these types of errors are occurring on many projects, the cost of holding surplus funds unnecessarily adds significantly to the cost of the projects. I would not like to pay this money out of my salary. Of course the problems associated with not having enough funds to pay the bills when they become due is worse. On-time payment discounts can be lost, and interest rates to obtain money on the short term are higher.
Financial managers often learn not to trust project estimates and schedules if the project managers have a history of not making their expenditures happen when they plan them. An untrusting financial manager may anticipate budget overruns by having too much cash on hand. This raises the cost of the money needed for the project if the project follows its plan.
The lesson then is that we must have accurate predictions of when these expenditures will be made so that our financial planners can be sure to have the money on hand when the bills are due. To do this we must carefully budget our projects in terms of the amount of money and the date when it will be spent.
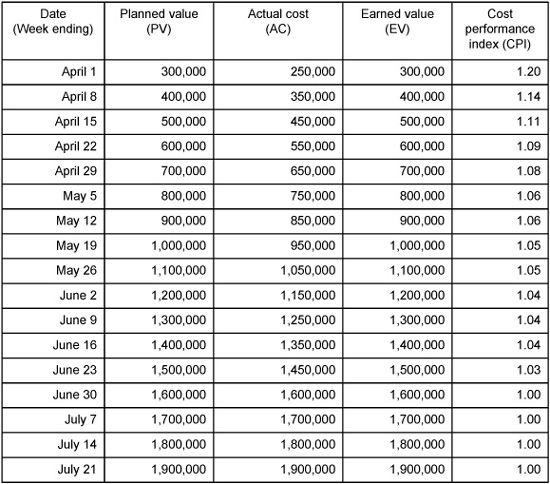
TABLE 4-1
What is the time value of money?
The time value of money refers to the fact that money we receive in the future is worth less to us than money we receive today. If you loaned us $100 today and we paid you back the $100 two years from now, it would not be fair to you because we have had the use of your money for two years and paid nothing to use it. If we borrowed your car for two years, you would expect us to compensate you for its use.
The correct thing for us to have done would have been to have paid you some amount of money for the use of your money for two years. Professional lenders, banks and others, do this all the time. The amount that they charge for the use of their money is called interest, and it is calculated from what is called the interest rate.
Besides knowing how much banks and other lenders will charge us for the use of their money, we also need to know the value of money we will receive in the future, the future value, when it is compared to money we receive today, the present value. For convenience we make the adjustment using the same interest rate.
Tell me more . . .
It is very important for project managers to understand the time value of money. Projects of almost any size have cash flows that occur in the future. Generally, the timing of these cash flows is far enough in the future that an adjustment of these cash flows to their present values is important enough to be considered.
The concept in this adjustment forms the same basis for the payment of compound interest for money that is loaned. When we lend money to someone for a period of time, we expect him to pay for the use of that money. Compound interest is just the amount of money we have at the end of a given period of time if we do not use any of the money or the interest it earns. After the first amount of interest is paid, we will earn additional interest on the interest as well as the money we started with.
We should not only be paid for the use of our money, but we should also be paid for the risk that we are taking by lending the money. There is a possibility that the person to whom we are lending the money will never pay us back. The most conservative estimate of the interest rate, the risk-free investment, is usually equivalent to the U.S. Government Treasury bill rate of interest. The U.S. Government is considered a risk-free investment since it can almost always be expected to pay its bills and is not expected to go out of business any time soon.
When we put a sum of money into a bank account, there is an interest rate associated with the account. The interest is usually called the annual interest rate. This is the amount of interest that will be paid if the money is left in the account for one year. The interest is usually compounded, which means that the interest earned is left in the account so that the next time the interest is calculated, the interest that was paid last time earns interest as well.
For example, if we had $100 that was put into a 10 percent annual interest account, it would yield $110 the first year it was left there. The second year the interest would be calculated on the $110, so at the end of two years we would have $121 and so on. The formula in Figure 4-3 calculates the future value of money if a sum of money, the present value, earns compound interest at an interest rate r for n periods. It should be noted that the value of n and r must be compatible. If the time periods are measured in years, then r must be in terms of the annual interest rate. If the value of n is in months, days, weeks, or any other time period, the interest rate r must be in terms of interest per month, day, week, and so on. Most bank interest rates are given in annual interest rates, but the interest is paid more often, monthly, quarterly, weekly, or even daily.
FIGURE 4-3: COMPOUND INTEREST:CALCULATING THE FUTURE VALUE OF MONEY
Suppose we put $10 in a bank account that pays 10 percent annual interest monthly. What amount of interest would we earn at the end of two years? Since the interest is paid each month, we must calculate it each month. If the interest is 10 percent per year, one month of interest is 10/12 percent. In the first month our $10 would earn $0.083. The second month we would calculate the interest on $10.083 instead, and we would earn $0.084 for a total of $10.167, and so on for the next twenty-two periods. We would earn $22.29 in interest.
If we take the equation for the future value of money and solve it for the present value of money, we will be able to calculate the present value of money that we will receive in the future (see Figure 4-4). This is a little more abstract. What it says is that if I receive money in the future, the value of that money to me today is going to be somewhat less. Suppose I am to receive a $10,000 payment from a customer two years from now and the interest rate that is being used to borrow money is 10 percent. The future value is $10,000, r is 10 percent and the value of n is 2 (see Figure 4-5).
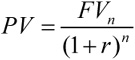
FIGURE 4-4: DISCOUNTING: CALCULATING THE PRESENT VALUE OF MONEY
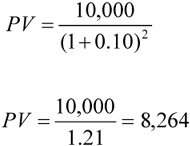
FIGURE 4-5: DISCOUNTING: CALCULATING THE PRESENT VALUE OF MONEY
Let us make one more example. Suppose we have a project that will require an investment of $1,000,000. The project has estimated cash inflows of $750,000 per year for the next three years. If we calculate the present value for these cash flows, we end up with the numbers in Figure 4-6.
In this example we have a net cash flow at the end of the third year of $1,250,000. This is a pretty good return on our million-dollar investment. The net cash flow is the sum of the inflows and the outflows.
Suppose we adjust the cash flows to their present values, as shown in Figure 4-7.
The net cash flow adjusted for net present value is only $865,100. This value is substantially less than the $1,250,000 that we had without adjusting the future values for present values. It is important to note that this adjustment is very important for anticipating the cash flows that actually occur in projects.
These adjustments are very real. Since most companies depend on borrowed money or stockholder investments for their operating funds, it is correct to assume that they have to pay something for the use of these funds. When we make an investment in a project because we expect to receive some future returns on that investment, we should adjust the money being received in the future to something less because of the time that we do not have the money. Remember that any money received in the future will be worth less than money we receive today.
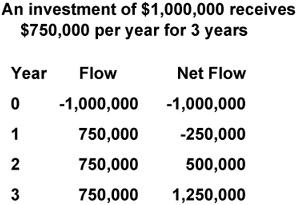
FIGURE 4-6: EXAMPLE: SIMPLE CASH FLOW
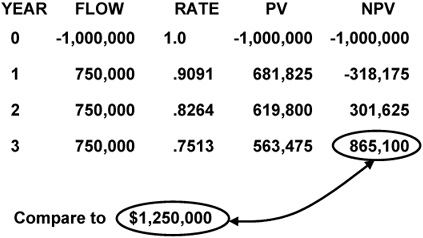
FIGURE 4-7: EXAMPLE: CASH FLOW ADJUSTED TO PRESENT VALUE
What is the fundamental accounting equation?
Project managers and project management methods are becoming more widely known, and project management successes are becoming more frequent. For this reason project managers are being given more responsibility in the businesses they work in. It has become more important that project managers treat their projects like small businesses and that they be responsible for more of the functions that were traditionally managed by others. This is because project managers are seen as being successful in what they do. Why not give them more responsibility? One of the areas where project managers need to take more responsibility is in the accounting for cost of their projects.
The fundamental accounting equation is the basis for any accounting system used in business today. These accounting systems are called double-entry accounting. This is somewhat different from the accounting system we use at home, which is single-entry accounting or cash accounting.
In a cash accounting system we make one entry for each transaction and worry about maintaining our cash balance in positive numbers. We subtract money that we spend, and we add money that we receive. As long as we maintain a positive balance, we have money in the bank and can continue to spend it. When our balance approaches zero, we have to stop spending.
In business we need to have a more accurate way of accounting for all the money and other assets and liabilities we have in our business. This brings us to the fundamental accounting equation:
Assets are the things of value that the company owns. These are things such as cash, equipment, property, land, accounts receivable, loans due from others, stock that is owned in other companies, and so forth. Liabilities are the things of value that the company owes to others. These are things like accounts payable, long-term loans, short-term loans, and so forth. Equity is the amount of value the company has after all of its liabilities are subtracted from its assets. The equity account is divided into stockholder equity and retained earnings. Retained earnings are monies that are held by the company to be used for anticipated expenditures. What is left after all of that is the stockholder’s equity.
Each of these major areas is divided up into accounts. The various accounts are referred to as asset accounts or liability or owner’s equity accounts. On the asset side we might have accounts such as cash, accounts receivable, inventory, buildings, and equipment. On the liability side we might have accounts such as accounts payable and long-term loans payable.
This equation is fundamental to all business accounting because the things called assets of the business must always be equal to the sum of the liabilities plus the owners’ equity. Whenever any change is made in the business, it is called a transaction. Each transaction causes two entries to be made in the accounting system.
Tell me more . . .
The fundamental accounting equation is the basis for all accounting in business today. Any transaction that is made in the business must have two entries in the system to keep the books balanced. If, for example, one of our customers pays us $1,000 against its account, we would have one entry to reduce the accounts receivable by $1,000 and another to increase the cash account by $1,000. These are both asset accounts so to keep the accounts balanced, we have an increase of the cash account and a decrease of the accounts receivable, and the equation remains balanced.
Let us say that we have a customer who writes us a purchase order for a new project that has a purchase price of $1,000,000. Let us further say that the project’s actual cost was $700,000 and that the money was divided as $400,000 material cost, $200,000 internal payroll cost, and $100,000 subcontract cost.
Let us start with the most pleasant part, the billing of the customer. When we send the invoice for the project to the customer, we make an entry in our own accounts receivable, an asset. The second entry cannot be a liability so it must increase equity by $1,000,000. Equity goes up, and assets go up. This is a good thing, but we are not done yet. We have to pay money to do the project.
We accumulate cost in the payroll due account as work is done. We do not pay all our employees at the end of each day, so this money accumulates until we write paychecks. We first make entries in payroll due that will eventually total $200,000. Each time we pay our employees for the work they do, we pay them from our cash account by writing them a check. When the employee works, the payroll due account must be increased. The second entry to balance the equation reduces the equity account. These are both on the right side of the accounting equation.
When the money is actually paid to the employees, a check is given to each employee for his or her pay. This money comes from the cash account, so it is reduced by the amount of the payroll check. The second entry is made to the payroll due account on the liability side of the equation, and it is reduced by the amount of the payroll check written. Once we have paid everyone, the payroll due account goes to zero.
When we buy material, the invoice is sent to us when the material is delivered. This causes an entry for the amount of the invoice to be made in the accounts payable account. This increases this account, and the second entry reduces the equity account. When the invoice is paid, it is paid from the cash account as were our payroll checks. The cash account is reduced by the amount of the check that is paid for the invoice due, and the accounts payable is reduced to show that the invoice was paid.
Subcontractor fees are paid like material cost. The hours that a subcontractor works are generally accumulated over a period of time, and the supplier submits an invoice for the amount due, which causes an entry in the accounts payable.
When this project is completed, all the accounts payable will be paid out of cash and the accounts payable will be reduced to zero for the project’s suppliers. The invoice that went to our customer will eventually be paid, the accounts receivable relevant to the project will be reduced to zero, and the cash account will be increased by the amount of the invoice to the customer. Since we have $1,000,000 coming into our cash account, and we have only $700,000 being paid out to our suppliers and staff, we have to increase our equity account. This means that our company is making a profit.
Notice that whenever a transaction is made, there are two entries that keep the equation in balance. It is not necessary to have one entry on each side of the equal sign since both positive and negative entries can be made. If a positive entry is made on the asset side, another entry, a negative entry, must be made on the asset side or a positive entry must be made on the liability-equity side of the equation. If a negative entry is made on the asset side of the equation, a positive entry must be made on the asset side, or a negative entry must be made on the liability-equity side of the equation.
What are the financial measures ROS, ROA, and EVA?
There are several measures that are useful in measuring the health of a company. These measures are also useful in measuring the health of a project. The trend in project management is to have the project manager take on more and more responsibility for the projects she is managing. Project managers in the future will be more concerned with their projects from the standpoint of managing them as small businesses. It is therefore useful for them to have some financial knowledge. Return on sales (ROS), return on assets (ROA), and economic value added (EVA) are three simple measures that a project manager can use to help determine the financial health of a project that is in progress or one that is being contemplated.
The return on sales is the ratio of net operating profit after taxes (NOPAT) compared to gross sales. The higher the ROS, the more favorable the project.
The return on assets is the ratio of net operating profit after taxes (NOPAT) compared to the gross assets needed by the project. The higher the ROA, the more favorable the project.
The economic value added is a measure of the amount of increase in the company’s assets after subtracting the cost of the capital used on the project.
Tell me more . . .
The return on sales is a relatively easy calculation to make. It is simply the net operating profit after taxes divided by the gross sales. The gross sales is the total amount of revenue that the project generates. That is the total amount of money flowing into the company as a result of doing this project. The gross sales minus all of the cost and expenses associated with the project gives us the net operating profit before taxes. Net operating profit before taxes minus the taxes paid relative to the project gives us the net operating profit after taxes (see Figure 4-8). For example,
Net Operating Profit Before Taxes = $3,000,000 − $2,500,000 =
$500,000
Taxes = $250,000
Net Operating Profit After Taxes (NOPAT) = $250,000
Return on Sales = $250,000 / $3,000,000 = 8.3%
In this example, a company does a project for a client. The client pays the company $3,000,000 to do the project. This is the gross sales of the project. The company has $2,500,000 of cost and expense associated with the project, and the company’s tax rate is 50 percent.
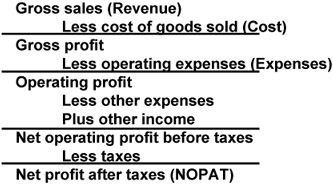
FIGURE 4-8: INCOME STATEMENT
The return on sales is a measure of the amount of profit that a dollar of sales generates. Projects that return higher profits per sales dollar are generally more favorable to the company than projects that have a lower profit per dollar of sales. The return on sales ratio tells us that some projects are relatively more profitable than others. If it is our wish to generate more profits, we should look for those projects that have higher ROS’s.
ROS is not the only financial measurement we should be interested in. Some projects use more of our assets than others. Projects that generate profits and use relatively lesser amounts of our assets than others are generally more favorable than those that have relatively lesser returns and use more of our assets. Projects that use large amounts of our assets make those assets unavailable for other projects and the profits those projects can generate.
The return on assets is the ratio of the net operating profit after taxes to the assets that are used by the project. The net operating profit after taxes is calculated just as it was in the ROS calculation. The assets that are used by the project are represented by the share of the company’s assets that are needed by the project. Much of the assets used by a project is the cash the company must use while completing the project. The share of the assets the company uses is included in this calculation of the assets used as well. In the above example, let us say that the assets this project uses are equal to $4,000,000.
NOPAT = $500,000
Assets used by the project = $4,000,000
Return on Assets = $500,000 / $4,000,000
ROA = 12.5%
The economic value added calculation compares the cost of maintaining the assets with the net operating profit after taxes. The rationale behind this calculation is that the profit generated by doing a project should be greater that the cost of the assets the project uses. Capital or assets cost money to own. Whether we owe the money to some lending institution or whether our stockholders have generated the investment money that paid for them, they still cost money.
If the money necessary to acquire assets was generated by borrowing the money from a lending institution or some other lending person or agency, we must pay for the use of the money lent. This is called interest. If the money came from people investing in our business, they expect to have some return on their investment. This is usually in the form of dividends to the stockholder. Most companies obtain assets by a combination of these means.
The first thing we need to do is estimate the percentage of the company assets that are acquired by loans. These are the short- and long-term liabilities. The difference between the total assets of the company and the total long- and short-term liabilities of the company is equal to the amount of the company assets financed by our investors and stockholders. Let us say that in our continuing example the percentage of the company’s assets that is financed through loans is 30 percent. The amount financed through investment and stockholders is therefore 70 percent. We can also find the average annual interest rate on our loans. Let us say that this is 9 percent. We can also calculate the money that we have to return to our investors each year. Let us say that this figure is 14 percent. The length of time that the project uses these assets is six months.
We can now calculate the weighted average cost of our assets in Table 4-2.
The economic value added calculation compares the cost of the assets for the time they are used by the project to the NOPAT generated by the project.
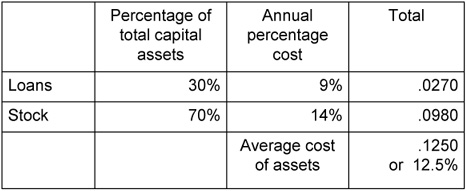
TABLE 4-2
EVA = NOPAT − (Assets Used × Average Cost of Assets × Months / 12)
EVA = $500,000 − ($4,000,000 × .125 × 0.5)
EVA = $500,000 − $250,000
EVA = $250,000
Of course, the higher the EVA, the more favorable the project will be. All companies will be happier if they are getting the most profit out of their investment. There is a problem with managing to this ratio, however. If projects are being measured according to their EVA, one way the project manager can have a good EVA is by reducing the amount of capital the project uses. This may mean using less equipment than is necessary for an efficient operation, which might, in turn, increase cost and expenses rather than decreasing them. You can always tell when a project manager is taking this calculation too seriously: He has a project team that is using out-of-date computers and is working on old desks and is always borrowing equipment from other projects.
What is depreciation?
Depreciation is important to project managers because it has an effect on the overall justification of a project, equipment, and other capital assets that are used on projects and the profitability of projects to the company. Depreciation can make a difference between a project that is justified and one that is not. It can also influence the choice of equipment that is needed for a particular project.
Depreciation is an accounting method of deferring the expense of capital asset items so that the cost of an item is spread out over the useful life of the item rather than taking the full cost of the item in the year in which it is purchased.
There are two methods of depreciation: straight-line depreciation and accelerated depreciation. Straight-line depreciation spreads the cost of the asset evenly over its useful life while accelerated depreciation takes more of the cost of the asset earlier in its life rather than later.
Tell me more . . .
If we did not have depreciation methods to account for capital assets, it would be very difficult to make any sense out of a company’s financial statements. Without depreciation methods, if a company purchased a large capital asset, it would have to recognize the cost of the asset in the year that it was purchased. Even though the asset had a life of several years, all of the cost associated with acquiring the asset would be recognized in the year it was purchased.
This recognition of all of the cost of the asset in the first year it is purchased would cause a company’s financial statements to be irregular from year to year. Investors, seeing a reduction in profits, would not be able to tell whether the company had suffered a loss in business, which is bad, or simply purchased capital assets, which is generally good. For this reason we have depreciation.
Depreciation simply says that if we buy a capital asset that has a life of some years, we should distribute the cost of the asset over the years that are equal to its useful life rather than recognizing all of the cost in the first year of its life. This will also have an effect on the taxes the company pays.
For example, say a company purchased a machine for $100,000 and the machine had a useful life of ten years. Furthermore, the machine had a scrap value of $3,000. If we did not depreciate the machine, we would have to show an expense of $100,000 in the first year. This is an expense that occurs only once in ten years so once every ten years, the company’s profits would be unusually low. For the other nine years there would be no machine expense, and the company would show an unusually high profit. A better way of accounting for this machine is to distribute the expense of the machine over the ten years of its life.
To use any of the depreciation methods, we need to know three things about the asset: the useful life of the asset, the original cost of the asset including delivery, installation, and start-up costs, and the scrap value of the asset at the end of its useful life. The depreciation expense is the amount of expense that is recorded each year during the life of the asset. This expense is the amount by which before-tax profit is reduced.
Perhaps a little accounting is in order to explain what is going on here. When a capital asset is purchased, the company pays for the asset with cash. The transaction reduces the company’s cash assets by the amount of the purchase and increases the company’s equipment assets by the same amount. There is no change in the company’s total assets; there has been a trade between the two accounts. Each year the depreciation amount for the year is calculated, and the depreciation expense reduces the net profit before taxes by the same amount. At the same time, the asset account for the equipment is reduced by the same amount.
For the following examples we will use the same asset. The asset has a purchased cost of $39,000. The purchased cost of the asset includes shipping, installation, and start-up. Installation and start-up include the initial tooling that the equipment needs to make it function. It has a useful life of eight years and a scrap value of $3,000.
Straight-line depreciation
Straight-line depreciation is the simplest method of depreciation. We start with the purchase price of the asset. From this we subtract the scrap value and divide the remaining value by the number of years of useful life.
In Figure 4-9 it can be seen that the depreciation taken each year is the same, $4,500. Each year the accumulated depreciation increases by $4,500, and the book value of the equipment is reduced by the same $4,500. The $4,500 of depreciation is taken each year until the scrap value is reached. From this point on, if the asset is still owned by the company, depreciation expense is no longer taken. If the asset were sold before the end of its useful life, the difference between the selling price and the remaining depreciation would be taken as depreciation expense in that year.
Suppose the asset were sold at the end of year four for $20,000. At the end of year four, the remaining book value is $21,000. We would take the $1,000 of depreciation expense and clear the asset from our books. If the same asset were sold for $25,000, we would show a profit of $4,000. A depreciation expense of $21,000 would be taken, $25,000 would be added to the cash account, and $4,000 would be added to the equity account as profit on the machine.
Accelerated depreciation is used because it effectively reduces taxes on the company. Although the total amount of depreciation expense taken is the same as it is in straight-line depreciation, with the accelerated depreciation method, the depreciation taken in the earlier years is significantly greater than it is in the later years. Since larger amounts of depreciation mean that the depreciation expense is larger, the net profit before taxes is going to be smaller. The taxes are figured on the net profit before taxes, so the taxes will be lower as well. Now the total amount of tax the company pays over the years is going to be the same regardless of the depreciation method, but some of the taxes will be deferred to a later time. Since the money we pay someone (the IRS in this example) later in time has less value, we will profit from accelerated depreciation.
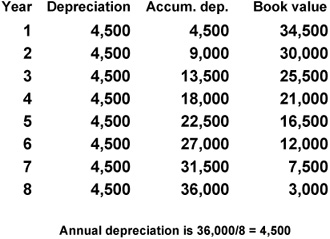
FIGURE 4-9: STRAIGHT-LINE DEPRECIATION
This may all seem a bit strange, but it is a win-win situation all around. Companies like to accelerate their depreciation because it reduces their taxes in the early years of the equipment’s life. The government likes this too because it encourages the company to sell the equipment before the end of its useful life and buy a new piece of equipment. The new piece of equipment not only makes the company more profitable and pays the government more taxes, it also makes profit for the equipment manufacturer, who in turn pays taxes on that money to the government as well.
Sum of the years’ digits
This is an accelerated depreciation method (see Figure 4-10). The depreciation for each year is calculated by first taking the digit of each year of the equipment’s useful life and adding them together.
In our example the equipment has a useful life of eight years, so we add 1+2+3+4+5+6+7+8 = 36. The first year we take ![]() of the allowable depreciation; in the second year we take
of the allowable depreciation; in the second year we take ![]() of the allowable depreciation; in the third year we take
of the allowable depreciation; in the third year we take ![]() of the allowable depreciation, and so on. Adding the numerator of the fractions we get
of the allowable depreciation, and so on. Adding the numerator of the fractions we get ![]() . That is, we have taken all of the allowable depreciation.
. That is, we have taken all of the allowable depreciation.
Notice that in the sum of the years’ digits depreciation method, we are still taking $36,000 depreciation just as we did using the straight-line method. Notice too that we still have $3,000 of scrap value. The only difference is that we have taken larger amounts of depreciation in the earlier years than we did in the later years.
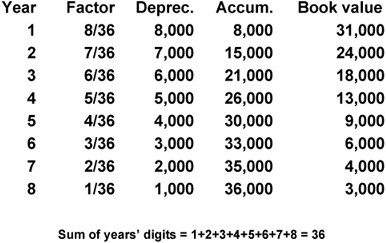
FIGURE 4-10: SUM OF THE YEARS’ DIGITS
This is another accelerated depreciation method. The first thing we do in this method is calculate the percentage of depreciation that would apply if we were using straight-line depreciation. In our example of straight-line depreciation we were taking straight-line depreciation over a period of eight years. That would be 12.5 percent each year. So, the double declining balances percentage is 25 percent. The depreciation expense for each year is taken by multiplying the remaining book value of the asset by 25 percent.
As can be seen in Figure 4-11, we start with a remaining book value of $39,000. This can be thought of as the remaining book value at the end of year zero, the time we purchased the asset. Multiplying $39,000 by 25 percent gives us the first year’s depreciation of $9,750. This $9,750 is subtracted from $39,000 to give us $29,250, which is the book value at the end of year one. $29,250 is multiplied by 25 percent to get the next year’s depreciation expense of $7,310.
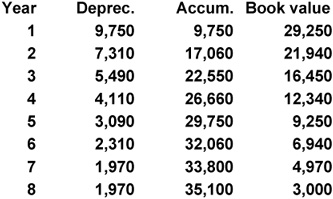
FIGURE 4-11: DOUBLE DECLINING BALANCES
The calculation is continued until the last two years of the asset’s life. For the last two years the scrap value is subtracted from the remaining book value and the difference is divided by two and used as the depreciation expense for both years.
The calculations for depreciation may seem a bit strange for engineers who are used to having things depend on natural laws of physics and other logical causes. Some accounting rules—including depreciation methods—are not subject to the laws of nature but are subject to “generally accepted accounting practices.” These are the rules of accounting that are agreed to by committees of qualified accountants. As long as everyone follows the same rules and the calculations for things like depreciation are carried out consistently, businesspeople, the IRS, and investors can all be confident that everyone is performing the same calculations in the same way.