
10
Earned Value Reporting
What is an earned value report?
An earned value report is the preferred method for measuring progress in projects. It has the advantage of showing on one piece of paper the pertinent performance criteria for a project. From the earned value report the time-phased, planned expenditures for the project can be seen along with the actual cost of the project work that was accomplished and the amount of work that was actually completed. From this report the cost variance and schedule variance can be calculated.
Tell me more . . .
There are several factors in the earned value report that we must know in order to use it effectively. These factors are the budgeted cost of work scheduled (BCWS), the budgeted cost of work performed (BCWP), and the actual cost of work performed (ACWP). These three elements form the basis for the earned value reporting system.
PMI has seen fit to change this almost universally accepted alphabet soup. It remains to be seen whether PMI will be able to persuade the entire project management community to make the change or whether PMI will have to change back to the more widely accepted way of calling things. There are certainly going to be some difficulties since most managers use PV to mean present value and EV to mean expected value. We shall see. In the year 2000 version of the Guide to the Project Management Body of Knowledge (PMBOK), PMI refers to these as follows:
budgeted cost of work scheduled (BCWS) = planned value (PV)
actual cost of work performed (ACWP) = actual cost (AC)
budgeted cost of work performed (BCWP) = earned value (EV)
We will keep the traditional terms, which are still commonly accepted.
The first one of these factors is the BCWS or PV. This stands for the budgeted cost of work scheduled or the planned value. Once you catch on, you will say that it is just what it says it is. It is a plot of the budgeted cost of the project activities on a cumulative basis over a horizontal axis of time. All project tasks have a task cost that was derived from the estimated cost of each activity and a schedule that says when the activity will take place. The BCWS is simply a plot of these values according to when in time the expenditures are expected to take place. So, this is pretty simple to see, as it is just the project plan plotted out in terms of dollars of budget showing when those dollars are expected to be spent.
This is a method of showing the project plan in an easy-to-see way on a single piece of paper. By showing it in a cumulative way we can see the total expenditures to date for the project as well as the total cost of the project all on the same piece of paper. Notice in Figure 10-1 that the shape of the curve is similar to the letter S. Nearly all of the planned value curves for projects will have this shape because projects generally start out spending money slowly and then increase the rate of expenditure, reach a peak where money is being expended at its greatest rate, and then reduce the expenditure rate until the project is ended.
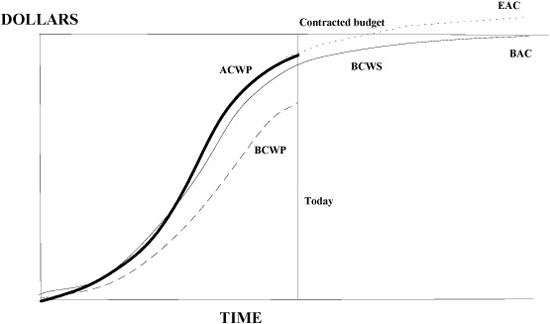
FIGURE 10-1: EARNED VALUE REPORTS
Sometimes in very large projects there is a problem with representing the project plan and the other earned value factors on a cumulative basis. When the project budget is very large, the vertical scale of the report is so small that minor but important variations cannot be seen well. In this situation a variance reporting method can be used.
To plot the earned values on a variance chart as shown in Figure 10-2, we simply plot a horizontal line and label it zero. Now, instead of plotting the actual values of the BCWS, BCWP, and ACWP we plot the differences between the BCWS and the other two earned value reporting factors. When we do this, the vertical scale that we need is greatly reduced in size since we are concerned only with plotting the difference between the earned value factors and not the entire budget of the project.
The next one, the ACWP or AC, is pretty simple too. This stands for the actual cost of work performed. Like the BCWS it is a plot over time of expenditures. This time, instead of plotting the project’s planned expenditures we are plotting the project’s real expenditures over time. At the end of each reporting period, we take the total amount of money that was spent on the project during that period and plot it as an addition to the total amount of money that had been spent as of the last reporting period.
It is important that every expenditure that is made on the project be collected and be collected in a timely way. The timing of the collection of the actual cost of work performed must match the anticipated timing of the expenditures that were planned and plotted as the BCWS. This is terribly important since, if expenditures are collected early or late in the project in relation to the project plan, the earned value report will show a positive or negative variance when there may really be none.
The ACWP plot is a cumulative plot as well. If the project expenditures are actually what they were planned to be, then the ACWP and the BCWS lines will plot one on top of the other. If the lines do not coincide, there is something different from the plan taking place in the project. We are either spending too much or too fast or we are not spending enough or fast enough to meet our plan.
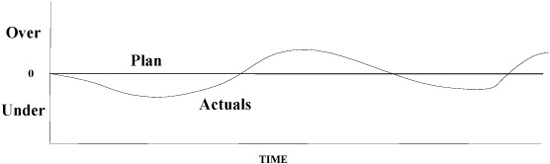
FIGURE 10-2: CUMULATIVE VARIANCE REPORTS
The next factor is the BCWP or EV. This is the only one that is a little tricky. BCWP stands for the budgeted cost of work performed. It is sometimes called the earned value as well. This is where we get the name of the earned value report. Like the BCWS and the ACWP, the BCWP is a plot of money over time. If you recall, we said earlier that each of the project tasks has a budget and schedule associated with it. The BCWP is a plot of the work that was actually accomplished. If we complete a task that had a budget of $1,000, then the BCWP for that task when it is completed is $1,000. We plot this on a cumulative basis as well. It does not matter whether we spend $1,000 or $2,000 or any other amount to accomplish this task, we earn and plot only the budgeted amount in the BCWP.
Like the ACWP, the BCWP should plot right on top of the BCWS line. If the plot of the BCWP is above or below the BCWS line, it means that the number of tasks that are being completed is greater than or less than the plan. This tells us that we are ahead of or behind schedule. If we have done all of the tasks that were supposed to be done at this point in time, the cumulative value of the BCWP will be precisely equal to the BCWS.
When we put all three of these plots together, we have the earned value report. The plots should plot right on top of one another if the project is being done on time and in accord with the budgeted amount that was in the project plan.
Example. Suppose a project is in progress and as of today the planned expenditures for the project were to have been $500,000. Suppose also that there were five tasks and the tasks had budgets of $30,000, $100,000, $250,000, $100,000, and $20,000, respectively. The actual cost of each of the tasks that were worked on was $11,000, $120,000, $230,000, $105,000, and $20,000. Tasks 1, 2, 3, and 4 are complete.
What are the BCWS, ACWP, and BCWP (PV, AC, and EV)?
BCWS is $500,000.
ACWP is $486,000.
BCWP is $480,000.
From these figures we can see that the accomplishments of the project as of today are somewhat less than what was planned for. This is the difference between the earned value and the planned value to date. The planned value is the BCWS and the earned value is the BCWP. This means that we are $20,000 behind schedule.
We can also see that the actual cost is $14,000 less than the planned expenditures to date. This means that we are somewhat under budget. Unfortunately we are $14,000 under budget but also $20,000 behind schedule. If we add the $20,000 of work that should have been completed but was not, we find ourselves projecting a $6,000 over budget condition. It could be that things are actually worse than they appear at first glance. If the performance to date continues, the amount over budget will probably be even higher at the end of the project. This is usually considered a bad situation.
What is the budget at completion?
The budget at completion (BAC) is the total operating budget allocated for the project. In the earned value reporting system, the BAC is a point that is at the end of the BCWS or PV line on the chart (see Figure 10-3). Since the BCWS line is a plot of the budget for each task in the project over time, the point at the end of the line is over the point in time when the project is scheduled to be complete and the point on the vertical axis corresponding to the end of the line is the total project budget.
Note that the BAC does not include the allowance for the contingency budget and the management reserve. As the contingency and management reserves are used, they will be removed from the reserves and added to the operating budget as needed and approved.
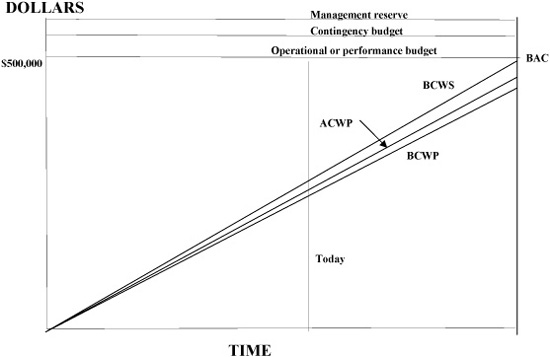
FIGURE 10-3: EARNED VALUE REPORT
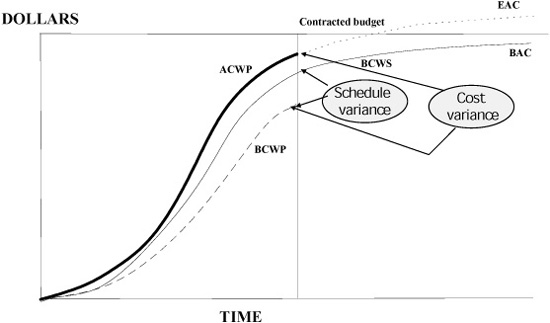
FIGURE 10-4: EARNED VALUE REPORT
What is cost variance?
Cost variance (CV) is the amount of money that was actually spent on a project or a part of a project compared to the amount of work that was actually accomplished. Cost variance is the budgeted cost of work performed minus the actual cost of work performed.
CV = BCWP − ACWP and CV = EV − AC
Tell me more . . .
In the earned value reporting system for projects, we are concerned with knowing how our project is doing with respect to the amount of money being spent and the accomplishments being achieved. The measure for this comparison is the cost variance.
To compute the cost variance, we compare the work that was actually completed to the actual amount spent to accomplish it. This means that we will be comparing the budgeted cost of work performed, the BCWP, with the actual cost of work performed, the ACWP (see Figure 10-4).
People always have trouble remembering these things. They get them mixed up and end up having a positive variance when they are really having a negative variance. It is good to remember that bad variances are always negative and good variances are always positive. If we consider that completed project tasks have an actual cost that is less than what was planned for, we could say that this is a good variance and it should have a positive value. If, on the other hand, we have spent more to accomplish our tasks than the plan allowed for, we could say that this is a bad condition and our variance will be a negative number. Of course “good” and “bad” must be qualified. Just because we have a positive cost variance does not always mean something good. If our cost variance is positive and we have left out some of the required work it would not be such a good thing. A good rule of thumb is that any variances, whether positive or negative, should be investigated.
The cost variance is an important figure to the project manager and the other managers of the company because it is an indicator of how well the project is doing in terms of spending its budget. It can be used to predict or forecast how much money it will cost to finish the project.
Example: Suppose a project is in progress and that as of today the ACWP is $190,000, the BCWP is $210,000 and the BCWS is $200,000. What is the cost variance?
Cost variance is the difference between the work that was really accomplished, the BCWP, and the cost of doing the work, the ACWP.
CV = BCWP − ACWP
CV = $210,000 − $190,000 = $20,000
What is schedule variance?
Schedule variance is the comparison of the amount of money that was planned to be spent on a project or part of a project to the amount of work that was actually accomplished.
Tell me more . . .
In the earned value reporting system for projects, we are concerned with knowing how our project is doing with respect to the actual work that was done, the BCWP, and the amount of work that was expected to be completed, the BCWS. The measure for this comparison is the schedule variance.
It may seem a bit odd that we would be measuring schedule variance in terms of dollars since most of us are used to hearing that the project is ahead or behind schedule by so many days or weeks or months. Measuring schedule variance in dollars is actually a more indicative way of showing this. If, as is often the case, we say that we are ahead of or behind schedule by three weeks, it might not be serious if there is only one person working part-time on one task over the three weeks. On the other hand, it might be quite serious if there are one hundred people working on twenty tasks and they are all behind three weeks. If a person’s time is worth $1,000 per week, the earned value report’s schedule variance for the first condition might say that the schedule variance is $1,500. The second condition would have a schedule variance of $300,000. This is quite a noticeable difference in two situations where the project is three weeks behind schedule. So, it really makes a lot of sense to consider project schedules as being ahead or behind in terms of dollars rather than weeks or months.
To compute the schedule variance, we compare the work that was actually completed to the work that was planned to be accomplished. This means that we will be comparing the budgeted cost of work performed, the BCWP or the EV to the budgeted cost of work scheduled, the BCWS or the PV.
SV = BCWP − BCWS
SV = EV − PV
As with the cost variance, people often have trouble remembering this calculation. They get them mixed up and end up having a positive variance when they are really having a negative variance. It is good to remember that bad variances are always negative and good variances are always positive. If we consider that completed project tasks are greater than what was planned, we could say that this is a good variance and it should have a positive value. If on the other hand we have accomplished fewer tasks than the plan allowed for, we could say that this is a bad condition and our variance will be a negative number.
The schedule variance is an important figure for the project manager and the other managers of the company because it is an indicator of how well the project is doing in terms of following the project schedule. It can be used to predict or forecast how much time it will take to finish the project.
Example: Suppose a project is in progress and that as of today the ACWP is $190,000, the BCWP is $210,000, and the BCWS is $200,000.
Schedule variance is the difference between the work that was really accomplished, the BCWP, and the planned work that was supposed to be accomplished, the BCWS.
SV = BCWP − BCWS
SV = $210,000 − $200,000 = $10,000
What is the cost performance index?
The cost performance index or CPI is a measure of how well the project is doing in terms of spending the project budget. It is a comparison of the actual expenditures to the work that was accomplished. The index is a value that allows projects of different sizes to be compared.
Tell me more . . .
The cost performance index is like the cost variance discussed previously with one important difference. When we calculated the cost variance, the result was a figure in dollars. If the dollars were a negative number, the variance was considered bad, and if the dollars were positive, the variance was considered good. The problem with this method is that it is difficult to compare projects of different sizes to one another. It would be better to have a measure that gave the health of the project regardless of its size. For this purpose we will use indexes.
Instead of subtracting the actual cost of work performed from the budgeted cost of work performed as we did when we calculated the cost variance, we will divide the same two numbers.
CPI = BCWP / ACWP
CPI = EV / AC
We can see that if the project is following its plan, the amount of work accomplished and the amount of money spent to accomplish it are the same, and the resulting value will be one. So, an index of one means that the project is following its project plan.
If the actual cost is greater than what is being accomplished, the denominator in the fraction will be larger than the numerator, and the resulting value will be less than one. This is generally considered to be a bad condition. If the actual cost is less than what is being accomplished, the resulting number will be greater than one and this is considered to be good. Of course any deviation from the project plan is bad even if the deviation is considered favorable. We should investigate to determine why this condition exists.
Example: Two projects have their cost performance index calculated. Both projects are 10 percent over budget at the time of the calculation. Project One has a budget of $1,000,000, and Project Two has a budget of $10,000. These budget figures are the amounts that should have been spent as of today’s date. We will assume that the project is on schedule at this point in time. What is the cost performance index for each?
Project One is over budget by 10 percent of its budget or $100,000.
Project Two is also over budget by 10 percent of its budget or $1,000.
CPI = BCWP / ACWP
The BCWP is $1,000,000 for Project One.
The ACWP is $1,100,000 for Project One ($1,000,000 + $100,000).
The BCWP is $10,000 for Project Two.
The ACWP is $11,000 for Project Two ($10,000 + $1,000).
CV = BCWP − ACWP
The cost variance for Project One is $1,000,000 − $1,100,000 or − $100,000.
The cost variance for Project Two is $10,000 − $11,000 or − $1,000.
The CPI for Project One is $1,000,000 / $1,100,000 or 0.909.
The CPI for Project Two is $10,000 / $11,000 or 0.909.
Notice that the size of the project does not make any difference in the calculation of the index. Projects that are each behind 10 percent have the same value for their cost performance index. This makes assessing the health or sickness of projects of different sizes much easier.
What is the schedule performance index?
The schedule performance index is a measure of how well the project is doing in terms of following the project schedule. It is a comparison of the project tasks that were planned to be accomplished to the work that was really accomplished. The index is a value that allows projects of different sizes to be compared.
Tell me more . . .
The schedule performance index is like the schedule variance discussed previously with one important difference. When we calculated the schedule variance, the result was a figure in dollars. If the dollars were negative, the variance was considered bad, and if the dollars were positive, the variance was considered good. The problem with this method is that it is difficult to compare projects of different size to one another. It would be better to have a measure that gives the health of the project regardless of its size. For this purpose we will use indexes.
Instead of subtracting the budgeted cost of work scheduled from the budgeted cost of work performed, as we did when we calculated the schedule variance, we will divide the same two numbers.
SPI = BCWP / BCWS
SPI = EV / PV
We can see that if the project is following its plan, the amount of work accomplished and the amount of money spent to accomplish it are the same, and the resulting value will be one. So, an index of one means that the project is following its plan.
If the budgeted cost of work scheduled is greater than what is being accomplished, the denominator in the fraction will be larger than the numerator, and the resulting value will be less than one. This is a bad condition. If the budgeted cost of work scheduled is less than what is being accomplished, the resulting number will be greater than one and this is considered good.
Example: A project is two weeks behind schedule at the time of the calculation. The project has fifteen people working full-time. Assume that each person costs $1,000 per week. BCWS at this point in the project is $500,000. What is the schedule performance index?
The project is two weeks behind schedule and there are fifteen people working full-time on the project. This results in being behind schedule by thirty person-weeks or $30,000.
SPI = BCWP / BCWS
The BCWP is $500,000 − $30,000 = $470,000.
The BCWS is $500,000.
SV = BCWP − BCWS = − $30,000
SPI = BCWP / BCWS = $470,000 / $500,000 = 0.940
Notice that a smaller project such as one that had a BCWS of $50,000 and a BCWP of $47,000 would also have a schedule performance index of 0.940. Again, this helps the project manager who is managing different parts of a project in which the sizes of the parts are different. The schedule performance index, like the cost performance index, indicates the health of the project regardless of its size.
What is the estimate at completion?
The estimate at completion, frequently shown as the EAC, is the forecast value of the project when the project is complete. It should be noted that the EAC can be calculated in a number of different ways and is only an indicator of what the project’s cost will be at the end of the project.
Tell me more . . .
The estimate at completion is a value that can get project managers in trouble. In its most commonly used form it is the budget at completion divided by the cost performance index.
EAC = BAC / CPI or EAC = (BAC × ACWP) / BCWP
This is a rather pessimistic estimate of the amount of money that will be spent at project completion. It says that the things that have gone wrong in the project until now will continue to go wrong, and we will not learn how to improve them between now and the end of the project. There are many reasons why this is true. There could be bias in our estimates. If the early items in the project were underestimated, it is likely that the later items in the project will be underestimated as well. If there is a chronic problem that has been evident in the early part of the project and the same people and equipment will be used on the later project activities, then the EAC will probably be accurate by this method. On the other hand, if different estimators and team members or different pieces of equipment are being used later in the project, the EAC may not indicate the project’s true estimated cost at the end.
Unfortunately, as we will see, much of the research that has been done in this area indicates that projects that are over budget when they are 25 percent complete are very likely to finish over budget. Not only that, but these projects are likely to finish with a worse cost performance index than they had when they were 25 percent complete.
Are there other ways of calculating the EAC?
Yes there are, but they are not used as widely as the calculation described above, EAC = BAC / CPI.
Tell me more . . .
Taking the actual cost of work performed and adding it to the remaining work to be done can describe a somewhat more optimistic view of the EAC. This says that the project’s estimate at completion will be the sum of the remaining work to be done at the originally estimated budgets for that work plus the actual accumulated cost of the work already completed. The actual cost of the work already completed is nothing more than the ACWP, and the cost of the remaining work to be done, based on original estimates, is just the difference between the budget at completion and the work that is already completed.
EAC = ACWP + (BAC − BCWP)
Of course, the most optimistic calculation of the EAC is the one that is usually imposed on project managers. It says that in spite of the problems that have occurred on this project to date, the project is not only going to complete all the remaining tasks according to the original plans and estimates but is going to recover the budget overruns already spent. The calculation of EAC is quite simple.
EAC = BAC
While it may seem pessimistic to calculate the EAC by dividing the BAC by the CPI, it turns out that there have been a number of studies that have been done in this area.
Quentin Fleming states: “The cumulative CPI is a particularly reliable index to watch because it has been proven to be an accurate and reliable forecasting device. The cumulative CPI has been shown to be stable from as early as 15 to 20 percent in the project’s percentage complete point.”1
From David Christensen: “Researchers found that the cumulative CPI does not change by more than ten percent once a contract is twenty percent complete; in most cases, the cumulative CPI only worsens as a contract proceeds to completion.”2
What this is telling us is that the project managers who report that although bad things have happened early in the project, they expect to recover and finish the project within the originally planned budget are not very realistic. Unless they have good reason to defend this position, it should be accepted very reluctantly. The more probable outcome of the project is that the CPI will remain the same or get worse as the project progresses.
It is even rational to think this way. If a project cannot follow the project plan early in the project when the tasks planned were relatively close to the time the planning was done, then how likely is it that the tasks that were planned further in the future will have been estimated more accurately?
What is the to complete cost performance index?
The to complete cost performance index, TCCPI, tells us the required cost performance that is necessary to complete the project for the original budget based on the performance of the project as of today.
Tell me more . . .
The to complete cost performance index is a seldom-used indicator, and there are some difficulties in its use. The TCCPI is calculated by dividing the work remaining by the money remaining in the budget to do it. The remaining work in a project is simply the difference between the work already accomplished, the BCWP, and the total work of the project, the BAC. You will recall that when the project is completed, the BCWP must exactly equal the BAC. Mathematically it is impossible for this not to happen since the BAC is equal to the sum of the BCWP and is also equal to the sum of the BCWS. The remaining budget for the project is simply the difference between the total budget for the project, again the BAC, and the amount of money that has been spent to date, the ACWP.
TCCPI = (BAC − BCWP) / (BAC − ACWP)
It can be seen that as a project’s cost performance index moves below one, the TCCPI will increase and become greater than 1. Although called an “index,” this is not really accurate since all indexes indicate something bad when they fall below one and this index indicates something bad when it is greater than one.
The TCCPI gives us a rough estimate of the performance that is required for the remaining portion of the project in order for the project to be completed for the original budget. A TCCPI of 1.33 indicates that the project team must perform with a CPI of 1.33 from now until the project is completed in order for the project to be completed at the original budget.
There is a mathematical difficulty with this term as well. If a project is over budget toward the end of the project, it is possible for the BAC and the ACWP to be equal. This produces a division by zero and a point of discontinuity.
Under normal conditions it results in a value that indicates the required performance that the project must have from now until the end of the project.
Example: Suppose a project is somewhere near 50 percent complete:
BCWS = $100,000
BCWP = $95,000
ACWP = $97,000
BAC = $200,000
CV = BCWP − ACWP
CV = $ − 2,000
What is the TCCPI?
TCCPI = (BAC − BCWP) / (BAC − ACWP)
TCCPI = (200,000 − 95,000) / (200,000 − 97,000)
TCCPI = 1.02
In this example the project would be required to do all of the remaining work at a 2 percent higher cost performance than was originally planned. This may be particularly difficult since the cost performance index to date is only 98 percent. We will be asking the project team to improve their cost performance by some 4 percent.
Notice that if the cost variance remains the same as the end of the project approaches, the TCCPI increases rapidly. Suppose we have the following when the project is approximately 95 percent complete:
BCWS = $195,000
BCWP = $190,000
ACWP = $192,000
BAC = $200,000
CV = BCWP − ACWP
CV = − $2,000
What is the TCCPI?
TCCPI = (BAC − BCWP) / (BAC − ACWP)
TCCPI = (200,000 − 190,000) / (200,000 − 192,000)
TCCPI = 1.25
As we approach the end of the project, the cost variance has not changed, but the TCCPI has changed from 1.02 to 1.25. This is an indicator that the cost variance will be much more difficult to recover now than it was earlier in the project.
Is there a similar measure to the TCCPI for schedules?
Yes, there is a calculation called the to complete schedule performance index, the TCSPI. It is similar to the TCCPI except that it calculates a required schedule performance index that will be necessary to meet the project schedule. This measure is rarely used. It is included here for completeness. It has the same problems as the TCCPI and is even more abstract and difficult for people to understand.
Tell me more . . .
The calculation for the TCSPI is done by dividing the work remaining by the remaining schedule.
TCSPI = (BAC − BCWP) / (BAC − BCWS)
It can be seen that as a project’s schedule performance index moves below one, the TCSPI will increase and become greater than one. Although called an “index,” this is not really accurate since all indexes indicate something bad when they fall below one and this index indicates something bad when it is greater than one.
There is a mathematical difficulty with this term as well. If a project is over budget toward the end, it is possible for the BAC and the BCWS to be equal. This produces a division by zero and a point of discontinuity.
Under normal conditions it results in a value that indicates the required performance that the project must have from now until the end of the project.
Example: Suppose a project is somewhere near 50 percent complete:
BCWS = $100,000
BCWP = $95,000
ACWP = $97,000
BAC = $200,000
SV = BCWP − BCWS
SV = − $5,000
What is the TCSPI?
TCSPI = (BAC − BCWP) / (BAC − BCWS)
TCSPI = (200,000 − 95,000) / (200,000 − 100,000)
TCSPI = 1.05
Notice that if the schedule variance remains the same as the end of the project approaches, the TCSPI increases rapidly. Suppose we have the following when the project is approximately 95 percent complete:
BCWS = $195,000
BCWP = $190,000
ACWP = $192,000
BAC = $200,000
SV = BCWP − BCWS
SV = − $5,000
What is the TCSPI?
TCSPI = (BAC − BCWP) / (BAC − BCWS)
TCSPI = (200,000 − 190,000) / (200,000 − 195,000)
TCSPI = 2.00
As we approach the end of the project, the schedule variance has not changed, but the TCSPI has changed from 1.05 to 2.00. This means that the work that must be accomplished from now to the end of the project must take place at a rate that is twice as fast as was originally planned.
What is the estimate to completion?
The estimate to completion or the ETC is an estimate of the additional money that will be necessary to complete the project. It is calculated from the estimate at completion that we discussed previously.
ETC = EAC − ACWP
Can you get into trouble with estimates at completion? You bet you can. As we have seen in the discussion of the EAC, there are many ways that this estimate can be made. The most common form is the budget at completion divided by the cost performance index. This is only a rough estimate of what the project will cost when it is completed.
Tell me more . . .
Using the estimate at completion predicts that the project will overrun or underrun its budget at the end of the project. While it is a good thing to keep the stakeholders and the managers of your company informed that projects are in trouble, it is a weak support for asking that the project be given additional budget. A good project manager who wants to keep his job will take the EAC and use it as additional supporting information to show that the project budget was originally over- or understated. In addition to the EAC, the project manager should have much supporting information as to why the project is in the condition that it is in.
What is the percent complete?
Percent complete is a simple calculation. It is simply the amount of work that has been completed divided by the budget at completion.
% complete = BCWP / BAC
Notice that the percent complete can never be greater than 100. This is because the BAC is the sum of the budget in the project. The individual values of the budgets in each of the project’s activities, the BCWS, are the same as the individual BCWP for each activity. Since the only difference between the BCWS and The BCWP for an activity is whether or not the activity has been completed, at the end of the project the sum of all of the budgets must equal the sum of all the BCWP. If an activity has not claimed its BCWP, the project is not yet completed. As soon as all of the activities in the project have claimed their BCWP, the project is said to be completed.
What is the percent spent?
Percent spent is another simple calculation. It is the amount of the budget that has been spent. It is calculated by dividing the actual cost of work performed by the budget at completion.
% spent = ACWP / BAC
Notes
1. Quentin Fleming and Joel Koppelman, Earned Value Project Management (Newtown Square, Pa.: Project Management Institute, 1996), p. 106.
2. Ibid.