
CHAPTER 6
RENTAL INCOME
Cash Flow Essentials
Many forms of real estate analysis are aimed at a study of the overall market and the supply and demand factors in specific cities and towns. This is a starting point in the decision to invest in real estate, whether for speculative purposes or as part of a long-term strategy. However, when investors make their decisions to buy and hold, they also need to be able to analyze the health of a property’s cash flow, the demand for rentals, and market rent rates. The trends in these areas—as is true of all cyclical investing—do not remain the same forever.
THE BASIC CASH FLOW EQUATION
Cash flow is the key element to analyze in real estate. The basic cash flow equation is most accurately based on calculating the after-tax net difference between revenue and payments. However, the equation should not be limited to the study of cash inflow and outflow. While this is critical, it needs to be reviewed carefully in light of how the investment itself is performing. For example, if your cash-on-cash return (net cash flow as a percentage of your down payment) is only 1 percent per year, is it worth it to continue holding the property?
The answer to this question depends on your estimate of how the property’s market value is changing. If values are not growing (or if they are falling), then a 1 percent return on your down payment is not adequate. If you could make three times as much in a certificate of deposit (without the work required to maintain property, deal with tenants, and manage cash flow while carrying a significant debt load), it is valid to ask: Is it worth the aggravation to keep the property? In fact, in comparing risks and profit potential between dissimilar properties, the time commitment, debt service, and aggravation (collectively, your risk tolerance) should be a key factor in deciding whether to keep a property for the long term or sell it and invest your capital in a certificate of deposit or a mutual fund or stock that pays a good dividend.
Cash flow is invariably at the center of this decision. Most real estate investors accept the premise that well-chosen real estate will grow in value over time. You also accumulate equity as you gradually pay down a mortgage loan. However, you also need to be able to afford to hold onto the property. If your cash payments exceed your annual income, the investment will be a strain on your personal budget and may even reduce your ability to invest capital in other markets. A related factor is the double effect of taxes and inflation. Later in this chapter, you will find a variation on the concept of breakeven—the net return you need from an investment to cover taxes and inflation as a factor in the comparative analysis of investments.
Even those investors who can afford limited negative cash flow should be convinced that (1) the negative situation is temporary, (2) it is caused by market conditions that are going to change in the future, and (3) market values are growing at a faster rate than the after-tax negative outflow. These issues become the key questions for investors who are not meeting their basic cash flow requirements.
1.Is the situation temporary? Because predictions of the future are unreliable, it may be impossible to identify exactly how temporary a slow market is, in perspective. For example, if today’s market is overbuilt with rental units, you may not be able to ensure positive cash flow. How long will this situation continue? That depends on building trends, available financing, employment and demographic trends in the area, and other economic factors. Real estate investors face a dilemma when contending with negative cash flow.
2.How are market conditions going to change in the near future? Just as it is impossible to know whether a soft market is temporary (or how long it will take to turn around), it is equally impossible to identify all of the causes of the condition. Thus, identifying how things will change in the future is just as elusive. If you listen to experts, predictions are a popular sport. Whether in real estate, stocks, or the gold market, it is easy to find someone who predicts better times ahead. But how do you quantify these predictions?
3.Is growth in market value exceeding negative cash flow? The most important question to ask when facing negative cash flow is whether you can afford to keep the property. The condition may be caused by vacancies or simply by market rents falling too low to cover the mortgage payment and other obligations. For example, if you purchased a property for $150,000 and you estimate that its value is growing at an average of 5 percent per year ($7,500), is that adequate to allow you to keep the property? If after-tax cash flow is negative by $8,000 per year, you are losing money. Even if your estimate of growth in market value marginally offsets negative cash flow, questions remain: Is your estimate accurate? How long can you afford to continue paying out more than you receive? Given the current market conditions, should you sell the property?
To judge the long-term prospects for rental property, it helps to find indicators that demonstrate a trend. If the trend is positive, you may want to wait out the market; if the trend is negative, it may be better to sell and cut your losses. Some indicators, such as a study of the trends in occupancy rates, will help in making this decision.
OCCUPANCY AND VACANCY RATES
Analysis of how strongly a rental property performs is the best indicator of the market. In studying supply and demand, you need to make a distinction between the property market and the rental market. The property market is the demand for property itself, matched against the available supply. You will judge this market primarily through the market value of property. The rental market is a reflection of market rents and how they change, and of levels of occupancy for available units. Trends are all-important in both of these markets, of course. Once investors become landlords, their interest in the rental market may become a priority because cash flow has to work in order for the investment itself to work. Three key trends to watch are:
1.The trend in the property market in comparison to cash flow. Are property values rising? The typical investor is initially concerned with this question and is most likely to risk capital only if and when the signs point to strong potential for profits in this market. There would be little incentive to buy property if market trends were soft, and the investor could only hope that future values would catch up or that supply and demand cycles would become strong. Some speculators will buy properties in soft markets if they can get deep discounts, but for typical investors, the preferred method of picking properties is to find strong markets.
The trend in the property market can also be studied objectively in the context of cash flow. The return on an investment cannot be measured looking at only a part of the whole picture. For example, stock investors look for growth in stock prices and dividends. Real estate investors usually seek properties that are in strong cyclical markets and have positive cash flow. Because investors like to make comparisons, the combined growth in market value and current cash flow has to be considered to make real estate a strong choice today. If the estimated profit is marginal, why risk capital? Because real estate investments are highly leveraged (requiring a large amount of debt), the risks are considerable. Those risks are justified only when the potential return makes the decision worthwhile.
2.Trends in market rates for rents, compared with operating expenses and debt service. Investors need to know that market rates for rents are going to be high enough to cover operating expenses and debt service. This is not always the case. Rents in some markets cannot support property acquisitions, given typical down-payment levels. In markets where property values are exceptionally high, it may prove quite difficult to make the numbers work. Even though rents tend to be higher in those markets than elsewhere, this does not mean that cash flow will work well.
For example, the residential rental markets in New York City, San Francisco, and Seattle would be very difficult to enter as a first-time investor. Property values are far higher than the national averages. Housing prices may be three to four times higher than the prices of similar properties in the Midwest or in suburban areas. However, market rents may only be two to three times higher than market rents elsewhere. In this situation, investors will have to accept negative cash flow or come up with a higher down payment in order to reduce debt service demands. For most first-time investors, both of these alternatives will be impractical.
3.Changes over time in occupancy rates. The trend in the local market that most investors watch continually is the trend in occupancy rates. The occupancy rate is the percentage of rentals that are actively rented out. In very strong markets, occupancy may be as high as 98 percent over many months or years. However, that high rate may attract developers; high occupancy means better cash flow, so developers may see this market condition as an opportunity. As a consequence, many more units may be built, and the area may end up with an excess of supply. Given the way the supply and demand cycle works, this causes a softer rental market. Because there now is more supply than demand, occupancy rates tend to fall. So the rental demand cycle is defined in terms of occupancy, and the trends can be observed by following the local occupancy trend.
•Formula: Occupancy Rate
O ÷ T = R
where:
O |
= occupied units |
T |
= total units |
R |
= occupancy rate |
•Excel Program: Occupancy Rate
A1: |
occupied units |
B1: |
total units |
C1: |
=SUM(A1/B1) |
Occupancy can be evaluated on the basis of total units, rooms, or square feet. The appropriate method depends on the type of property. If you are dealing with single-family houses as investment properties, the number of units is the most common and widely used method.
In evaluating local trends, the occupancy rate reflects the conditions in the immediate area. It should not be applied to individual holdings of single-family housing in most instances. However, owners of apartment complexes may apply occupancy rates to judge the market for their particular complex or in comparison to the local market as a whole.
A related trend is the vacancy rate. This measures the same trend as occupancy rate, but it counts the number of vacancies instead. There is no particular advantage to using one basis for analysis over the other; both provide information about the same trend. However, a subtle distinction may be observed (again depending on the type of property) with vacancy rate. It may be expressed in terms of number of units, time, or revenue. For example, a three-month vacancy would represent 25 percent of the total year. However, like occupancy rates, vacancy rate analysis usually reflects the trend based on the number of units.
•Formula: Vacancy Rate
V ÷ T = R
where:
V |
= vacant units |
T |
= total units |
R |
= vacancy rate |
•Excel Program: Vacancy Rate
A1: |
vacant units |
B1: |
total units |
C1: |
= SUM(A1/B1) |
FIGURING RENTAL PROPERTY VALUES COMPARATIVELY
Investors normally think of value as the market price of property. A house that 10 years ago was worth $75,000 and today is worth $150,000 has doubled in value. This is a reliable and consistent method for overall market evaluation. However, the value of investment property may also be computed in other ways, designed to provide comparative success in cash flow levels or to determine why and how cash flow varies from one property to another.
For example, an investor may buy two very similar properties in one city. One of the properties produces consistently positive cash flow while the other is chronically in the red. Why does this occur? Studying property-market value reveals nothing about the rental market. While property and rental markets may tend to move in the same direction, aberrations have to be examined and explained by looking at factors beyond market value.
The types of analyses that look beyond obvious market value are especially useful in the analysis of multiunit investments. A small apartment building (one with between 5 and 20 units, for example) may be difficult to compare to other buildings solely on the basis of market value. In some situations, dissimilar cash flow outcomes may be better understood when analysis is performed on the basis of value per unit or value per square foot.
By determining the value per unit for two or more multiunit residential projects, you will be able to develop a means for comparison. When you are considering purchasing multiunit income property, it is likely to be appraised using the income approach. While this provides a useful method for comparing and setting value, judging the efficiency of cash flow can be more difficult. For example, you may be considering making an offer on several small apartment buildings. All have different numbers of units and different levels of operating income. It may be very difficult to determine which provides the best cash flow because (1) the asked prices are not the same, (2) total rents, operating expenses, and net operating profit are also different, and (3) mortgage levels and debt service will also vary, depending on which building you select.
In this case, the value per unit provides a dependable means for determining how the numbers break down on a basis that can be reviewed consistently. The value in this case means cost in most circumstances; however, the per-unit evaluation may also be performed on the basis of total rents, reported net operating income, or mortgage debt. Any of the financial data may be judged in terms of their relative feasibility when the per-unit method is used. While this may not be entirely definitive (because units with different styles, locations, and sizes may command different market rents), it does provide you with a way to make comparisons that can be quantified in terms of cash flow health. Remembering that the per-unit formula works for a variety of different factors, the value per unit works as the basic formula.
•Formula: Value per Unit
C ÷ U = V
where:
C |
= total cost or asked price |
U |
= number of units |
V |
= value per unit |
•Excel Program: Value per Unit
A1: |
total cost or asked price |
B1: |
number of units |
C1: |
=SUM(A1/B1) |
For example, suppose you have located three small apartment buildings and you want to analyze their cash flows. However, because the values of the three buildings are dissimilar, you use the value-per-unit formula to make your comparison. This is shown in Table 6.1.
The first two buildings are very similar; the value (or, for a potential buyer, the cost) per unit is close. However, property number 3 is far higher on a per-unit basis. For the owner, this is a positive sign regarding cash flow. However, from the buyer’s perspective, this represents a far higher cost. So using these data, you can calculate the cost per unit to determine how much a property should cost when compared to other properties. This is a variation on the income approach to appraisal, which is based on gross rents in most applications. In the cost-per-unit evaluation, you do not directly consider gross rents or operating income. You are interested only in deciding whether a property’s price is reasonable when compared to the cost of other properties.
Table 6.1: Apartment Value per Unit

These types of comparative data are instructive in your analysis of property. Is it feasible to purchase a property based on its value per unit? How does the unit cost compare to other, similar properties? This analysis is not the same as appraisal analysis, in which questions like age, size, and condition become important. It is strictly a comparison between properties without going into valuation questions based on economic condition and attributes.
The purpose of this calculation is not so much to set a cost per unit as it is to make an estimated value judgment. For example, the owner of an apartment building may use the cost-per-unit calculation to estimate the value of the building. This is useful information to have in hand to compare to what the appraiser believes. If the appraiser uses the income approach, the appraised value will be based on gross rents, so the level of gross rents that a building can support ultimately has more to do with market value than the cost on a per-unit breakdown. So from a potential buyer’s point of view, the calculation may be useful in deciding whether to proceed with the purchasing process, even without an appraisal in hand.
Returning to the previous example, you may conclude that the average value per unit (based on an analysis of the first two buildings) should be approximately $15,000. You can use this information to make a judgment concerning the third building. Applying the formula:
$360,000 ÷ 24 = $15,000
You may conclude that, based on a comparison between this building and other apartment buildings in the area, the building should be valued at $360,000. If nothing else, this raises another question: Why is it being sold for $420,000? Some possible explanations will be found in the appraiser’s report and may include higher-than-average rents because of the units’ sizes, conditions, age, or location. If rents are higher, then the gross rent multiplier (GRM) will be higher as well.
You may interpret this information in several ways. A higher rent level may represent more efficiency in cash flow and a higher net operating income. It may also represent greater vulnerability if and when market demand falls. For example, if a large portion of the local rental market is made up of college students, several factors will influence rental rates. The higher rent levels may be due to the building’s proximity to the main campus, for example. The units may be relatively new compared to those in other buildings; this translates into lower operating costs, but that could change within a few years as a maintenance cycle creates higher operating expenses.
The calculations for value per unit and for cost per unit can be valuable to the prospective buyer because both calculations give you comparisons. The explanations of the variations between buildings might lead to the conclusion that, in fact, the price differences are realistic, given other factors. Or the analysis may provide evidence that a particular building is simply overpriced compared to other properties. When you are looking at cash flow as a means for comparing valuation, it helps to study value and cost on a per-unit basis.
A similar analysis can be performed on a square-foot basis, and this may work in many types of property evaluations. While the value and cost per unit are applicable to multiunit residential properties, the value per square foot and cost per square foot can be used for virtually any type of property. For example, if you are thinking of starting out with single-family houses, you may decide to study the asked prices of several properties on the basis of condition, age, the neighborhood, and many other standards, and by comparing the value and cost per square foot. Buyers tend to develop opinions about properties on the basis of size, but without actually studying the size-versus-price issue in detail. So when you look at two properties, both selling for $150,000, you need to compare them on some basis. If one has 2,100 square feet and the other has 2,500 square feet, you may tend to believe that the larger home represents a better value.
With this obvious conclusion in mind, you will recognize that analysis on the basis of square feet should serve as a means of comparison, not as the sole means of picking properties. When you see divergence in the value or cost per square foot, you may want to try to identify the underlying reasons. One property may be in need of expensive repairs while another is not. The age, condition, and location of properties may be more important criteria for selection of an investment property; the square-foot analysis may highlight the need to investigate further.
Some investors simply depend on appraisal value, notably those employing the income approach, to determine the ultimate valuation of investment properties. Others will want to go into substantial detail in evaluating the cost and value of properties based on unit cost, square footage, and similar analyses. A prudent course is most likely to be found somewhere in between these two methods.
While you and your lender depend heavily on professional appraisers and their opinions, some additional elements are likely to affect overall valuation from a landlord’s point of view, and some of those features may not even be considered in the appraisal. So your own analysis of a property’s features may be useful in picking one property over another. On the other extreme, performing endless tests and employing details down to unit size may be misleading and can cloud judgment. When all is said and done, the ultimate test of investment property comes down to rental rates, demand, and cash flow. It is unlikely that, given similar or identical appraisal values, there will be much difference in market rents between a 400-square-foot unit and a 450-square-foot unit.
A related concern that you may want to consider in evaluating investment properties is the difference between value and cost per square foot. Assuming that you purchase a property at its current market value, the two factors—value and cost—should be the same. But these may vary as well. For example, if you are able to acquire property below its appraised market value, cost will actually be lower. If the discount is minor (under 10 percent of market value), the cost per unit is not going to be substantial. This divergence becomes more significant when you have owned property for many years and it has appreciated in value. At that point, the difference between value and cost takes on more importance. For example, if you originally purchased a property for $110,000 and it is worth $330,000 today, cost will be one-third current value. Of course, this will also affect your analysis on a per-unit basis.
The distinctions will become important to you in terms of investment analysis, when you will want to study investment performance based on original cost. Improved market value makes profitability (and cash flow) much more impressive based on cost. At the same time, to evaluate your property on today’s market, you may also need to use value-per-unit types of analysis. This is a useful exercise to ensure that your rental rates conform to current market rates for similar properties. If you slip below market rates, that will also affect property value if and when you want to place the property back on the market.
OPERATING EXPENSES FOR RENTAL PROPERTIES
When an investor makes the decision to purchase a rental property, the questions of value are resolved, at least for the moment. In the investor’s view, operational analysis of cash flow becomes far more important. Investors will ask, How is my property investment performing? This is the crucial issue on which the value of the investment will ultimately be judged.
The operating expense level is the starting point in comparative cash flow analysis. Some properties have higher operating expenses than others, for several reasons:
1.Higher utility costs
2.Property tax variations between states or counties
3.Varying insurance costs
4.Lender requirements that investors carry private mortgage insurance as a condition of granting the loan
5.Higher maintenance levels because of the age of the property
In comparing one property to another, either before closing a sale or after, the operating expense ratio reveals the relative demands on cash flow for expenses of all types (except mortgage interest, which is excluded from operating expenses). Typically, operating expenses include the sum of annual insurance (both fire/liability and private mortgage insurance, if applicable), property taxes, utilities you pay, repairs, maintenance, and others (including bookkeeping, landscaping, supplies, telephone applied to rental activity, and auto or truck expenses).
•Formula: Operating Expense Ratio
E ÷ I = R
where:
E |
= operating expenses |
I |
= rental income |
R |
= operating expense ratio |
•Excel Program: Operating Expense Ratio
A1: |
operating expenses |
B1: |
rental income |
C1: |
=SUM(A1/B1) |
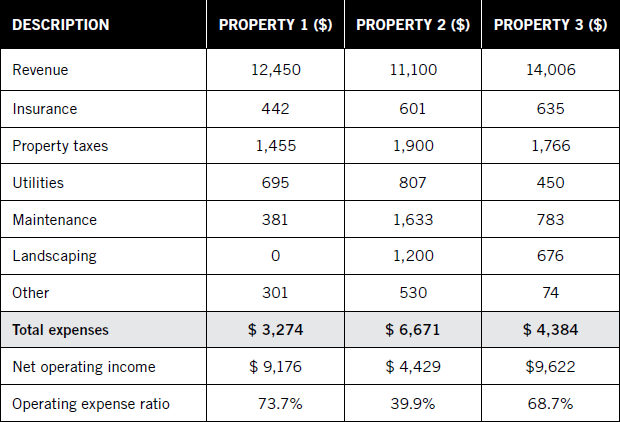
The example in Table 6.2 demonstrates the value of this formula in making comparisons.
The cash flow analysis is quite different from this calculation. Items not included here are the total debt service, which includes interest and principal; any payments for capital improvements; and a reduction for the tax benefits if applicable. The purpose of the operating expense ratio is to enable an investor (or potential investor) to determine how properties compare to one another. This example includes a variation for property number 2 that is caused by relatively low rents and exceptionally high expenses (especially for property taxes, maintenance, and landscaping). A scenario such as this could indicate that property number 2 is not likely to yield as high a cash flow as the other properties. It may also demonstrate a level of deferred maintenance and other problems that could make this property less attractive as an investment.
Table 6.2: Operating Expense Ratio
Operating expenses do not tell the whole story. This is a useful and revealing comparison, but investors also have to consider the tax advantages of claiming noncash depreciation and potentially reporting a net loss for tax purposes. A useful exercise in evaluating real estate investments is to make comparisons among many different investments on an after-tax basis.
For example, you may have only marginal after-tax cash flow from buying property, but the appreciation in market value may be significant. As long as the rate of growth in market value exceeds the rate of inflation, this could make real estate the strongest-performing investment when all aspects are considered (market value, cash flow, and tax benefits). Comparing the return on real estate with the net return you can earn from stocks, mutual funds, or savings is very helpful in deciding whether to include real estate in your financial plan and, if so, to what degree.
One formula that is very valuable in comparing outcomes between markets is the breakeven after taxes and inflation. This calculation estimates the return you need to achieve on an investment just to break even, given assumptions about your tax rate and the current rate of inflation.
•Formula: Breakeven After Taxes and Inflation
I ÷ (100 – E) = B
where:
I |
= inflation rate |
E |
= effective tax rate |
B |
= breakeven after taxes and inflation |
•Excel Program: Breakeven After Taxes and Inflation
A1: |
inflation rate |
B1: |
effective tax rate |
C1: |
=SUM(A1/(100-B1)) |
For example, if you believe that in the coming years inflation will average 3 percent, you would use that rate as part of this equation. Your effective tax rate is the combined federal and state rates you currently pay on taxable income. For example, if your federal rate is 35 percent and your state rate is 6 percent, your combined effective tax rate is 41 percent. Applying the formula given these values yields:
3 ÷ (100 – 41) = 5.1%
You will break even at 5.1 percent after inflation and taxes; thus, investments that earn that rate are not profitable, but they do preserve your capital’s buying power. If you were to earn a 5.1 percent profit on $20,000, for example:
$20,000 * 5.1% |
$1,020 |
Less inflation, 3% * $20,000 |
600 |
Less 41% income taxes |
418 |
Net profit |
$ 2 |
Table 6.3 summarizes the breakeven at various inflation and tax rates.
The various calculations designed to quantify value, spot cash flow trends, or critically evaluate investment return all serve you by providing useful information. There is little solace in knowing that average market prices are rising by 5 percent per year if you are losing an equal amount through negative cash flow. There is no sense in buying property when the total of expenses and payments is far higher than market rents. And the conservative investor understands that the double impact of inflation and taxes may outpace even a moderate rate of growth in prices.
Table 6.3: Breakeven after Taxes and Inflation

The purpose of these calculations is not to indicate automatically when (or if) action is required. For example, a declining rate of occupancy in your city does not mean you have to sell your rental property immediately. However, as part of a larger, longer-term trend, these indicators are useful tools for determining the health of your investments. Just as corporate executives monitor net profit and trends in sales, investors who own or are thinking of buying real estate also need to track operating margins, cash flow, and trends in market value.
The need to track profits and losses applies whether you purchase your own properties directly or work through a pooled investment. Chapter 7 demonstrates how to compare risks and profits in pooled investments and other organized programs for getting into real estate.