CHAPTER 4
The Behavioral Data Platform
Think back to a generation ago, when the economy was focused squarely on products and transactions: products sold, prices paid, and perhaps basic records on product returns or warranty repairs. In those bygone days, pretty much everything about what the customer thought, felt, believed, or doubted remained anecdotal and shared mostly person to person—by phone, letters, or in face-to-face conversations with employees at the store.
Now think of a very different scenario that plays out every day at a modern company like eBay: As the American multinational e-commerce giant supports activity around 800 million auction listings at any given time, a sophisticated Customer DNA database is parsing online activity— patterns around browsing, bidding, buying, spending, reviews, and numerous other factors—to build comprehensive, data-driven profiles of each customer for insight at the individual and aggregate levels.
The Customer DNA is, in many ways, the backbone of the company. Data is used to get a complete view of customers, including their attitudes, behaviors, demographics, and interests, as well as their value to eBay. The system looks at cart data, watch data, and cross-shop behavior, and how much of these and other activities is happening on desktop versus mobile. Ultimately, this Customer DNA environment creates a unified view of the customer base and all the individual variations for some very powerful insights into customer behaviors.
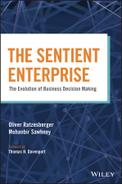
As we’ll explore in this chapter, today’s economy is now driven by a much deeper understanding of customer experiences and behaviors. We’ll see how business success today requires us to leverage the agility groundwork we laid in Chapter 3 to create the right Behavioral Data Platform—Stage 2 in the Sentient Enterprise journey—so we can understand and manage these customer experiences and behaviors.
Decades ago, however, customer sentiment—what people thought and felt about a transaction—remained an afterthought to the transaction itself. This scenario worked perfectly well in a twentieth century dominated by revolutionary new products that created new needs and markets for an eager buying public. The advent of telephones, mass-produced automobiles, kitchen appliances, televisions, personal computers, and other items drove the economy. Even at production scale, the focus remained very much on the product. Customers were wowed by the object itself, and consumer financing options helped keep the transactions going. Growth relied on making more and more products for more and more people to purchase.
This was the time before big data and e-commerce, before Yelp and Facebook. Comparison shopping was resource intensive, with savvy shoppers needing to make the effort to drive from store to store, search newspaper ads, or comb through back issues of Consumer Reports. And even then, customers’ knowledge of the best product didn’t guarantee they could get their hands on it in an era before Amazon, eBay, and free same-day shipping. Today, however, everything is different!
PERSONALIZED—IF NOT PERSONAL—INTERACTION
As customers, we have more convenience and more choices; and we’ve become more demanding because of this. The nature of competition has therefore shifted in a fundamental way: The customer experience is now paramount, and a company’s ability to create a good one is now a chief differentiator for success.
To further complicate matters, the days of vast new markets and frequent unveilings of radically new products are mostly over. It’s easier to create a great customer experience when it comes in the form of a radically new product (the iPhone’s arrival is probably the latest major revolution, and that was a decade ago). These days, it’s a more nuanced and difficult sell when you’re operating in saturated markets. Today’s companies typically find growth in adding services, incremental improvements, or—as anyone can tell from watching the never-ending price wars in the cellular market—luring new customers from competitors.
As an added challenge to business, the same digital and globally linked environment that elevated customer demands has also complicated our ability to satisfy these demands. The personalization we may see at the local level is completely missing at the global scale. And while today’s customers have learned not to expect a face-to-face interaction, they do expect a customized and easy experience. They expect convenience.
This consumer demand for convenience has replaced personal contact as a priority, and it’s a complicated thing to provide. Customers know their experience today may not be personal, but they demand that it feel personalized with things like good algorithms for product suggestions, knowledgeable tech or product support, hassle-free shipping, and seamless omnichannel integration of the online and brick-and-mortar experience. When there’s a problem, they want a better customer experience at all touch points, including one-call resolution and streamlined, multichannel processes for returns and refunds.
Amid all this change is a lesson that any company with even a prayer of competing and surviving in today’s economy needs to learn: With the customer experience now a top priority, the only way to leverage it is to track and optimize customer behaviors and the data that reflect these behaviors.
NEW MEASURES FOR SUCCESS, BUILT ON BEHAVIORAL DATA
As a result, all levels of the enterprise need to shift from transactional to behavioral thinking. CXOs in particular must focus more fully on behavioral issues like customer satisfaction and sentiment versus a pure revenue and profit mind-set. This evolution of understanding involves getting C-suite leaders to think in customer-centric terms and realize that a stronger bond between the enterprise and its customers will ultimately have a positive impact on revenue and profits in the mid to long term.
That’s why successful leaders are learning to embrace key performance indicators based on buyer sentiment. We happen to be big believers in a key performance indicator known as the Net Promoter Score, which helps correlate the strength of customer relationships with company revenue and growth.
Created in 2003 as an alternative to more traditional customer satisfaction research, the Net Promoter Score measures customers’ willingness to recommend a company’s products or services to others. The score index ranges from –100 (everyone is a detractor) to +100 (everyone is a promoter). Obviously you want to be in positive territory, and a score of +80 or more is considered to be very good.
In a preview of what’s to come, keep in mind that as we reach the end state where “sentient” algorithms are making the decisions, the Net Promoter Score may involve customers rating their satisfaction with how algorithms—not necessarily people—are doing their jobs. Nowhere is this more evident, and more imminent, than with the advent of self driving taxis and ride-hailing services.
Right now, for instance, riders using Lyft or Uber are essentially providing an implicit Net Promoter Score every time they give ratings for their drivers and the overall trip experience. But algorithms will soon change that. As Lyft partners with General Motors to put thousands of self-driving electric cars on the road as early as 2018, and as Uber continues its testing of autonomous vehicles in cities like Pittsburgh, PA, and Tempe, AZ, the time is near when such a Net Promoter Score will involve rider assessments not of people, but of the algorithms responsible for operating the vehicle.
Did I get carsick? Was I scared by a sudden move? Did my “driver” seem confused and stuck at that four-way intersection? Such questions will be directed not toward a human behind the wheel, but at the array of complex digital systems working together to drive the car. Equally complex will be the remedy for negative Net Promoter Scores. No longer will you, as the service provider, be able to simply fire the driver; instead, you’ll have to analyze what may be dozens of complex, concurrent systems.
Keep in mind that this pressure to apply new measures of customer sentiment to a new technology will be happening in the midst of immediate and intense market competition: At least three major auto manufacturers (General Motors, Ford, and Volvo) have already made clear their intention to put self-driving taxi or ride hailing fleet vehicles on public roads in just the next few years. (We’ll learn much more in Chapter 7 about self-driving cars, since they serve as a microcosm for the analytics-fueled “sentience” we’re ultimately hoping to achieve throughout the entire enterprise.)
Now and in the future, transactions will remain important. But without a deeper understanding of customers and the behaviors that will bring them to you and keep them loyal over time, you’re ignoring reality and sacrificing long-term growth for short-term revenue and profit. Customers are not like products that you can stock up and sell. You don’t possess customers; you retain them!
When we understand the value of the customer experience, and the behaviors that serve as markers and artifacts of this experience, we begin to see how analytics needs to be completely different. We must learn to drive decisions based on the behavioral patterns and the flood of behavioral data.
Behavioral data is all those events and data points in between or across transactions. Suddenly, it’s less about counting the products you sold this week versus last week. You now also have to look at behaviors and outcomes to answer questions like: What are people saying and doing? How are they likely to act in the future, and what are our next logical steps? How can I make the most of every touch point that I have? How do I get feedback if the customer was happy? What if my customer is angry? How do I turn a bad situation into a good one, and how quickly can I make that happen?
We need to find and interpret the data to answer these questions. Whether you’re studying the behavior of individuals or systems as a whole, you must look for patterns of behavior that lead to new insights. For example, we might look at the key behavioral steps that lead to customer acquisition and up-sell or cross-sell. We can also take readings of sensors around the world, opening up analytical capabilities for the Internet of Things (IoT).
Behavioral data lets us dig deeply into the areas where transactional information can’t begin to take us: Yes, John bought a Ford Mustang; we can see that transaction. But what about all the other people who didn’t buy? Were there some people who were on the path to buying a Mustang but who changed their mind at some point? Where was that point, and what was the reason? How can I learn to spot nonbuying behavior like this in the future? When and how should I intervene to get them back on the path to purchasing?
The laundry list of questions—all of them solvable only through close examination of behavioral data—will vary from company to company, depending on the industry, products, and services involved.
“We are always looking at subscriber growth,” said Grace Hwang, executive director for business intelligence and advanced analytics at Verizon Wireless. “Where can we find them? What pricing levels and bundles make the most sense for which customers? When we change pricing and promotion, how will that affect our position against competition—and what demographic, geographic, or other variables should we consider?”
LEVERAGING BEHAVIORAL DATA FOR REAL-WORLD BUSINESS CHALLENGES
We first met Grace Hwang in our Introduction, where she shared Verizon’s Company Credo and its mission to leverage economy of scale while remaining nimble and proactive. As we’ll see shortly, Verizon’s mission has been a successful one in no small part because the company always pegs its efforts to real-world outcomes. “It ultimately comes down to staying relevant,” Grace told us. “You’ve got to stay relevant to your customer.”
Staying relevant in today’s fast-changing world is an achievement for any company; but it’s a particularly striking one for large, established organizations. Remember our previous chapter’s discussion of Dell’s agility efforts around global manufacturing? That’s just one piece of a company-wide effort to not just streamline its own operations but to position it to compete, even dominate, in today’s economy. A case in point is Dell’s $67 billion initiative to purchase fellow tech giant EMC and meet, as the New York Times put it, “the challenge of integrating a fellow old-line tech company in a world in which new technologies have already upset other venerable names.”
Verizon gained similar headlines of its own with the July 2016 announcement that it would buy Yahoo!’s core Internet properties for more than $4.8 billion in cash. Here is Verizon, a large and established company with roots going back many decades to the old Bell system, which is now thriving to the point where it is able to buy an Internet pioneer. What’s more, given Yahoo!’s run through six CEOs in less than a decade, Verizon is positioning itself to succeed where previous efforts to right the troubled company have fallen short.
What’s behind this and other achievements, like Verizon’s 2015 acquisition of America Online (AOL), its position as the number one U.S. wireless operator, and its reputation for having the industry’s lowest customer churn rate in the United States? In our opinion, powerful and proactive analytics fueled by behavioral data have played no small part. Major acquisitions and other big milestones of success are the culmination of countless instances of data-driven decisioning to predict trends, seize market opportunities, and navigate around or through the next crisis.
When asked, Verizon’s Grace Hwang had no trouble bringing one such instance to mind. It was back in 2011, when Apple’s iOS 5 update included the debut of iMessage, a free texting service that suddenly allowed iPhone users to sidestep carriers when texting between iOS devices, including other iPhones.
“That was a major change,” Grace told us. “It was a huge deal at the time, because carriers made a lot of money from text messaging plans.” Indeed, texting accounted for some $23 billion in revenue for carriers in 2011; Verizon Wireless alone was generating an estimated $7 billion, or about 12 percent of the company’s total annual revenue, from text messaging.
“It was very short notice, and it was up to us to figure out, ‘How can we get on a predictive curve?’” said Grace. “We had to ask, ‘If all the Apple-to-Apple text messages go away, what will our customers do? How will they react when they don’t see the same value in our text messaging plans anymore?’” Her company’s use of analytics to find answers proactively speaks volumes about why Verizon enjoys the market dominance it does today:
“Before the iMessage release, we built a monitoring mechanism. The COO needed leading indicators and a sense of when to adjust our pricing so we’re not hurting our business. We were saying, ‘Okay, where can I see Apple-to-Apple messages—not penetrating privacy but using switch data and other ways to see, in aggregate, which messages are Apple to Apple, which others involve incoming texts from other carriers, and so forth?’
“We needed to be able to come to leadership with data and context that would then drive decisions in IT, marketing—everything—to be ready to shift our pricing focus to the metering of data and let go of voice and texting as the revenue sources we were used to. Ultimately, we were able to time when to switch pricing to unlimited talk and text, and what that pricing should be. The whole industry moved in that direction, but our job was to figure out how to do it best and fastest.
“This was a true predictive use case,” Grace summarized. “We had to be proactive and find the right information and behaviors on a leading indicator basis. Ultimately, the metrics and impact were huge. You’re talking tens of millions of dollars a year of potential loss had we not been proactive.”
In the course of writing this book, we’ve found how this proactive use of data to tackle even the most daunting organizational challenges seems to be a signature strategy for top analytics practitioners and executives.
“I’m a huge football fan, so when I think of the chief data officer’s charter, it’s a lot like the ‘pick six’ opportunity you see out on the playing field when a quarterback throws a pass and there’s an interception by a defender who is then able to run the ball into the end zone for a touchdown,” said A. Charles Thomas, who at the time of his interview for this book was chief data officer at Wells Fargo, but is now chief data officer at General Motors. In the interview, Charles explained how the “pick six” applies to the analytic playbook.
“If your defense is only stopping plays, that’s fine. But the bonus is to also generate points and find that opportunity to advance the team,” Charles told us. “That’s what you need to do with analytics: you take what may be a challenging or defensive situation and find ways to turn the situation around into a winning scenario.”
“It is important to use a wide variety of rich behavioral data—including speech to text, online feedback, account behavior, in-person interactions, and letters we receive—to do root cause analysis and get a good understanding of what any problems are. For instance, if you get complaints from customers about delays in receiving their credit cards in the mail, the data can help find similarities or trends within that complaint data; perhaps it’s related to geography, the underwriting process, or something about the mailing addresses. This is how the data can help us not only identify common dynamics to any problem, but predict those dynamics moving forward.
“The ability to both understand and predict circumstances allows us to move forward proactively. You are then able to enhance our own processes internally and also reach out proactively to customers, often before they may even realize there’s an issue. We can be the ones to alert them about the situation, and let them know how we’re already fixing it for them. It takes a lot of coordination and collaboration around data within the organization. But if you can pull it off, these are the kind of ‘pick six’ opportunities that help turn a challenging scenario into one that can enhance your own operations and your relationship and trust with the customer—all of which can save money for the company.”
BEHAVIORAL DATA IS EVERYWHERE
For the sake of clarity, we’ve so far been talking mostly in the context of consumer-facing goods and services. But keep in mind that this shift from transactional to behavioral data is an across-the-board upheaval that extends to industrial settings and how we work with machine and sensor data.
As we discussed in Chapter 2, the sensor-driven Internet of Things is revolutionizing our ability to index the world, predict future circumstances, and control future outcomes. We highlighted in that chapter the “black box” event data recorders in most new cars. The sensors inside are tracking the behaviors of both the car and the driver, capturing vehicle operations and driving habits to optimize performance, improve future engine design, or spot unsafe driving.
As another example, airline operators and manufacturers can now use the many sensors on a plane to measure and customize performance based on duty cycle. An aircraft used for cross-country routes may fly many miles with fewer takeoffs and landings; the opposite may be the case for the same kind of plane assigned to regional routes. In these situations, sensor data can help you make duty-specific adjustments to optimize safety and fuel efficiency.
Behavioral data and analytics extend to completely industrial settings as well, like what sensors can tell us about wind turbine performance, or wear and tear on oil exploration drill bits as they’re exposed to various factors like heat, torque, and changes in rock composition.
The behavioral patterns allow us to better understand interactions. Humans shop, research, and interact with the company in countless ways. Machines perform and deliver different results based on their surroundings and conditions. We no longer just count or aggregate data points; we’re connecting them in complex ways.
From industrial settings and fleet logistics to personal driving or shopping habits, behavioral data is the source of tremendously valuable insights for business. It shows patterns and context and helps us mature our analytics to the point where we can predict and prevent setbacks in anything from human buying habits to machine performance.
AGILE SYSTEMS FOR BEHAVIORAL DATA
Now that we’ve illustrated the tremendous opportunities that come with behavioral data, we’re going to spend the rest of this chapter learning how to operationalize such data in the enterprise—how, in other words, to make the Behavioral Data Platform a reality in your organization. You’ll remember from Chapter 1 that behavioral data involves tremendously large data volumes and varieties of information. That means our architectures and analytics must be able to handle the 10 to 100 times higher volumes and increased complexity involved.
The reason for all this data is that it makes up a vast landscape of information, within which lie patterns of activity representing the behaviors we’ve been talking about. It’s not just statistics and bean counting. Instead we’re looking for signals amid all the noise, and this requires many data points. We need an architecture that allows us to work in a wide-open field where there may be hundreds or thousands of clicks happening for every transaction.
An individual click during a sale is meaningless, just as an individual sensor reading is meaningless. The value in the flood of these data points rushing at us comes from the patterns within. By the thousands or millions, these data points contain the picture of what is happening and what we can do about it, provided we’re creative about connecting the dots and finding the right patterns. And the only way to find these patterns is through creativity and experimentation.
Think about these two factors—creativity and experimentation—and remember how they had so much to do with our efforts in Chapter 3 to set up the data labs, Layered Data Architecture, and other elements of the Agile Data Platform. We spent a lot of that chapter laying the analytics groundwork so we could be agile without inadvertently doing harm through data drift, duplication, and error. Now you see what all this agility is meant for: handling behavioral data!
The more you put agile systems in place, the more people can start thinking about and testing behavioral models and dynamics. Think of how we built the virtual data mart (VDM) so users can have centralized access to data for decentralized use cases. When our users set up a VDM to access production data along with their own data to run specific use cases, what they’re doing is looking for patterns in behavioral information. They’re experimenting with behavioral data.
All this experimentation is necessary since behavioral processing and thinking are quite different from traditional analytics. We’re exploding the volume of data to be considered while simultaneously imposing a big question mark on everything in terms of what may be important. By contrast, transactional data involves fewer data points, and we have a better sense of its importance because most of it is directly linked to a sale or transaction.
Behavioral processing shows us many data points, and many ways to value data. For example, tightly coupled data is the data that’s heavily structured and rules-bound. If you were analyzing clickstream data for an e-commerce web site, this would include your definitions of what constitutes a high-value customer, a gold standard metric across your company. Anyone who wanted to change this definition would have to follow a strict process, and those changes would be controlled by a select few.
Meanwhile, loosely coupled data is data that has less structure and fewer contingencies. In the clickstream example, loosely coupled data may include a pairing of a customer ID with a certain session, or a customer ID tagged to a Google search ad campaign or a button on the company’s home page. Loosely coupled data can include tens of thousands of tags denoting the kinds of sessions that users had, where they came from, what they clicked on, and so on.
Finally, noncoupled data is the purest, raw form of data. Its usefulness may not even be apparent at first glance, but it could come in handy later. Social media chatter could be one example, as could weather and traffic data.
Bear in mind that your infrastructure must keep up with the capacity demands that come with behavioral processing; and, depending on the use case, those demands may be considerable. The example of money laundering readily comes to mind for Partha Sen. He’s founder and CEO of Fuzzy Logix, which specializes in GPU-based and in-database solutions for, among other things, advanced analytics in finance and banking.
“If you look at anti-money-laundering statistics, many organizations are still catching only 20 or 30 percent of perpetrators; and a main concern is volume,” he told us. “To legitimize ill-gotten wealth, money laundering can involve several transactions that take time to complete—buying and selling real estate, for instance. If you can only handle a couple of months of data, you miss that life cycle and the patterns may go unnoticed.”
“Financial fraud is definitely one of those challenges where finding patterns and signals amid the noise at the scale of big data can be astronomical,” said Jacek Becla, Teradata’s vice president for technology and innovation. And for Jacek, that analogy is literal: Before joining Teradata in 2017, he served as project manager and head of scalable data systems for the SLAC National Accelerator Laboratory at Stanford University in Menlo Park, California. SLAC conducts cutting-edge research in physics, particle astrophysics, and related disciplines funded by the U.S. Department of Energy (DOE) and the National Science Foundation (NSF). He is also founder of the Extremely Large Database and Data Management (XLDB) community, which hosts annual conferences on challenges related to extreme-scale data sets.
“With astronomy, the scale demands you have distributed data sets, chopping up the sky into chunks of data to analyze. This is where things get complicated, because a typical statistical algorithm grinds to a halt at this scale. It’s the same thing with financial fraud and other behavioral data at scale,” Jacek explained to us in an interview. “There’s no obvious algorithm to detect fraud, the data is not clean, and it’s different every time. So it’s tricky to build models that you’re constantly customizing and validating. You have to think differently and write algorithms that address distributed systems, disk I/O, and related problems that require a lot of customization and adjustments to your models.”
BACK INSIDE THE LAYERED DATA ARCHITECTURE
When you understand these complexities, you start to see why it takes robust systems and many kinds of professionals to collaborate around behavioral data at scale. No single employee or team can spot all the ways that a particular form of data may be important, so collaboration is necessary.
Thankfully, we have the Layered Data Architecture in place to render information at multiple levels of complexity for different people to experiment in the contexts they’re accustomed to. Sometimes we’re in familiar territory, where business users are looking for new instances of patterns and behaviors that have already been established. Other times, we’re at square one with a mass of raw data whose patterns remain totally hidden.
Think of a chunk of marble before the sculptor strikes the first blow of the hammer and chisel. The sculptor, in this case, would be the data scientist—indeed, the data artist—working at the lowest and most granular levels of the Layered Data Architecture.
Remember that the Layered Data Architecture is a decomposition framework to get data in its most granular form. This makes it possible for us to examine and reconstitute the data in various levels of complexity for various purposes. While business users may be experimenting in VDMs further up the line, they’re doing so on a foundation of research and insight created by data scientists down at Levels 0 and 1, the very lowest layers of the LDA.
These atomic and granular levels, where data sits in its original fidelity, are the seedbed for behavioral data insights. It’s where we first start teasing out the signal from the noise. It’s a fascinating and challenging realm where highly specialized data scientists take a first look at raw data and try to put it in relation to existing data that we may already have. Here’s where we take a first stab at looking for patterns and maybe writing initial algorithms to find more such patterns.
Granularity is key! In previous generations, where capacity was limited and behavioral patterns weren’t so important, IT professionals sending data sets to analysts may have thought they were doing everyone a favor by rolling up data—taking minute-by-minute sensor readings and turning them into hourly averages, for example. Today, that’s a disservice. Big data platforms can handle the capacity, and every time we roll up, we lose visibility into what’s happening.
Granularity reaps value, even if that value is not apparent until later on down the line. We’ve learned, for instance, that customer sentiment in a call center interaction can be correlated to one very basic factor: duration of the call. People who complain take longer to say it (“My product is the wrong color, plus it took forever to arrive. And then I needed my son to help set it up …”). People who say they’re happy tend to do so succinctly (“Great product. I love it!”).
The importance of call duration in this example, however, may initially be hidden amid the noise. In cases like this, where we’re first trying to figure out patterns and structures amid the raw data, we find ourselves sifting through some of the most universal and basic pieces of information (date/time stamps or customer identifiers, perhaps) and contending with problems of data quality and consistency (we might find that date/time stamps are logged in several different ways).
A lot of semistructured data modeling takes place at this level. Most of the time, data comes in from business systems and we know what kind of data it is. But we still have to figure out its context and usability. Over time, the goal is to find ways to transcend intent and format of various forms of data. Particularly useful are things like time series, customer identifiers, or some event of interest—whether that happens to be a complaint, threat to leave, compliment, renewal, or something else. You can see how such data wrangling like this can be tough at these early stages. It’s a lot like forensics, a mystery to solve by finding commonalities and patterns wherever you can.
REAPING VALUE AND INSIGHT
As we identify more patterns, our confidence level rises. Once we get to the point where business colleagues can help you understand the data and validate it, things start getting familiar (“Ahh, that’s a use case around customers not paying their credit card bills. We have to figure out how to get them to pay.”). Even then, the analyst may still need to make certain assumptions. It’s sort of like being in a play where you have a script, but still need to improvise certain parts.
The good news is that the payoff for this legwork can be tremendous. As we continue to find patterns and make sense across multiple varieties and channels of data, we can begin to harmonize them. Multiple channels or touch points of customer interaction, for instance, can be harmonized into one mega channel, such as an integrated contact history (ICH) file. You can then search for more complex patterns associated with positive or negative customer outcomes.
Assume for a moment you’re doing this kind of customer relationship management (CRM) work for a wireless service provider. People are upset with the service, and some are switching providers. We’ve harmonized three channels: call center notes, trips to a store, and clickstream logs from their web experience. Who went online first? Who went to the store first? Who called the contact center first? In this example, there’s a good chance we can examine the sequence of interactions and see how they relate to positive or negative outcomes. Now we have better insight into how and where to prioritize our efforts at customer retention.
How much insight is too much insight? You’ve probably heard the quote “Just because we can doesn’t mean we should.” That is certainly something to consider as we realize how fully behavioral data lets us understand our customers. Much of the issue has to do with data privacy. In our experience, customers don’t mind if you get to know their preferences and habits per se. But things get creepy if you start indiscriminately sharing those nuances of their life with other companies.
Behavioral knowledge and data privacy need to go hand in hand: we like to say companies should be customized without being creepy. It’s almost like your customer has entered into a contract or covenant with you: “I’m going to let you know about me so you can make my customer experience easy and seamless; but I don’t want you to sell or leak that knowledge to everyone else.”
PROACTIVE DATA STANDARDS AND DESIGNING FOR THE UNKNOWN
You probably noticed that we’ve made more than one reference in this chapter to artistic realms like sculpture and live theater productions. These references are intentional: the data scientist looking for patterns amid all the noise is blending mathematical and engineering expertise with no small amount of artistry in making innovative assumptions and coming up with novel theories and insights.
That creative guesswork can be time-consuming, however, and a certain amount can be avoided if we do a better job standardizing the way we collect and use data to begin with. We need to record and manage data with an eye toward how it’s going to be analyzed in the future, even if we don’t know exactly what that future will look like.
We need, in other words, to design for the unknown. The roll-ups and optimizations we talked about earlier in this chapter may work okay for today’s known applications, but our analytic architecture and design choices today should not inhibit new and currently unknown use cases tomorrow.
For example, technologists often place clickstream data into session containers on file systems to make things like bot detection or per-visit analysis easy. But doing so sacrifices entirely different use cases— situations that may not start with individual website visits such as financial checkouts, call center interactions, or machine/sensor events.
Whenever we place data in a certain order, grouping, or structure to allow for one type of access today, chances are that we may complicate things tomorrow as patterns and questions shift. That’s bad news, because we cannot afford to redesign or rearchitect the data over and over. Yet, this is what’s most likely happening right now in your company over and over.
If we remedy such issues—standardizing wherever possible, avoiding roll-ups, and preserving the granular detail when staging data for analysis—we reduce friction, enhance governance, and make our organization better and faster at wrangling data. Few companies today do this really well, meaning anybody who is diligent about standardization can get real competitive advantage.
Dell is one such company. In Chapter 3, we heard from Vice President Jennifer Felch about Dell’s evolution toward global manufacturing processes and infrastructure. To its credit, the Dell analytics team understood clearly and early the value of standardization. “When we organized the company into some globally shared capabilities, that’s where we had this realization that there were different processes, and even different definitions, of key data pieces,” she told us.
“We had regional general managers, regional manufacturing, and regional IT systems,” she said. “When it came time to set up a global manufacturing site, we had to ask, ‘Are we going to support three or four different inputs and processes, or are we going to standardize before we go? Do we spend three times the integration costs, or do we just do it right from the start?’ And so we decided to standardize from the very beginning.”
We’ve spent the past few pages looking over the shoulders of experts who first examine our data for patterns and context. But not everyone is a data scientist, and we need to make sure analytics is accessible more broadly across the organization. The Sentient Enterprise, after all, is about creating a world where all people in the company work together to prioritize corporate information and execute analytics. That’s where the Collaborative Ideation Platform—Stage 3 of the Sentient Enterprise journey—comes in.