CHAPTER 3
The Agile Data Platform
Texas-based Dell, Inc. has thrived by skillfully adapting to business and consumer needs over more than three decades. By 2017, Dell was ranked as the world’s largest privately held technology company and the United States’ fourth largest private company, with revenues of $72 billion and a global workforce of more than 140,000 people. Like all large firms, Dell has found ways to scale operations globally, but not without significant data management challenges along the way.
“It came to a head for us when we set up global manufacturing processes and infrastructure,” says Dell’s vice president for enterprise services and order experience, Jennifer Felch. As Jennifer began telling us the story of Dell’s initial push to aggregate global manufacturing data across all functions and regions into one master environment for reporting and analytics, the struggle she described sounded strikingly similar to the data drift, duplication, and other pain points we first highlighted in Chapter 1.
“At one point, we’d have a number of teams that were pulling data, doing analytics in their own data cubes, and then getting into meetings with each other and discussing why their data didn’t match up,” she told us in an interview. “People were taking data and it never came back. They would create reports, but that data never came back as shared data. Our number-one priority was to make the data transparent, accessible, and consistent as our company grew.”
“Scaling is the forcing function for standardizing and becoming as efficient and accurate as possible with your data,” Jennifer summarized. “We knew we had to find a solution.” We’ll take a closer look at that solution a little later in this chapter. But first, we need to understand just how common this challenge is as large organizations grow and scale operations.
RETAINING AGILITY AT SCALE
For most companies, bringing the Sentient Enterprise vision to life involves a wholesale makeover in how data is managed and manipulated as the organization grows in size and complexity. It’s what we’ve been calling “change management on steroids” and something Siemens Mobility’s Gerhard Kress considers “change management on all sides.”
“Change management is the key lever. You have to help everyone understand what analytics means and what these data points can do for them,” Gerhard told us. “In our case, we have to take engineers—who’ve spent years designing and creating a standing product—with us on the journey to understand how data helps us all become even better. And you have to connect them with all these young data scientists that come from university and want to rock the world.
“Getting all these people together to provide the best service for the customer is essential,” he summarized. “And I think, without change management on all sides, there’s nowhere you can make that happen.” For Gerhard and most other technology executives, a key task is to get the whole organization on a much more agile footing with data.
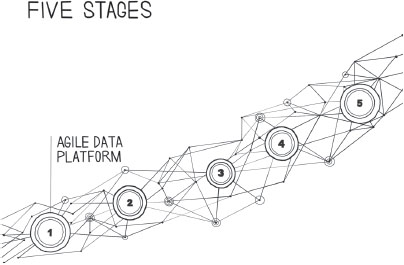
For that, we set up the Agile Data Platform, the first of the five stages in the Sentient Enterprise journey. Here, we are going to apply a number of agile methodologies and systems to data and analytics, striking some careful balances along the way. We want to give users freedom to iterate on data without having to make copies of that data. We must get rid of excessive governance barriers without opening the floodgates to Wild West anarchy. We need effortless movement of information without turning our architectures into a collapsing house of cards of data drift and duplication. Above all, we have to give centralized access to data for decentralized experiments on use cases in a way that doesn’t pollute the whole system with experiment-driven artifacts and error.
In order to be sustainable, this transformation to an Agile Data Platform must involve the right combination of people, processes, and technology. You can’t just focus on one of these in isolation. You need to address everything—from organizational culture and processes to the architectures and governance that define how we store, share, analyze, and manipulate data for competitive advantage. So where do we start?
RETHINKING WATERFALL METHODOLOGIES
Near the top of our to-do list is to move beyond so-called waterfall methodologies that have dominated IT projects for decades. The approach gets its name from the steady downward flow of progress (like a waterfall) through distinct phases like conception, initiation, analysis, design, construction, testing, production, implementation, and maintenance. It’s a stately progression where requirements are laid out up front, even though these requirements may end up changing along the way.
Unfortunately, waterfall methodologies have difficulty handling changes midstream; this is a chief criticism of the approach and the reason it’s not agile. Clients may not know exactly what they want until they see a working prototype or system, and then their requirements could change as a result. Designers may encounter new or unforeseen problems at that point as well. Either way, waterfall development brings delays and extra cost for redesign, redevelopment, and retesting.
Many have tried incremental improvements, like introducing some degree of overlap between waterfall stages. But others have sought more wholesale changes. The U.S. Department of Defense (DoD), for instance, has stated its preference against waterfall-type methodologies in favor of more iterative and incremental development models. The DoD is on the right path here, and organizations that succeed in taking analytics beyond waterfall to more agile approaches will find they can supercharge their analytics capabilities and the value these capabilities reap for the enterprise.
This change can also streamline collaboration between IT and the rest of the organization. Waterfall strategies and their glacial time lines are a big part of why so many IT departments have gotten a bad reputation in their companies as slow and uncooperative partners. Many now see the need for a basic rethinking of how to structure IT product development. Nowhere is the need greater than in the fast-changing world of analytics.
AGILE ANALYTICS
The Agile Data Platform relies on our analytics professionals finding better ways to configure projects and collaborate with the rest of the company. Fortunately, the majority of people building agile systems around analytics today have the benefit of more and more templates and frameworks now available to help guide their work. We happen to be big fans of agile development methodologies like Scrum.
Chapter 8 includes more details on how to implement and work with Scrum, but we’ll discuss it here as a prime example of the kind of agile development and project management platform that helps drive analytic change throughout the organization.
Scrum lays out several key roles designed to support an agile environment. The product owner represents external stakeholders and is generally considered to be the voice of the customer, even if that customer is an internal colleague in another department who needs an analytic solution. Rather than deliver complicated requirements documents, the product owner generally drafts user stories or other customer-centric narratives to define and prioritize needs. The development team is responsible for doing the actual work on analysis, design, development, documentation, and implementation. Though such teams are often small—typically 10 people or fewer—they are cross-functional and collectively possess all the skills necessary to do the job.
Then there is a Scrum master, who is responsible for troubleshooting and removing impediments. The Scrum master is neither a proxy for the customer nor a traditional team lead or project manager. The job is more like a facilitator who ensures the team follows the agreed Scrum processes and acts as a buffer between the team and any distracting influences.
Scrum’s overall framework is loose and dynamic enough to act as an “exposure model” to quickly identify problems and innovative ways to overcome them. But loose doesn’t mean undisciplined. Indeed, while the word itself is derived from the scrum of rugby play—as in the “disorderly struggle or fight” in Merriam-Webster’s definition—there’s really a highly organized process that’s under way in a Scrum project. Things may seem disorderly on the surface, but what you’re seeing is a proven and successful framework for constant feedback, strategic adjustments, and course correction that has been adopted broadly for projects in education, marketing, operations, and other settings.
This flexible methodology was first conceived for software product development, but Scrum also happens to be extremely well suited for analytics. That’s because the same flexibility built into the methodology to handle requirements churn from software customers is also useful for handling the ever-changing conditions analytics professionals discover as we use data in new ways and tweak capabilities.
Ultimately, however, your agile project management platform must thoroughly replace, not rest on top of, the same old waterfall procedures. Otherwise, you get what’s called “waterscrum” or “scrummerfall”; and while the nicknames may be humorous, the results—in terms of lost opportunities for innovation and competitive advantage—are not. You cannot simply reverse engineer agility. Platforms like Scrum are just part of that larger blueprint for making true agility happen throughout the organization.
Another key part of this blueprint is the self-service ethic we discussed in Chapter 1. It is no use having Scrum or other agile platforms without self-service tools to accompany them. Unfortunately, many infrastructures are set up for a waterfall methodology. Things like ticketing systems with service-level agreements (SLAs) of seven days or more are all too common and will prohibit Scrum from becoming successful. Agile development and self-service tooling have to go hand in hand. And in the Sentient Enterprise, the way this happens is through a new kind of data mart.
SPREADING AGILITY COMPANY-WIDE WITH THE VIRTUAL DATA MART
Creating the Agile Data Platform involves pivoting from what you’d consider traditional data warehouse structures and methodologies to a more balanced and decentralized framework that’s built for agility. Hosting your data in enterprise data warehouses (EDWs) certainly isn’t agile; but we’ve already learned that it doesn’t help matters when we build siloed data marts that sabotage your systems with error and anarchy.
Bear in mind that data marts are not found just in legacy technology. In fact, most data marts created today are built with SQL, NoSQL, databases, file systems or similar technologies. Open source or not, legacy or not—if a system creates an extra copy of data or is a nonintegrated silo of data, then it’s a data mart. The biggest silos of all have actually been built on the likes of Hadoop, as the ability to scale has driven their sizes into the petabyte scale.
As said before, any sustainable plan for improvement requires that we reimagine how people, processes, and technology all come together around data. Remember how we met the well-intentioned financial analyst in Chapter 1 who didn’t want to wait 18 months for IT to help him set up a data research project on asset allocation? His unfortunate choice was to build his own data mart—a collection of copies from his company’s broader data infrastructure. It was his Wild West solution that gave him quick—and wrong—results as the data values and accuracy drifted every time he copied his own little slice of the company’s data and manipulated it.
To get agile throughout the organization and make it sustainable, we need to retain this convenient, self-service sandbox concept of a data mart or data lab, but build it in a way where it doesn’t pollute the larger data ecosystem. The answer is what we call the virtual data mart (VDM), which replicates many of the conditions that lure colleagues to the traditional data mart (perceived agility and minimal red tape) without the pitfalls (data drift, duplication, and error).
At the beginning of this chapter, we highlighted the need to give centralized access to data for decentralized use cases, and this is exactly what VDMs do. They let users rapidly access production data along with their own data to quickly execute their own specific use cases. But these activities do not alter the production data itself. If you’re using a VDM, you can safely experiment and build prototypes by plugging into existing data and capturing and refining your current data templates and rules.
Multiple users across the organization are creating VDMs simultaneously in real time. As a result, you get accurate and clean data that is still flexible because anyone in the enterprise can request and analyze that data, anytime and anywhere. The VDMs must be easy to use or else they’ll represent just another hurdle. That’s why the VDM sits on top, or inside, of existing platforms where we have all the data. As a user, the moment you provision that VDM (or sandbox, data lab, or whatever you want to call it), you already see all data that you’re allowed to see.
Whatever you’re certified for, your access to data within that context should be like an open book. This is a key point: Once IT covers basic needs for certification, it’s time to get out of the judgment business. That’s why we recommend companies designate a certain amount of storage (100 or 200 gigabytes, let’s say) on a no-questions-asked basis. Ideally, this kind of self-service provisioning can happen right away, in five minutes or less.
A VIRTUAL DATA MART (BY ANY OTHER NAME) IN ACTION
In case you think we’re talking just in hypotheticals, let’s take a closer look at Dell and the challenge faced by Jennifer Felch and her colleagues. When the company was founded by Michael Dell in 1984, it was initially a pure hardware vendor. Dell was an early pioneer in supply chain management and electronic commerce—particularly the build-to-order or configure-to-order approach to manufacturing.
Dell has since expanded into IT services, enterprise solutions, software, and client solutions, selling everything from personal computers, servers, and data storage devices to network switches, software programs, computer peripherals, cameras, TVs, and printers. This growth led to the daunting challenge Jennifer Felch shared with us at the start of this chapter.
As vice president for enterprise services and order experience, Jennifer found herself with the mission-critical task of aggregating data for reporting and analytics on global manufacturing into one master environment. That environment had to account for all manufacturing functions and regions around the world—and it all had to be done while keeping data transparent, accessible, and consistent across the organization!
Dell solved the issue by developing the company’s own version of what we’ve been calling the virtual data mart (VDM). “We have a lab environment now, with 25 business-supported active labs,” said Jennifer. “This environment doesn’t change the master, and it also doesn’t take data away into another level in some cube where there’s no return path.
“So now our teams have access to all of that data; they get to play with data and figure out what makes sense,” Jennifer continued. “Once there’s agreement on the definitions, the meanings, even the calculations—once we reach a point where we can collectively say something like ‘Hey, this seems to be the best way to measure this particular KPI across the board’—we can put that back into the common data environment and everybody has access to it.
“The takeaway for us was pretty clear,” Jennifer summarized. “Scaling was the forcing function that said to us, ‘You’re going to have to change your processes.’ It’s not that we had poor practices before. It’s just that, in the shift to leveraging more global processes and infrastructure, we needed to adjust the way we worked with data as well.”
TIME BOXING
Dell’s experience shows how powerful VDMs can be. Part of Dell’s success, however—and that of any company taking this approach—lies in how the VDM environment is managed over time. Almost by definition, these data labs are temporary tools for experimentation and discovery. That means we need to slide in some kind of governance so that, over the long term, we don’t end up with many thousands of data marts that people may not need or use anymore.
VDMs don’t simply disappear when you’re done with them. How can you keep them from accumulating like digital deadwood that takes up valuable space on your systems? The answer is to time box, a tried-and-true method for allocating capacity where it’s needed most. Here’s how it works:
Make it easy for people in your company to provision a VDM, but designate access for a limited amount of time—typically 30, 60, or 90 days. These are reasonable time frames for anyone running analytics experiments to either hit pay dirt (or at least find a promising lead) or else give up. You can easily build in automatic notifications when VDM access is about to expire; send an e-mail alert 10 or 15 days before system expiration, for example.
Within that notification, make it simple for a user who needs more time to just click a link and extend access for another month or two. If folks are onto something, they’ll ask for more time. If not, they’ll ignore the e-mail alerts and won’t care if their VDM disappears.
Throughout this process, it’s critically important that you devote enough capacity to support the VDM environment. Even with automatic processes that purge unused or unneeded experiments, you still have to devote a significant amount of capacity for the many data marts currently in use. This need will grow as you rack up wins and the approach catches on throughout the company.
Our point here is that you can’t just turn on a sandbox environment. You may ultimately need as much as 30 to 50 percent of your company’s system capacity allocated for this kind of experimentation; most companies today have only zero to 5 percent of their capacity devoted to such uses. Without devoting the needed capacity, it’d be like launching a severely understaffed call center, with all the dysfunction and frustration you’d expect to go along with that.
FEWER REQUIREMENTS, MORE PROTOTYPES
When set up correctly, your VDM system is a cornerstone in the Agile Data Platform—a self-service environment for innovation where people basically self-select when they’re onto something. It’s easy to keep track of those in the company who are asking for more time and have likely gone beyond the stage of having an initial prototype.
You see how innovation remains seamless and hassle-free throughout this process. We are not talking waterfall-style requirements here. It’s more a natural way of observing who is doing what with data, and finding strategic ways for IT to help bring a solution to maturity when a team is making progress on a prototype. So what do we put in place of those old waterfall requirements documents?
The answer is to institute what we call a “speedboat” or “fast-track” approach, and it’s a very simple one. It basically means that anyone who gets to the point of having a working prototype can then enter into a fast-track program of IT assistance to fortify and replicate the prototype for production use. As we’ll see more fully in Chapter 6, cloud and so-called DevOps resources can facilitate this approach.
It’s a “start small, scale fast” approach with no room, and no need, for waterfall requirements. That’s because prototypes are much more useful than any requirements document could ever be. They give you a highly focused scope set of algorithms and outputs versus the broad definitions you see in waterfall methodologies. Prototypes usually result in basic dashboards and visualizations, and they represent a ton of questions already asked and answered on the experimenter’s part, any one of which may have prompted a “back to the drawing board” moment in a waterfall system of development.
We can tell you from experience that one working prototype is worth 100 requirements documents. That’s because a lot of the work is already done, so IT can focus on maturing the prototype into a production application. Rather than dealing with massive projects, your analytics teams are now working on many different small prototypes, nudging the best ones along to maturity and company-wide value.
Taken together, these prototypes make up a seedbed for innovation. And the time frame for realizing whether a particular prototype should be shelved, discarded, or taken further into production is very short, typically four to six weeks. You will find that many candidates will indeed get abandoned along the way in this “fail fast” environment. But other prototypes will make it to maturity and create real value for the company for a fraction of the time and expense that come with waterfall methodologies.
ANALYTICS ON ANALYTICS
So far, we’ve laid out a dynamic and innovative self-service environment to become agile around analytics. To get the most value out of the process, however, it’s very important to put the instrumentation in place so you’re able to say, “Not only can I support self-service, but I can govern it.”
Precisely because we’re letting people experiment and build their own prototypes and pilot systems before we send our architects to intervene and assist, we need a mechanism to analyze and reconstruct the steps our colleagues took in reaching the point of a successful prototype.
This is important, because people don’t usually keep track of every step they’ve taken, and they shouldn’t have to. Whether the goal is to troubleshoot or tweak, reconstruct or recommend, architects must have an unobtrusive way of logging and replaying every interaction in real time as people are working in their data labs—and retrieving that information after the fact to review where key decisions and insights were made.
In the Sentient Enterprise, we call this “analytics on analytics,” and it involves setting up our VDM environment so that every interaction in every sandbox and data lab is captured by default. We may not know in the moment which interactions will become useful in retrospect. But every interaction is documented so we can have it all at our disposal as we look at the success stories and piece together which data and analytic approaches helped contribute to them. Think of it as your clickstream of analytical usage.
Doing analytics on analytics gives us a granular understanding of what worked and what didn’t work as prototypes and analytics models came into being. In logging what everyone has done, we can review any part of the development process, and even replay events in sequence to get a dynamic picture of what happened over a period of time (e.g., “Let’s look at those final two weeks of prototype development and take a closer look at where this dashboard glitch was coming from before we fixed it”). An added benefit of this approach is that we are primarily looking at what has worked, since most of the failed approaches died in the sandbox stage and never reached the point of functioning prototype and IT intervention.
MAKING IT REAL WITH THE LAYERED DATA ARCHITECTURE
All the strategies we’ve laid out so far in this chapter will help us become more agile with data. But none of them can really work if we don’t have solid data architectures to support and undergird this agile environment. Otherwise the whole discussion of agility is just window dressing. If there’s no “there” there, people will simply revert to waterfall methodologies.
Remember how our definition of agility in the Introduction centered on decomposing problems into smaller ones so they’re easier to solve and collaborate around? The architecture we need must act as a decomposition framework for data itself, a classification tool that handles data in its many forms (raw, loosely or tightly coupled, etc.).
Beginning with the raw, atomic data, our architecture must render information at multiple levels of complexity and assign lanes and roles so we can overlay many different kinds of users onto the same data, and do so in the contexts that these multiple users are familiar with. In the Sentient Enterprise, we call this the Layered Data Architecture (LDA).

You’ll see multiple mentions of the LDA throughout this book, since it’s a central framework that comes into play throughout the five stages of the Sentient Enterprise journey.
The lowest staging layer contains atomic data that is stored in its original fidelity from source systems. In this layer, data should reflect as closely as possible the source system representation, and that includes lineage of data types and structures. Dates or financial data, for instance, must not become just text, or else you’ve just allowed the very first breakage of lineage to occur.
The staging layer can be accessed by the most technical data engineers or data scientists in your company. Keep in mind that this layer is not the same as a stand-alone data lake. Instead, Layer 0 needs to be part of the overall platform, capable of scaling in size, in complexity, and—crucially—in concurrency. You cannot build a stand-alone version of Layer 0 as a data lake, in other words, and have it be limited to a few dozen concurrent jobs accessing data in it.
Your staging layer must be enterprise scale, with hundreds of thousands of users and processes simultaneously accessing and processing data from it. The same data will have to be used in multiple ways (by customers, segments, products, hierarchies, internal versus external views, and financial or marketing use cases).
The higher up you go in the LDA, however, the more predefined structure you have, and the more intelligible your analytics become to more people in your enterprise. By the time you get to the aggregation layer, your business users can comfortably access and categorize data sets by customer attribute, location, revenue, or any number of criteria that might be familiar and useful to them.
Still further up, the presentation layer is the most structured and predefined. This is where various groups can access numbers through different interfaces, but still sees the same data. Think of the presentation layer as the published API to your data—mainly structured, version controlled, maintained for backward compatibility, and made available to any user or application authorized to access parts of it. Finally, the data lab is the user-owned sandbox that supports experimentation and self-service. These are the VDMs we’ve been talking about at length in this chapter.
The LDA is the foundation of the Agile Data Platform. It’s the engine that drives our frictionless, self-service analytics model that gives centralized access for decentralized use cases. It’s what helps us all collaborate around data while still controlling access and governance. Remember our definition of agility as decomposing problems or systems to make them manageable? Think of the LDA as a decomposition framework for data and processes.
DRIVING CHANGE IN THE AUTO INDUSTRY
An LDA approach is certainly at work for General Motors. “We’re rapidly accelerating the acquisition and colocation of data,” said GM’s Brett Vermette, whom we first met in Chapter 1. “We’re taking what you’d call integrated data and really denormalizing it, making it readily available in a form that’s easily consumable by 80 percent or some majority of people who need it at various levels.
“Much of the data acquired during the early days of our EDW program is very integrated and structured to help reduce replication and ensure integrity of keys across tables,” Brett explained. “So what we’re doing is working to try to combine some of that data, reduce the number of joins that are necessary to make that data useful, and put in some data structures that people can relatively easily consume.”
When we first caught up with Brett in Chapter 1, he was talking about GM’s self-imposed analytics overhaul to bring order to hundreds of data marts. During our interview, he shared a few more recollections on that successful, company-wide effort:
“In a matter of months, we quickly ramped up from a small handful of data warehousing professionals to several hundred. We brought in people with deep history in the space. We did an initial six-week study to inventory our landscape, built a road map for technology deployment, [and made] staffing plans. The study also helped identify more than 200 data marts all over the company.
“From our perspective, data marts are bad—they’re legacy analytics platforms and repositories that are often outdated and definitely not widely available or integrated. So what we’re really trying to do is consolidate our data marts across the company. We frankly weren’t surprised at the number of data marts we found. If you think back to the history of GM as a company, it had been a loosely connected conglomerate of organizations like Cadillac, Chevrolet, Buick, Oldsmobile, and Pontiac; there was our truck and bus group, and we also had Saturn. Each of those parts of the organization operated independently from an IT standpoint.
“So we have a long history of challenges involving siloed applications and the need for more integration across functional disciplines. We decided to bring all that data together and try to provide a unified foundation for people to look at the data we use to run the company much more holistically. In some cases, you need a high degree of curation, governance, management, and integration of data for usable results that give a viewpoint across the entire company. Other solutions may be just fine with less integration and little or no data curation. We’re shifting to a mind-set of ‘All data has value, regardless of the level of curation.’
“Our first solutions involved taking some sets of data and making it more widely available. We took ‘dynamic vehicle test’ data—the testing that’s first done on a vehicle before it leaves the plant—and integrated that data across the plants to make it more readily available to more people in the company. In a similar way, we built capabilities to better share and analyze financial data on vehicle profitability.”
From there, Brett says GM’s data transformation has gone on to support numerous sectors and stakeholders throughout the business. “You can point in almost any direction and see the benefits,” he told us, citing several examples. “As a shareholder, you’re seeing improved decision making on profitability and other analyses; in marketing, our call center operations are much more proactive; and vehicle safety, performance, and quality control are augmented as well.”
REMEMBERING THE BIG PICTURE
Never forget—and it must seem like our mantra by now—agility requires that you optimize how people, processes, and technology all convene around data. It is a constant balancing act, and any efforts you make in one area will be undercut if you don’t also address the other two as well. You need to consider all three factors when implementing better systems in your organization. In fact, our implementation-focused Chapter 8 features a bit more detail on how your company can put into practice some of the people, processes, and technology initiatives discussed so far.
Particularly on the people front, don’t underestimate your company’s need for training and guidance. Offer good internal professional services that manage engagement with prototyping teams. Assign architects and data scientists as advisers to these prototype teams, and have your advisers consider physically moving their offices to where such teams are working.
Get used to making the case for change to colleagues who may not immediately understand. Most people are terrified of failure, so you have to help them understand the “fail fast” mind-set that goes along with speed boat development of multiple prototypes coming out of the VDM ecosystem. You may also find yourself explaining to skeptics why it’s important to devote as much as half of your company’s system capacity to these data labs.
Striking the right balance also involves recognizing that, for all the flexibility we get from VDMs and postwaterfall iterative and incremental development models, agile does not totally replace the need for waterfall or centralized architecture functions in your organization. Yes, you need to start small, scale fast, and not try to boil the ocean by applying new innovations to the whole company right away. But you’ll eventually need to leverage centralized systems to create fully mature solutions and spread them to other parts of the company. Centralized architectures and centralized applications are hallmarks of any major enterprise, and you absolutely need them in the mix at some point in the maturation process.
Once you open up data access with the Agile Data Platform and its LDA, people will be free to explore the data and ask deeper questions about customer life cycles and relationships. This presents new possibilities, but also new challenges. That’s where the next stage in the Sentient Enterprise journey comes in: the Behavioral Data Platform.