
Chapter Six
Measurement of Business Impact
One of the most daunting challenges in corporate training is the measurement of true business impact. Since training is a “soft” expenditure item, organizations are constantly trying to answer the question: “What business benefits are we achieving from this expense?”
Before discussing best practices and approaches to the measurement of impact, let me discuss the whole concept first.
In general, as this book describes throughout, I find a bit too much energy and worry focused in this area. Remember the principles of training measurement we discussed earlier: Is the information credible, specific, and actionable? When one tries to measure direct business impact, the results rarely fit these criteria, because, as we all know, for every business measure, there are usually many factors that have far more impact than training.
In most cases the reason an organization attempts to measure direct business impact is because they are not well aligned, the program is too expensive, or the training is not well regarded. Hence they try to use impact measures to try to “cost-justify” their programs.
One CLO I regard very highly told me he puts it this way.
“I ask my line of business customers if they believe in the value of workforce learning and development as part of their business strategy. If they say yes, then I know my measurements should focus on alignment and utility. If they say no, then I know that no amount of ROI or other such measurements will convince them, and I have other problems to solve.”
In the meantime, there are many ways to measure the business impact of training with the goal of not “cost-justifying training” but, rather, better understanding precisely how programs work and how they can be improved or, perhaps, even eliminated.
Of course, despite these challenges, we still want to know how our training programs drive value—because ultimately this will give us actionable information about how to make them better. So how can we use the principles discussed earlier to most effectively measure impact?
Simplifying the Problem
Let us go back to the Impact Measurement Framework and reorient it using two dimensions. In Figure 6.1, all possible measures of training are organized on two axes: those which are qualitative versus quantitative on the vertical axis, and those which are truly business measures (for example, sales and customer satisfaction) and those which are training measures (for example, learner satisfaction and scores) on the horizontal axis.
Figure 6.1 Measuring Impact: The Options

Now try to locate each of the nine measures from Learning Impact Measurement Framework on this chart. Most can be placed in the shaded boxes, which use the techniques discussed in this book: indicators of impact through surveys, interviews, scores, and other more qualitative approaches.
So how do all these measures directly correlate to business results? As shown in the upper-right quadrant of Figure 6.1, we have found essentially two easy, repeatable approaches: line-of-business-specific measures and performance management measures.
Use Line-of-Business-Specific Measures
In every organization, there are already a large number of business measurements already being recorded. Sales managers are measuring sales productivity and revenue. Call center managers are measuring call times, customer satisfaction, and sales volume per call. Hospitals are measuring patient satisfaction, patient outcomes, errors, skin conditions, falls, and many other operational errors. Financial services companies are measuring loan processing errors, customer loyalty, and so on. These measures are part of the organization’s “balanced scorecard” or general management processes.
During the performance consulting process (again we reinforce why this is so important), which starts with the business unit signoff form, the program manager should identify which of these existing metrics represents an important measure of the problem. These “line-of-business measures” are usually not enough to fully diagnose the solution because they measure the “outcome” and not the “cause” of the problem. To drive impact, focus on improvements to these existing measures.
Once these sources of data have been identified, then follow the performance consulting process shown in Figure 6.2 to diagnose the causes of the problem to be solved. These root causes, which can also be measured, will then lead to the right training solution.
If the problem identified is vague (for instance, “We’re not selling enough of product A”), then a solution cannot be prescribed. It must be broken down to its cause (for example, “Our sales reps are not demonstrating the product in enough detail to overcome competitor A’s land mines”). Once the root cause (or causes) is identified, it is a simple step to identify some way of quantifying this problem (for instance, “Seventy-five percent of the demonstrations we do should directly cover topics A, B, and C”).
Figure 6.2 Performance Consulting Process Drives Problem Identification

Example: Insurance Call Center Training
A client of ours, a major insurance company, operates a large call center staffed with claims agents. These individuals take calls from customers who file claims. There are many steps to this process: looking up the customer in the system, identifying what coverage they have, taking information and phone recordings describing the claim, collecting supporting documentation and receipts, judging which claim items are covered and which are not, and then settling the claim. Overall, this is a highly complex role that can have a major impact on the profitability of the company.
This particular company measures many aspects of this operation: number of calls, time to take a claim, time to complete a claim, error rates in claim processing, as well as average claim amounts correlated against many demographics. As one can see, some of these metrics capture customer service measures (time to take a claim, time to complete a claim), some capture quality measures (error rates, claim amounts), and some capture profitability (average claim amounts by different agents handling similar customers and similar claims).
The “problem” identified by the customer service department was that “claim processing is too slow,” therefore the group needs more training. This particular training department was very savvy, so they saw right through this “problem” and realized that they had to do a much deeper diagnosis of the problem. They implemented some call center monitoring software (from a company called Epiance) that analyzes average time between different steps in the claims process. These steps go on for many weeks and months, so the database collected was very large.
As they started to analyze this data, some interesting facts emerged: some of the agents (about 10 percent) were filing claims at 3 to 4X the speed of others. These “speedy agents” were believed to be the senior, most highly trained experts who best understood the system and process. Most of the agents (70 percent) were processing claims at similar rates. And a small number of “slow” agents (20 percent) were processing claims far slower than the average. Now the question was: How do we improve speed? Do we see what the “speedy” agents are doing and try to replicate those skills? Or do we look at what the “slow” agents are doing and try to fix their problems?
Well luckily, this particular training manager was very business-focused. He decided to go one step further, and he also looked at the “audit rates” of different groups. What he found was astounding. The “fast” agents were actually skipping several important steps in the process (such as checking whether or not a claim was covered). They were being rewarded for “speed” but not “quality”—and of course this was costing the company a lot of money. The “slow” agents were actually delivering the highest levels of customer service, and they were paying approximately the same claim amounts as the “average.”
The resulting learning programs were then focused on three things: (1) assuring that all agents clearly understood the importance of each and every step in the process; (2) making sure that agents knew how to “speed up” calls through careful interviewing and objection handling; and (3) making sure all agents were familiar with the systems that support each step. They also added an important module about company profitability and how the company’s claims processing strategy supported both their customer service and profitability strategy.
Once this was done, it was fairly easy to figure out what to measure. As the program progressed, the team measured these three groups again, measured claim quality and customer service, and looked at whether or not claim amounts were increasing. As this data was collected, the program was “tweaked” to further reinforce process and not systems training. The result, a “training program” that had tremendously high return to the business.
Do you implement a rigorous performance consulting process? Fewer than 40 percent of our respondents claim to have such a process, and under 10 percent consider themselves excellent at this step. I challenge you to implement one immediately. It is the single greatest contributor to high-impact learning programs.1
How do you implement such a process? Consider the process shown in the following diagram (compliments of a large bank). In this organization, as Figure 6.3 shows, learning consultants are trained to start at the top (business measures) and work their way down to specific skills and knowledge that drive these results.
The training director who sponsors this process told us that he is rarely, if ever, asked to quantify the business value of the training. This process gets them so intimately involved in the business issues at hand that the line managers never question the value or alignment of the training.
Once the program manager or consultant has gone through this diagnosis and identified the existing measures that are impacted, it is easy to then monitor these measures and the related causes to see results.
Example: Pharmaceutical Sales
Consider another example. In one particular pharmaceutical company, the sales organization (more than seven thousand sales representatives) uses a process called “field trip reports” to measure the effectiveness of a sales call. The sales manager goes out with the sales rep for certain calls and fills out an assessment form that grades the sales rep on a variety of measures (for example, ability to create rapport, ability to diagnose the right problem, ability to effectively present the right product, and so on). The field trip reports are then sent to an electronic database, which resides in the sales training organization. The sales training organization can look at these reports and analyze them by sales call type, sales rep, manager, geography, and so on (see Figure 6.4).
Figure 6.3 A Step-by-Step Process for Performance Consulting

Figure 6.4 Pharmaceutical Sales Measurement Example
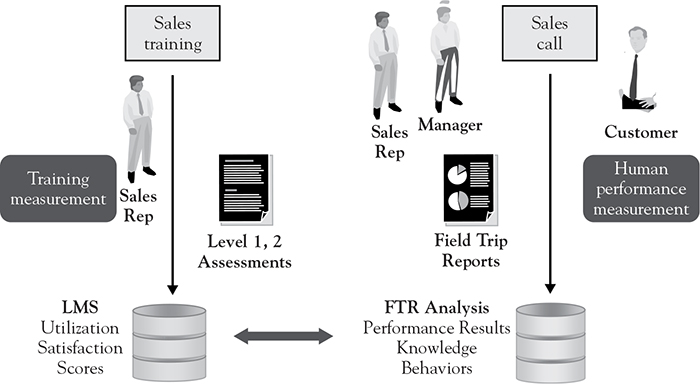
The field trip reports follow a standardized format, which identifies the salesperson’s success at various skills, competencies, and product-related knowledge in the field. These field trip reports are, in essence, an indicator of sales volume that has already been categorized. They are a direct measure of “individual performance” in the Bersin model.
For this company, the sales training manager can directly view the results and impact of a new program by monitoring the data in the field trip reports. The sales training manager does not have to guess at other business measures—he or she can build on an existing measure that is well-understood. There is no reason to measure “level 3” or “level 4” data, because it is already being captured in a highly relevant way.
Example: Healthcare Outcome Data
A third example of the use of line-of-business data is in healthcare. One of the interviewees from this research is the CLO of a small chain of hospitals. The most critical part of the training operation is the training of clinical personnel—mostly nurses and other service-delivery staff.
In the hospital and healthcare industry, there are a wide variety of existing measures being captured every day. In this particular case, the hospital tracks falls, needle pricks, infections, skin conditions, and a wide variety of other health-related measures for patients in the hospital. The organization uses a third party (Picker Institute) to measure patient satisfaction. This data can be compared against many other hospitals of similar size and structure.
The CLO uses these two data sources to identify problem areas that must be addressed by clinical training. He or she can see whether trends are good or bad, view data by hospital and by department, and by manager. This data has become so valuable that the CLO no longer needs to use a needs-analysis process to determine where to apply training resources—he or she can “chase the needle” and make sure that the training investments are always aligned and focused on the most critical problems at hand.
When working closely with lines of business in the organization and using a performance consulting process, many of these systems are already in place. The goal should be to use this information, and capture only the data that can be used to measure impact and gain actionable information for improvement.
Bottom line: look for existing business measures during your needs analysis and performance consulting and use them to measure the effectiveness of your programs.
Integrate with Performance Management Processes
A second, fast-growing way to measure and monitor the business impact of training is to monitor and measure the change in manager-driven performance ratings of employees. “Performance management,” the term used to describe the process of coaching, goal-setting, appraising, and developing employees, is now a very hot topic in corporate HR.
Most companies have a performance management process2 that is designed with seven steps: goal development, goal alignment, manager assessment, self-assessment, competency assessment, 360-degree assessment, and development planning. The outcome of this process is typically a performance “rating” (typically a number) and a series of competency assessments. These competency assessments are used to gauge an employee’s “potential” for improvement and future roles. The development plan is then designed to fill in these competency gaps and help the employees improve their performance.
How does this relate to training? In many ways. First and foremost, if your organization is using a well-designed performance management process, then managers are regularly assessing employees against goal attainment and competencies. Much of this information is now being automated and put online, through the implementation of automated performance management software. (Most LMS vendors have such software.)
Organizations that have an automated performance management process (or an integrated talent management platform) can actually see the impact of training on performance ratings and view how well learning programs are being correlated to individual and workgroup goals. In fact, if you have access to this system, you can see where development gaps exist, where the most urgent development needs are, and how individual groups and teams are improving before and after training. Best of all, this work is done by the individual line managers—the person who can best evaluate an employee’s workplace performance and skills.
Example: Randstad Onboarding Process
One of the detailed case studies included in this book is the case study on Randstad’s onboarding program (see Appendix I: Case Study A: Randstad Measures Onboarding). As part of that training program, the Randstad CLO monitors and measures the performance ratings of new hires to make sure they are achieving the skills they need through the onboarding process (see Figure 6.5).
This evaluation is not an evaluation of the training itself but, rather, an evaluation of the employee, which takes place within the performance management process. By tying the training to job-related competencies, this data can be easily captured to truly measure the impact of the L & D programs.
Figure 6.5 Randstad Competency Assessment During Performance Management
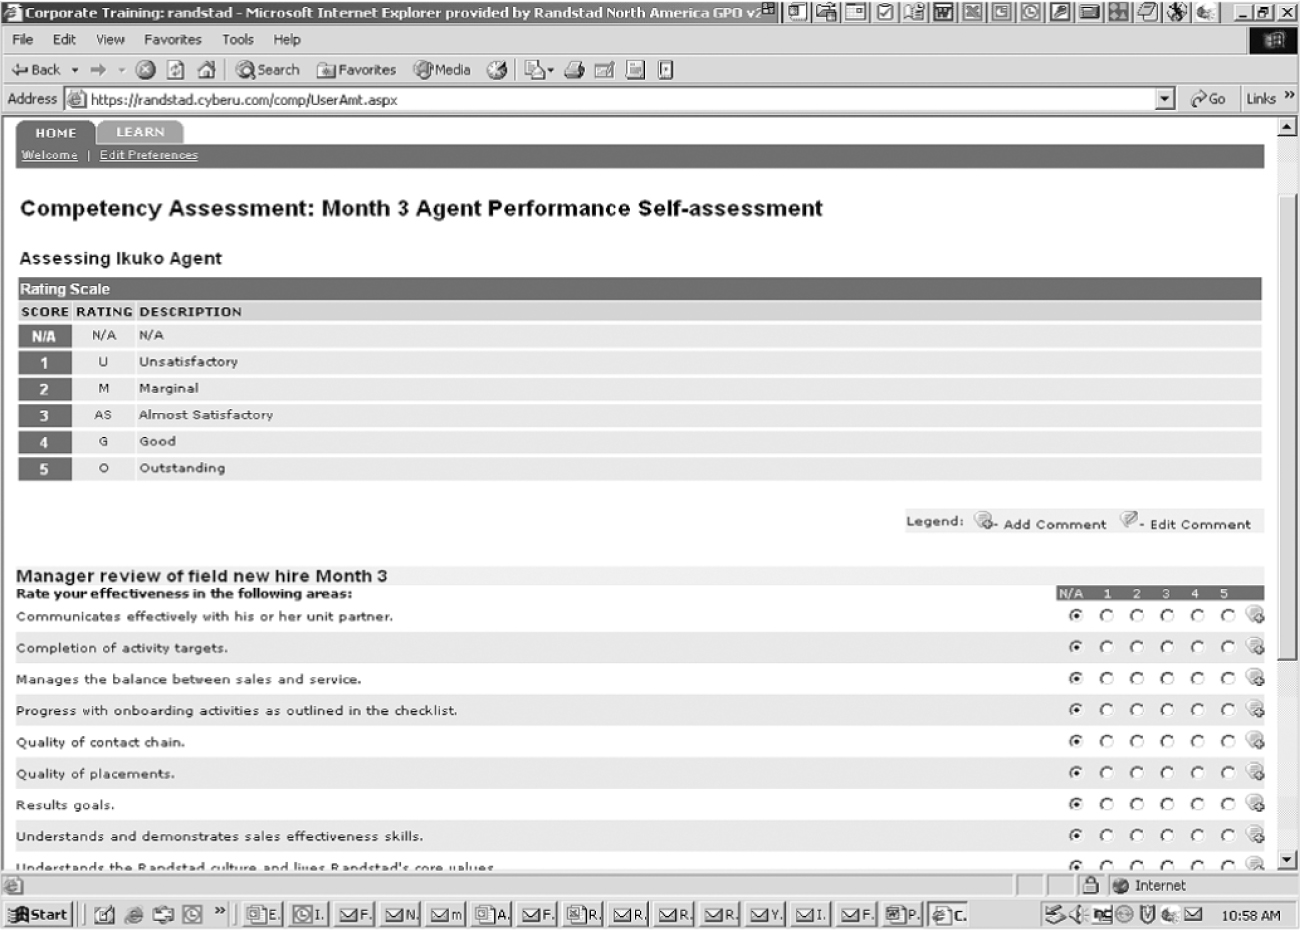
Although many organizations do not yet have an integrated and automated performance and learning management platform, 60 percent or more of companies participating in this research have some type of enterprise performance management process. When spending large sums of money on training that supports particular job roles (for example, management training, executive education, service center training, or onboarding), seek out this data to better understand and measure the true impact of the training on employee performance, readiness for promotion, and other measures.
Notes
1. For more information, see The High-Impact Learning Organization: WhatWorks® in The Management, Organization, and Governance of Corporate Training. Bersin & Associates, June 2005. Available at www.bersin.com.
2. For more information, see High Impact Performance Management®: Comprehensive Industry Study, in Market Analysis, Trends, Best Practices, and Vendor Profiles. Bersin & Associates/Josh Bersin, June 2006. Available at www.bersin.com.