
This chapter presents the progress to date in the deployment of IPv6. There are many sources of information on this. We are now in the rapid adoption phase (finally).

A table depicts the global I P v 6 adoption in the top five countries for deployment. Belgium ranks highest at 66%, and U S A ranks least at 56%.
Global IPv6 adoption
This widget shows a summary of the deployment percentages in the top five countries (all already above 50%). The “Internet core” shows readiness of the Internet backbones for IPv6. The “Global content” shows how much of the popular content is available over IPv6 (almost always over both IPv4 and IPv6 at this time – there is very little content available over just IPv6). The “Users” indicates what percentage of users can access IPv6 content.

A world map represents the deployment of all countries. Western countries have a higher deployment percentage than the rest of the world.
Deployment by country, Cisco
IPv6 deployment: 50.2%
Prefixes: 33.69%
Transit AS: 67.47%
Content: 56.66%
Users: 34.9%
The “Prefixes” value is from measurements done by APNIC and Eric Vyncke. It shows the percentage of “allocated” prefixes that are “live” (actually have traffic going to them or at least have entries in the BGP routing tables). Typically, a lot of organizations have made the first step of obtaining a block of addresses from their RIR (Regional Internet Registry), but only some of those have gone live at this time.
The “Transit AS” value has to do with autonomous systems used only for “transit” – information being source and destination ASs. This indicates the readiness of the Internet core.
The “Content” value has to do with how many of the popular (“Alexa 500”) websites are available over IPv6.
The “Users” value is the percentage of users that connect to Google’s search page over IPv6. Note that language and national blocking of google.com (e.g., in China) affect this number.
The overall deployment value is a weighted combination of the above values.
Country | IPv6 % |
|---|---|
Belgium | 63.7 |
Germany | 59.07 |
Uruguay | 55.26 |
Greece | 53.93 |
Malaysia | 52.81 |
Finland | 51.13 |
Vietnam | 50.85 |
United States | 50.36 |
Japan | 49.13 |
Thailand | 49.02 |
India | 49.01 |
Brazil | 48.66 |
United Kingdom | 48.25 |
France | 47.95 |
Estonia | 47.42 |
Portugal | 46.89 |
Canada | 46.40 |
Mexico | 45.85 |
Hungary | 44.14 |
Norway | 42.80 |
Ireland | 40.42 |
Peru | 39.52 |
Australia | 38.96 |
Singapore | 38.68 |
Saudi Arabia | 38.31 |
Czech Republic | 37.30 |
Sweden | 36.81 |
Romania | 33.78 |
So How Did IPv4 Depletion Go at RIRs?
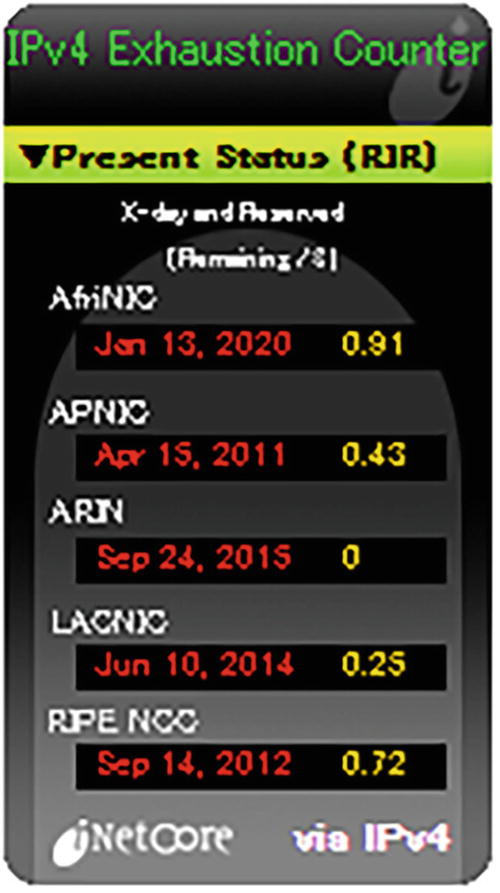
A table includes the information on the I P v 4 exhaustion counter available on the I P v 6 website.
IPv4 exhaustion counter, toward the end of IPv4 available in RIRs
IANA ran out of IPv4 allocable (public) addresses on February 3, 2011. After that, they could not provide any more IPv4 blocks to the RIRs. It didn’t take long for the RIRs to go through their remaining inventory.
APNIC (AsiaPac + Japan) was the first RIR to reach the “end of normal allocation,” on April 15, 2011.
RIPE NCC (EU and Middle East) was next on September 14, 2012.
LACNIC (Latin America) stopped normal allocation on June 10, 2014.
ARIN (North America except for Mexico) ran completely out on September 24, 2015.
AfriNIC (African continent) stopped normal allocation on January 13, 2020.
Apart from ARIN, the RIRs decided to stop allocating IPv4 addresses when they reached their final /8 (16.7 million) addresses. After that they could only be given out in small blocks (e.g., 1024 addresses), for special purposes (such as migration to IPv6). ARIN chose to keep doing allocation until the barrel was completely empty.
Some ISPs, telcos, and cloud providers tried to get as many IPv4 addresses as they could, but many of those have now run out. They can buy a few on the IP address market, but even those will run out at some point, and even now the price of public IPv4 addresses continues to rise.
Google Statistics
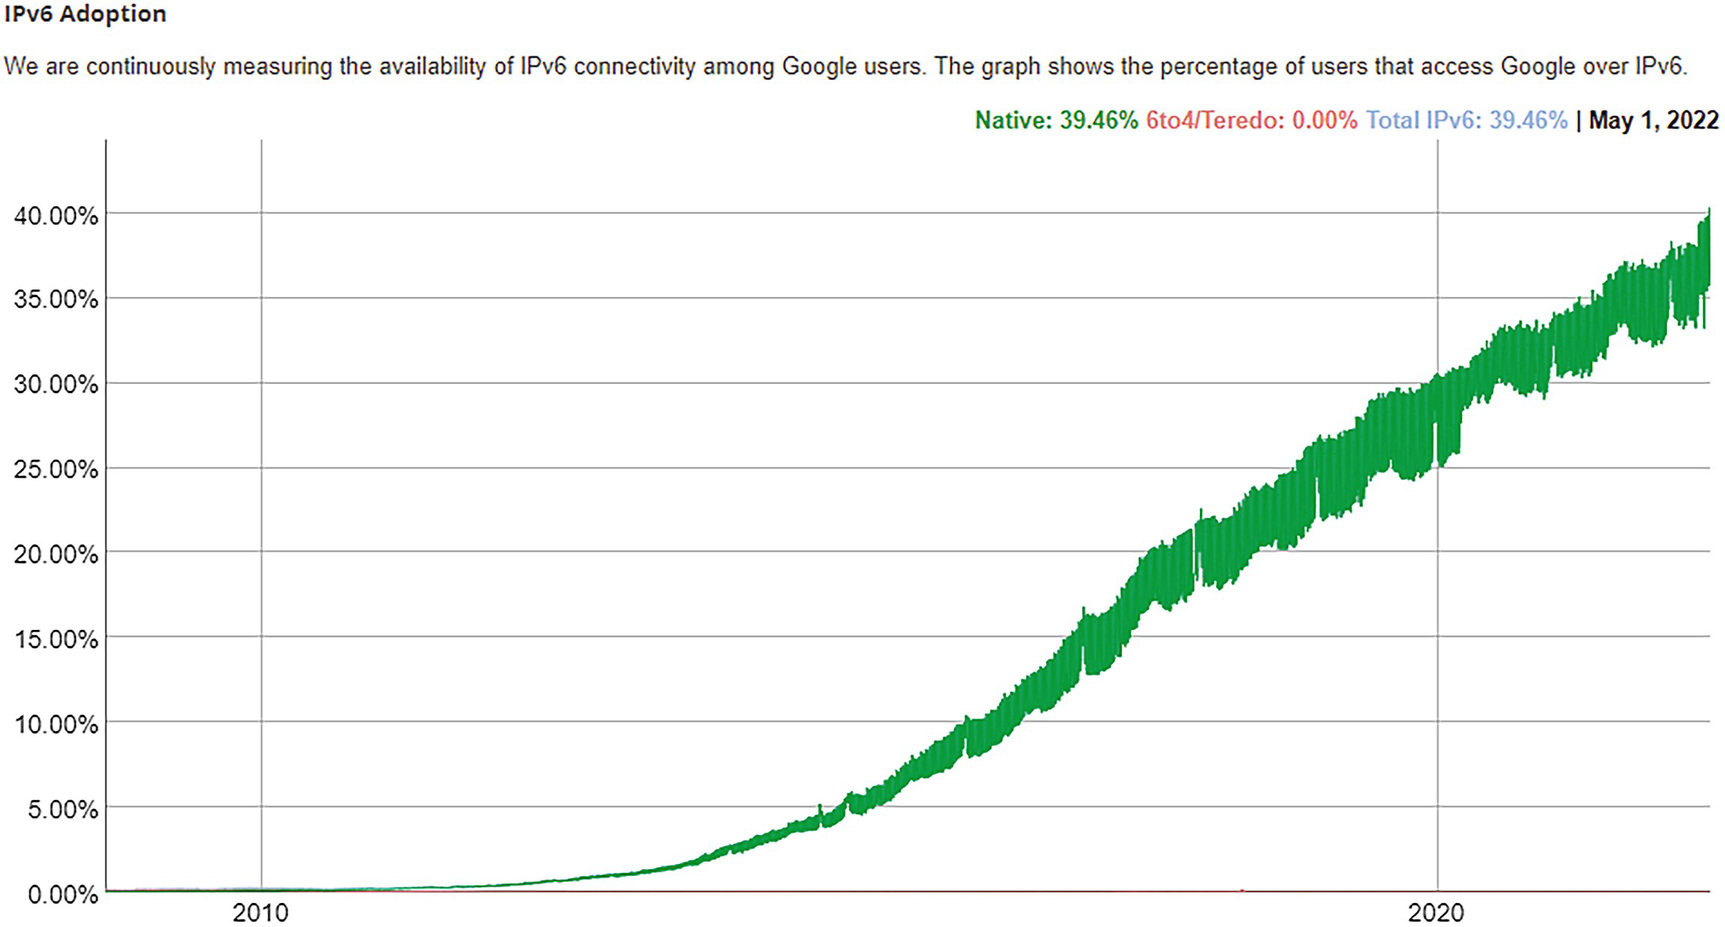
A graph depicts the percentage of connections over I P v 6 among google users over the years. The graph shows a considerable increase from 2010 to 2020.
Percentage of connections to google.com globally over IPv6
Google tracks the number of connections to its search engine over both IPv4 and IPv6. The preceding chart shows the growth of IPv6 as a percentage of total usage. As of May 1, 2022, connections over IPv6 represent about 40% of all connections, globally. Note that the actual percentage is likely higher, due to distortion caused by Happy Eyeballs.2 This is a modification to all recent browsers that will attempt to connect IPv4 or IPv6, depending on which one connected in the shortest time. This can result in a situation where both the user and the website both support IPv6, but they also both support IPv4, and for whatever reason, connection over IPv4 was faster. You can see the current version of this chart at www.google.com/intl/en/ipv6/statistics.html#tab=ipv6-adoption .3
For full details on Happy Eyeballs, see RFC 8305,4 “Happy Eyeballs Version 2: Better Connectivity Using Concurrency,” December 2017.
You can see the incredible increase in deployment globally from when The Second Internet book was written. At that time, the Google stats showed .25% adoption. In the intervening years, adoption has increased by over 100 times, even with Happy Eyeballs.
The reason the line is wide vertically is actually quite interesting. It seems that usage is highest on weekends and drops on weekdays. This is because more people have IPv6 at home than they do at work.
Google also breaks down their statistics per country. You can see the current version of this information at www.google.com/intl/en/ipv6/statistics.html#tab=per-country-ipv6-adoption .5
Country | IPv6 % |
|---|---|
Belgium | 53.17 |
Germany | 41.72 |
Greece | 35.99 |
United States | 35.24 |
Malaysia | 34.13 |
Uruguay | 34.07 |
India | 32.59 |
Vietnam | 32.19 |
Japan | 29.66 |
Switzerland | 28.94 |
Brazil | 27.68 |
Taiwan | 25.97 |
France | 24.62 |
Estonia | 24.35 |
Finland | 23.80 |
Mexico | 22.92 |
Canada | 22.77 |
United Kingdom | 22.71 |
Hungary | 20.44 |
Portugal | 20.06 |
Ecuador | 19.79 |
Thailand | 18.82 |
Ireland | 18.70 |
Trinidad and Tobago | 17.65 |
New Zealand | 17.11 |
Netherlands | 16.75 |
Peru | 16.62 |
Australia | 15.37 |
Romania | 12.95 |
Norway | 12.27 |
Puerto Rico | 12.26 |
Bolivia | 11.90 |
Czechia | 10.87 |
Slovenia | 10.46 |
Guatemala | 9.51 |
Saudi Arabia | 8.97 |
Note that these values are based on actual measurements but are heavily influenced by English-speaking ability (the Google site is in English) and per-country restrictions (China blocks Google). Most of the other countries are below 1%.
Another good source of statistics on IPv6 adoption from actual measurements can be found at www.vyncke.org/ipv6status/ .6 This site breaks it down by websites, email, and DNS (from Alexa).
Predictions for Future Years

A graph predicts the future I P v 6 deployment on the basis of past data of google users. It shows that 100% deployment can be achieved by 2028.
Predicted end of migration to IPv6
Summary
IPv6 deployment is proceeding well globally. Most developed countries are already over 50% of all traffic going over IPv6. The adoption curve for IPv6 from Google (for percentage of connections to google.com over IPv6) is a strong indication of how this is progressing. That is a classic adoption curve.