Chapter 2. Analyzing Technical Goals and Tradeoffs
This chapter provides techniques for analyzing a customer’s technical goals for a new network design or network upgrade. Analyzing your customer’s technical goals can help you confidently recommend technologies that will perform to your customer’s expectations.
Typical technical goals include scalability, availability, network performance, security, manageability, usability, adaptability, and affordability. Of course, there are tradeoffs associated with these goals. For example, meeting strict requirements for performance can make it hard to meet a goal of affordability. The section “Making Network Design Tradeoffs” later in this chapter discusses tradeoffs in more detail.
One of the objectives of this chapter is to give you terminology that will help you discuss technical goals with your customer. Network designers and users have many terms for technical goals, and, unfortunately, many different meanings for the terms. This chapter can help you choose terminology that has technical merit and is understandable by business and IT customers.
This chapter concludes with a checklist to help you determine whether you have addressed all your customer’s technical goals and constraints.
Scalability
Scalability refers to how much growth a network design must support. For many enterprise network design customers, scalability is a primary goal. Many large companies add users, applications, additional sites, and external network connections at a rapid rate. The network design you propose to a customer should be able to adapt to increases in network usage and scope.
Planning for Expansion
Your customer should help you understand how much the network will expand in the next year and in the next 2 years. (Ask your customer to analyze goals for growth in the next 5 years also, but be aware that not many companies have a clear 5-year vision.)
You can use the following list of questions to analyze your customer’s short-term goals for expansion:
• How many more sites will be added in the next year? The next 2 years?
• How extensive will the networks be at each new site?
• How many more users will access the corporate internetwork in the next year? The next 2 years?
• How many more servers will be added to the internetwork in the next year? The next 2 years?
Expanding Access to Data
Chapter 1, “Analyzing Business Goals and Constraints,” talked about a common business goal of expanding access to data for employees who use enterprise networks. Managers empower employees to make strategic decisions that require access to sales, marketing, engineering, and financial data. In the 1970s and early 1980s, this data was stored on mainframes. In the late 1980s and the 1990s, this data was stored on servers in departmental LANs. Today, this data is again stored on centralized mainframes and servers.
In the 1990s, networking books and training classes taught the 80/20 rule for capacity planning: 80 percent of traffic stays local in departmental LANs, and 20 percent of traffic is destined for other departments or external networks. This rule is no longer universal and is rapidly moving to the other side of the scale. Many companies have centralized servers residing in data centers. In addition, corporations increasingly implement intranets that enable employees to access centralized web servers using Internet Protocol (IP) technologies.
At some companies, employees can access intranet web servers to arrange business travel, search online phone directories, order equipment, and attend distance-learning training classes. The web servers are centrally located, which breaks the classic 80/20 rule.
As Chapter 1 also mentioned, there has been a trend of companies connecting internetworks with other companies to collaborate with partners, resellers, suppliers, and strategic customers. The term extranet is sometimes used to describe an internal internetwork that is accessible by outside parties. If your customer has plans to implement an extranet, you should document this in your list of technical goals so that you can design a topology and provision bandwidth appropriately.
In the 1980s and 1990s, mainframes running Systems Network Architecture (SNA) protocols stored most of a company’s financial and sales data. In recent years, the value of making this data available to more than just financial analysts has been recognized.The business goal of making data available to more departments often results in a technical goal of using the mainframe as an incredibly powerful database server.
The business goal of making more data available to users results in the following technical goals for scaling and upgrading corporate enterprise networks:
• Connect separated departmental LANs into the corporate internetwork.
• Solve LAN/WAN bottleneck problems caused by large increases in internetwork traffic.
• Provide centralized servers that reside in a data center.
• Make mainframe data accessible to the enterprise IP network.
• Add new sites to support field offices and telecommuters.
• Add new sites and services to support secure communication with customers, suppliers, resellers, and other business partners.
Constraints on Scalability
When analyzing a customer’s scalability goals, it is important to keep in mind that there are impediments to scalability inherent in networking technologies. Selecting technologies that can meet a customer’s scalability goals is a complex process with significant ramifications if not done correctly. For example, selecting a flat network topology with Layer 2 switches can cause problems as the number of users scales, especially if the users’ applications or network protocols send numerous broadcast frames. (Switches forward broadcast frames to all connected segments.)
Subsequent chapters in this book consider scalability again. Chapter 4, “Characterizing Network Traffic,” discusses the fact that network traffic (for example, broadcast traffic) affects the scalability of a network. Part II, “Logical Network Design,” provides details on the scalability of routing and switching protocols. Part III, “Physical Network Design,” provides information on the scalability of LAN and WAN technologies and internetworking devices. Remember that top-down network design is an iterative process. Scalability goals and solutions are revisited during many phases of the network design process.
Availability
Availability refers to the amount of time a network is available to users and is often a critical goal for network design customers. Availability can be expressed as a percent uptime per year, month, week, day, or hour, compared to the total time in that period. For example, in a network that offers 24-hour, 7-days-a-week service, if the network is up 165 hours in the 168-hour week, availability is 98.21 percent.
Network design customers don’t use the word availability in everyday English and have a tendency to think it means more than it does. In general, availability means how much time the network is operational. Availability is linked to reliability but has a more specific meaning (percent uptime) than reliability. Reliability refers to a variety of issues, including accuracy, error rates, stability, and the amount of time between failures.
Note
Sometimes network engineers classify capacity as part of availability. The thinking is that even if a network is available at Layer 1 (the physical layer), it is not available from a user’s point of view if there is not enough capacity to send the user’s traffic.
For example, Asynchronous Transfer Mode (ATM) has a connection admission control function that regulates the number of cells allowed into an ATM network. If the capacity and quality of service (QoS) requested for a connection are not available, cells for the connection are not allowed to enter the network. This problem could be considered an availability issue. However, this book classifies capacity with performance goals. Availability is considered simply a goal for percent uptime.
Availability is also linked to redundancy, but redundancy is not a network goal. Redundancy is a solution to a goal of high availability. Redundancy means adding duplicate links or devices to a network to avoid downtime. Redundant network topologies are becoming increasingly important for many network design customers who want to ensure business continuity after a major fault or disaster. Chapter 5, “Designing a Network Topology,” covers designing redundant network topologies in more detail.
Availability is also associated with resiliency, which is a word that is becoming more popular in the networking field. Resiliency means how much stress a network can handle and how quickly the network can rebound from problems including security breaches, natural and unnatural disasters, human error, and catastrophic software or hardware failures. A network that has good resiliency usually has good availability.
Disaster Recovery
Most large institutions have recognized the need for a plan to sustain business and technical operations after natural disasters, such as floods, fires, hurricanes, and earthquakes. Also, some large enterprises (especially service providers) must plan how to recover from satellite outages. Satellite outages can be caused by meteorite storms, collisions with space debris, solar flares, or system failures. Unfortunately, institutions have also found the need to specify a recovery plan for unnatural disasters, such as bombs, terrorist attacks, riots, or hostage situations. A disaster recovery plan includes a process for keeping data backed up in one or more places that are unlikely to be hit by disaster, and a process for switching to backup technologies if the main technologies are affected by a disaster.
Although this book doesn’t cover the details of disaster recovery planning, the concepts in this book can be applied to the process of planning for a disaster. Not surprisingly, a top-down approach is recommended, with an emphasis on planning before implementing. One goal of the planning process should be to recognize which parts of the network are critical and must be backed up. A good understanding of the organization’s business purpose is needed to understand which devices, network links, applications, and people are critical. As is the case with top-down network design, business goals must be analyzed before selecting technologies and devices that will be one component of the implementation.
Note
Don’t underestimate the importance of having enough staff to activate a disaster recovery plan. Have you figured out what to do if the disaster involves a serious disease where the server and network administrators need to be quarantined? This could be a justification for providing high-speed VPN access from workers’ homes and testing that capability before a disaster strikes.
One of the most important steps in disaster recovery planning is testing. Not only must the technology be tested, but employees must be drilled on the actions they should take in a disaster. If the people don’t survive, the technology won’t help much. Also, people should practice working with the network in the configuration it will likely have after a disaster when redundant servers or sites are in use. Although employees might object to emergency drills, especially if they are too frequent, periodic practice is a necessary part of achieving business continuity when a real disaster hits. The drills should be taken seriously and should be designed to include time and stress pressures to simulate the real thing.
Specifying Availability Requirements
You should encourage your customers to specify availability requirements with precision. Consider the difference between an uptime of 99.70 percent and an uptime of 99.95 percent. An uptime of 99.70 percent means the network is down 30 minutes per week, which is not acceptable to many customers. An uptime of 99.95 percent means the network is down 5 minutes per week, which might be acceptable, depending on the type of business. Availability requirements should be specified with at least two digits following the decimal point.
It is also important to specify a timeframe with percent uptime requirements. Go back to the example of 99.70 percent uptime, which equated to 30 minutes of downtime per week. A downtime of 30 minutes in the middle of a working day is probably not acceptable. But a downtime of 30 minutes every Saturday evening for regularly scheduled maintenance might be fine.
Not only should your customers specify a timeframe with percent uptime requirements, they should also specify a time unit. Availability requirements should be specified as uptime per year, month, week, day, or hour. Consider an uptime of 99.70 percent again. This uptime means 30 minutes of downtime during a week. The downtime could be all at once, which could be a problem if it’s not during a regularly scheduled maintenance window, or it could be spread out over the week. An uptime of 99.70 percent could mean that approximately every hour the network is down for 10.70 seconds. Will users notice a downtime of 10.70 seconds? Certainly some users will, but for some applications, a downtime of 10.70 seconds every hour is tolerable. Availability goals must be based on output from the first network design step of analyzing business goals, where you gained an understanding of the customer’s applications.
Five Nines Availability
Although the examples cited so far use numbers in the 99.70 to 99.95 percent range, many companies require higher availability, especially during critical time periods. Some customers might insist on a network uptime of 99.999 percent, which is sometimes referred to as five nines availability. For some customers, this requirement might be linked to a particular business process or timeframe. For example, the requirement might refer to the monthly closing of financial records or to the holiday season for a company that sells holiday gifts via catalog and web orders. On the other hand, some design customers might need, or think they need, five nines availability all the time.
Five nines availability is extremely hard to achieve. You should explain to a network design customer that to achieve such a level, redundant equipment and links will be necessary, as will extra staffing possibly, and extremely reliable hardware and software. Some managers will back down from such a requirement when they hear the cost, but, for others, the goal might be appropriate. If a company would experience a severe loss of revenue or reputation if the network were not operational for even short periods of time, five nines availability is a reasonable goal.
Many hardware manufacturers specify 99.999 percent uptime for their devices and operating systems and have real customer examples where this level of uptime was achieved. This might lead a naive network design customer to assume that a complex internetwork can also have 99.999 percent uptime without too much extra effort or cost. Achieving such a high level on a complex internetwork, however, is much more difficult than achieving it for particular components of the internetwork. Potential failures include carrier outages, faulty software in routers and switches, an unexpected and sudden increase in bandwidth or server usage, configuration problems, human errors, power failures, security breaches, and software glitches in network applications.
Note
Some networking experts say that 80 to 90 percent of failures are due to human errors, either errors made by local administrators or errors made by service provider employees (or the infamous backhoe operator). Avoiding and recovering from human errors requires skill and good processes. You need smart people thinking about availability all the time and processes that are precise without stifling thought. Good network management and troubleshooting play a role. Network management tools should provide immediate alerts upon failures and enough information for a network administrator to make a quick fix.
Consider a network that is used 24 hours a day for 365 days per year. This equates to 8760 hours. If the network can be down only 0.001 percent of the time, it can be down for only 0.0876th of an hour or about 5 minutes per year. If the customer says the network must be available 99.999 percent of the time, you better make it clear that this doesn’t include regularly scheduled maintenance time, or you better make sure that the network will have the capability to support in-service upgrades. In-service upgrades refer to mechanisms for upgrading network equipment and services without disrupting operations. Most internetworking vendors sell high-end internetworking devices that include hot-swappable components for in-service upgrading.
For situations where hot-swapping is not practical, it might be necessary to have extra equipment so there’s never a need to disable services for maintenance. In some networks, each critical component has triple redundancy, with one being active, one in hot standby ready to be used immediately, and one in standby or maintenance. With triple redundancy, you can bring a standby router down to upgrade or reconfigure it. After it is upgraded, you can then designate it as the hot standby, and take the previous hot standby down and upgrade it. You can then switch from the active to the hot standby and upgrade the active.
Depending on the network design, you might load share among the redundant components during normal operations. The key design decision is whether your users can accept degraded performance when some of the components are unusable. If all this sounds too complicated or expensive, another possibility is not to do it all yourself but put resources at collocation centers that can amortize the highly redundant equipment over many customers.
The Cost of Downtime
In general, a customer’s goal for availability is to keep mission-critical applications running smoothly, with little or no downtime. A method to help you, the network designer, and your customer understand availability requirements is to specify a cost of downtime. For each critical application, document how much money the company loses per hour of downtime. (For some applications, such as order processing, specifying money lost per minute might have more impact.) If network operations will be outsourced to a third-party network management firm, explaining the cost of downtime can help the firm understand the criticality of applications to a business’s mission. Specifying the cost of downtime can also help clarify whether in-service upgrades or triple redundancy must be supported.
Mean Time Between Failure and Mean Time to Repair
In addition to expressing availability as the percent of uptime, you can define availability as a mean time between failure (MTBF) and mean time to repair (MTTR). You can use MTBF and MTTR to calculate availability goals when the customer wants to specify explicit periods of uptime and downtime, rather than a simple percent uptime value.
MTBF is a term that comes from the computer industry and is best suited to specifying how long a computer or computer component will last before it fails. When specifying availability requirements in the networking field, MTBF is sometimes designated with the more cumbersome phrase mean time between service outage (MTBSO), to account for the fact that a network is a service, not a component. Similarly, MTTR can be replaced with the phrase mean time to service repair (MTTSR). This book uses the simpler and better-known terms MTBF and MTTR.
A typical MTBF goal for a network that is highly relied upon is 4000 hours. In other words, the network should not fail more often than once every 4000 hours or 166.67 days. A typical MTTR goal is 1 hour. In other words, the network failure should be fixed within 1 hour. In this case, the mean availability goal is as follows:
4000 / 4001 = 99.98 percent
A goal of 99.98 percent is typical for many companies.
When specifying availability using MTBF and MTTR, the equation to use is as follows:
Availability = MTBF / (MTBF + MTTR)
Using this availability equation allows a customer to clearly state the acceptable frequency and length of network outages.
Remember that what is calculated is the mean. The variation in failure and repair times can be high and must be considered as well. It is not enough to just consider mean rates, especially if you depend on external service agents (vendors or contractors) who are not under your tight control. Also, be aware that customers might need to specify different MTBF and MTTR goals for different parts of a network. For example, the goals for the core of the enterprise network are probably much more stringent than the goals for a switch port that affects only one user.
Although not all customers can specify detailed application requirements, it is a good idea to identify availability goals for specific applications, in addition to the network as a whole. Application availability goals can vary widely depending on the cost of downtime. For each application that has a high cost of downtime, you should document the acceptable MTBF and MTTR.
For MTBF values for specific networking components, you can generally use data supplied by the vendor of the component. Most router, switch, and hub manufacturers can provide MTBF and MTTR figures for their products. You should also investigate other sources of information, such as trade publications, to avoid any credibility problems with figures published by manufacturers. Search for variability figures and mean figures. Also, try to get written commitments for MTBF, MTTR, and variability values from the providers of equipment and services.
Network Performance
When analyzing technical requirements for a network design, you should isolate your customer’s criteria for accepting the performance of a network, including throughput, accuracy, efficiency, delay, and response time.
Many mathematical treatises have been written on network performance. This book approaches network performance in a practical and mostly nonmathematical way, avoiding the daunting equations that appear in mathematical treatments of performance. Although the equations are much simpler than they seem, they are usually not necessary for understanding a customer’s goals. The objective of this section is to offer an uncomplicated view of network performance, including real-world conclusions you can draw when there is no time to do a mathematical analysis.
Analyzing a customer’s network performance goals is tightly tied to analyzing the existing network, which is covered in Chapter 3, “Characterizing the Existing Internetwork.” Analyzing the existing network can help you determine what changes need to be made to meet performance goals. Network performance goals are also tightly linked to scalability goals. You should gain an understanding of plans for network growth before analyzing performance goals.
Network Performance Definitions
Many network design customers cannot quantify their performance goals beyond, “It has to work with no complaints from users.” If this is the case, you can make assumptions about throughput, response time, and so on. On the other hand, some customers have specific performance requirements, based on a service level that has been agreed upon with network users.
The following list provides definitions for network performance goals that you can use when analyzing precise requirements:
• Capacity (bandwidth): The data-carrying capability of a circuit or network, usually measured in bits per second (bps)
• Utilization: The percent of total available capacity in use
• Optimum utilization: Maximum average utilization before the network is considered saturated
• Throughput: Quantity of error-free data successfully transferred between nodes per unit of time, usually seconds
• Offered load: Sum of all the data all network nodes have ready to send at a particular time
• Accuracy: The amount of useful traffic that is correctly transmitted, relative to total traffic
• Efficiency: An analysis of how much effort is required to produce a certain amount of data throughput
• Delay (latency): Time between a frame being ready for transmission from a node and delivery of the frame elsewhere in the network
• Delay variation: The amount of time average delay varies
• Response time: The amount of time between a request for some network service and a response to the request
Optimum Network Utilization
Network utilization is a measurement of how much bandwidth is used during a specific time period. Utilization is commonly specified as a percentage of capacity. For example, a network-monitoring tool might state that network utilization on an Ethernet segment is 30 percent, meaning that 30 percent of the capacity is in use.
Network-analysis tools use varying methods for measuring bandwidth usage and averaging the usage over elapsed time. Usage can be averaged every millisecond, every second, every minute, every hour, and so on. Some tools use a weighted average whereby more recent values are weighted more prominently than older values. Chapter 3 discusses measuring network utilization in more depth.
Your customer might have a network design goal for the maximum average network utilization allowed on a segment. Actually, this is a design constraint more than a design goal. The design constraint states that if utilization on a segment is more than a predefined threshold, the segment should be divided into multiple segments or bandwidth must be added.
Optimum average network utilization is about 70 percent. A 70 percent threshold for average utilization means that peaks in network traffic can probably be handled without obvious performance degradation. Most WANs have less capacity than LANs, so more care is needed in selecting WAN bandwidth that can cover actual and reasonable variations. Customers have many options for technologies that can reduce bandwidth utilization on WANs, including advanced routing-protocol features and compression. Chapter 13, “Optimizing Your Network Design,” covers optimizing bandwidth utilization in more detail.
With LANs, less attention is paid to monitoring network utilization because many LANs are already overbuilt with full-duplex Gigabit Ethernet links to servers and 100-Mbps or Gigabit Ethernet links to clients. If configured for full-duplex operations, which is typical these days, a Fast or Gigabit Ethernet link supports simultaneous transmitting and receiving. So, in theory, a 100-Mbps Fast Ethernet segment could support 100 percent utilization of the transmit channel and 100 percent utilization of the receive channel, using 200 Mbps. However, total bandwidth in both directions isn’t used all the time in most cases. Consider the case of a client system communicating with a server. The client sends requests and the server responds, in lock step. The client doesn’t try to send at the same time as the server, so the bandwidth usage does not double on the client’s link to the Ethernet switch.
A point-to-point full-duplex link that connects a switch to a server or to another switch, on the other hand, could use all the bandwidth, depending on traffic patterns. Full-duplex Ethernet has become the standard method for connecting servers, switches, and end users’ machines. It’s an essential performance boost for servers, in particular. With full-duplex Ethernet, a switch can transmit the next client’s request at the same time the server is sending a response to a previous request. If the utilization exceeds about 70 percent of the full-duplex bandwidth, however, it’s probably time to upgrade to more bandwidth. Network traffic is bursty. You should provision both LAN and WAN capacity with the assumption that the average utilization will be exceeded during bursts.
Throughput
Throughput is defined as the quantity of error-free data that is transmitted per unit of time. Throughput is often defined for a specific connection or session, but in some cases the total throughput of a network is specified. Network novices consistently misuse the words throughput and bandwidth. Remember, bandwidth means capacity and is generally fixed. Throughput is an assessment of the amount of data that can be transmitted per unit of time. You measure throughput, which can vary depending on network performance characteristics and how you make the measurement. Bandwidth is a given.
Note
To understand bandwidth and throughput, think of a steel pipe that has a capacity of 100 gallons per minute. The pipe has fixed capacity (bandwidth). If just a trickle is coming through, throughput is low. If throughput is at 70 percent, you may have a flood.
Ideally, throughput should be the same as capacity. However, this is not the case on real networks. Capacity depends on the physical layer technologies in use. The capacity of a network should be adequate to handle the offered load, even when there are peaks in network traffic. (Offered load is the data that all nodes have to send at a particular moment in time.) Theoretically, throughput should increase as offered load increases, up to a maximum of the full capacity of the network. However, network throughput depends on the access method (for example, token passing or carrier sensing), the load on the network, and the error rate.
Figure 2-1 shows the ideal situation, where throughput increases linearly with the offered load, and the real world, where actual throughput tapers off as the offered load reaches a certain maximum.
Figure 2-1 Offered Load and Throughput

Throughput of Internetworking Devices
Some customers specify throughput goals in terms of the number of packets per second (pps) an internetworking device must process. (In the case of an ATM device, the goal is cells per second, or [cps].) The throughput for an internetworking device is the maximum rate at which the device can forward packets without dropping any packets.
Most internetworking vendors publish pps ratings for their products, based on their own tests and independent tests. To test an internetworking device, engineers place the device between traffic generators and a traffic checker. The traffic generators send packets ranging in size from 64 bytes to 1518 bytes for Ethernet. By running multiple generators, the investigation can test devices with multiple ports.
The generators send bursts of traffic through the device at an initial rate that is half of what is theoretically possible for test conditions. If all packets are received, the rate is increased. If all packets are not received, the rate is decreased. This process is repeated until the highest rate at which packets can be forwarded without loss is determined. Pps values for small frames are much higher than pps values for large frames, so be sure you understand which value you are looking at when reading vendor test results for an internetworking device.
Many internetworking devices can forward packets at the theoretical maximum, which is also called wire speed. The theoretical maximum is calculated by dividing bandwidth by packet size, including any headers, preambles, and interframe gaps. Table 2-1 shows the theoretical maximum pps for one 100-Mbps Ethernet stream, based on frame size.
To rate the pps value for a multiport device, testers send multiple streams of data through the device to multiple output ports. The extreme numbers that you sometimes see in vendor marketing material (for example, 400 million pps for the Cisco Catalyst 6500 switch) come from measurements made with multiple Gigabit Ethernet data flows, each using 64-byte packets.
Table 2-1 Theoretical Maximum Packets per Second (pps)

Application Layer Throughput
Most end users are concerned about the throughput for applications. Marketing materials from some networking vendors refer to application layer throughput as goodput. Calling it goodput sheds light on the fact that it is a measurement of good and relevant application layer data transmitted per unit of time.
It is possible to improve throughput, such that more data per second is transmitted, but not increase goodput, because the extra data transmitted is overhead or retransmissions. Keep in mind what throughput means (bytes per second). Are these good (useful) application layer bytes or simply bytes used by the protocol to get its job done? It is also possible to increase throughput by not using compression. More data is transmitted per unit of time, but the user sees worse performance.
A simple goal for throughput based on data-per-second rates between stations does not identify the requirements for specific applications. When specifying throughput goals for applications, make it clear that the goal specifies good (error-free) application layer data per unit of time. Application layer throughput is usually measured in kilobytes per second (KBps) or megabytes per second (MBps).
Work with your customer to identify throughput requirements for all applications that can benefit from maximized application layer throughput, such as file transfer and database applications. (Throughput is not important for all applications; for example, some interactive character-based applications don’t need large screen updates.) Explain to your customer the factors that constrain application layer throughput, which include the following:
• End-to-end error rates
• Protocol functions, such as handshaking, windows, and acknowledgments
• Protocol parameters, such as frame size and retransmission timers
• The pps or cps rate of internetworking devices
• Lost packets or cells at internetworking devices
• Workstation and server performance factors:
• Disk-access speed
• Disk-caching size
• Device driver performance
• Computer bus performance (capacity and arbitration methods)
• Processor (CPU) performance
• Memory performance (access time for real and virtual memory)
• Operating system inefficiencies
• Application inefficiencies or bugs
If necessary, work with your customer to identify application throughput problems caused by errors or inefficiencies in protocols, operating systems, and applications. Protocol analyzers are important tools for this. Chapter 3 discusses isolating performance problems in more detail.
Accuracy
The overall goal for accuracy is that the data received at the destination must be the same as the data sent by the source. Typical causes of data errors include power surges or spikes, impedance mismatch problems, poor physical connections, failing devices, and noise caused by electrical machinery. Sometimes software bugs can cause data errors also, although software problems are a less common cause of errors than physical layer problems. Frames that have an error must be retransmitted, which has a negative effect on throughput. In the case of IP networks, Transmission Control Protocol (TCP) provides retransmission of data.
For WAN links, accuracy goals can be specified as a bit error rate (BER) threshold. If the error rate goes above the specified BER, the accuracy is considered unacceptable. Analog links have a typical BER threshold of about 1 in 105. Digital circuits have a much lower error rate than analog circuits, especially if fiber-optic cable is used. Fiber-optic links have an error rate of about 1 in 1011. Copper links have an error rate of about 1 in 106.
For LANs, a BER is not usually specified, mainly because measuring tools such as protocol analyzers focus on frames, not bits; however, you can approximate a BER by comparing the number of frames with errors in them to the total number of bytes seen by the measuring tool. A good threshold to use is that there should not be more than one bad frame per 106 bytes of data.
On shared Ethernet, errors are often the result of collisions. Two stations try to send a frame at the same time and the resulting collision damages the frames, causing cyclic redundancy check (CRC) errors. Depending on the size of the Ethernet network, many of these collisions happen in the 8-byte preamble of the frames and are not registered by troubleshooting tools. If the collision happens past the preamble and somewhere in the first 64 bytes of the data frame, this is registered as a legal collision, and the frame is called a runt frame. A general goal for Ethernet collisions is that less than 0.1 percent of the frames should be affected by a legal collision (not counting the collisions that happen in the preamble).
A collision that happens beyond the first 64 bytes of a frame is a late collision. Late collisions are illegal and should never happen. Ethernet networks that are too large experience late collisions because stations sending minimum-sized frames cannot hear other stations within the allowed timeframe. The extra propagation delay caused by the excessive size of the network causes late collisions between the most widely separated nodes. Faulty repeaters and network interface cards (NIC) can also cause late collisions.
Collisions should never occur on full-duplex Ethernet links. If they do, there’s probably a duplex mismatch. Collisions on a properly configured full-duplex link have no meaning. Both stations sending at the same time is normal. Receiving while sending is normal. So, there is no need for collision detection and collisions shouldn’t occur. Chapter 3 has more to say about duplex mismatch problems and how to recognize if they cause errors on your networks.
Collisions also never occur on WAN links. Unfortunately, the output of the show interface serial command on Cisco routers includes a collision count. It should be ignored. Cisco programmers used a template for this part of the output. The template is based on the output from the show interface ethernet command. There are no collisions on a serial interface, regardless of the encapsulation or technology. Collisions occur only on carrier sense multiple access (CSMA) networks including Ethernet, 802.3, LocalTalk, Aloha, and 802.11 networks. Collisions are a normal part of the “management-by-contention” approach that defines CSMA. (And although LocalTalk and 802.11 use CSMA with collision avoidance, collisions can still occur.)
Accuracy usually refers to the number of error-free frames transmitted relative to the total number of frames transmitted. Accuracy can also characterize how often the network reorders sequences of packets. Packet reordering occurs in many situations, including the use of parallel switching fabrics within a single network device and the use of parallel links between routers. Although upper-layer protocols, such as TCP and Real-Time Transport Protocol (RTP), correct for the reordering of packets, the problem can cause minor performance degradation. Some applications don’t use a protocol that corrects the problem and thus might be more severely affected. Because the problem is often corrected, it can be hard to detect. IP routers are not designed to detect, let alone correct, packet reordering, and because they do not detect this condition, they cannot report the problem to network management software. Measurements must be made at end hosts. For example, you could use a protocol analyzer on an end-station host to detect the reordering of packets.
Efficiency
Efficiency is a term borrowed from engineering and scientific fields. It is a measurement of how effective an operation is in comparison to the cost in effort, energy, time, or money. Efficiency specifies how much overhead is required to produce a required outcome. For example, you could measure the efficiency of a method for boiling water. Does most of the energy go to actually boiling the water or does a lot of the energy get wasted heating the electrical wiring, the pot the water is in, and the air around it? How much overhead is required to produce the desired outcome?
Efficiency also provides a useful way to talk about network performance. For example, shared Ethernet is inefficient when the collision rate is high. (The amount of effort to successfully send a frame becomes considerable because so many frames experience collisions.) Network efficiency specifies how much overhead is required to send traffic, whether that overhead is caused by collisions, token passing, error reporting, rerouting, acknowledgments, large frame headers, a bad network design, and so on.
Large frame headers are one cause for inefficiency. We worry a lot less about frame headers than we used to when bandwidth was scarcer. Nonetheless, for networks where bandwidth is still (or may become) scarce, a good network performance goal is for applications that send bulk data to minimize the amount of bandwidth used by headers by using the largest possible frame the MAC layer allows. Using a large frame maximizes the amount of useful application data compared to header data and improves application layer throughput.
Figure 2-2 shows a bandwidth pipe used by small frames and the same pipe used by large frames. The header of each frame is shaded. Note that there is an interframe gap between each frame in addition to the headers. From the graphic, you can see that large frames use bandwidth more efficiently than small frames.
Figure 2-2 Bandwidth Utilization Efficiency for Small Versus Large Frames

The maximum frame size is a tradeoff with the BER discussed in the previous section. Bigger frames have more bits and hence are more likely to be hit by an error. If there were no errors, an infinitely big frame would be the most efficient (although not the most fair to other senders). If a frame is hit by an error, it must be retransmitted, which wastes time and effort and reduces efficiency. The bigger the frame, the more bandwidth is wasted retransmitting. So, because networks experience errors, frame sizes are limited to maximize efficiency and fairness. The maximum frame size for Ethernet, for example, is 1522 bytes, including the header, CRC, and an 802.1Q VLAN tag.
As is the case with many network design goals, there are tradeoffs associated with a goal of improving efficiency by using large frame sizes. On slow WAN links, the time to output a large frame is significant. The time to output a frame is called serialization delay. Serialization delay becomes an issue when applications that send large frames, such as file transfer, share a WAN link with applications that are delay-sensitive, such as voice and video. One solution is to use ATM, which divides frames into cells. Other solutions include the use of link-layer fragmentation and interleaving options, such as Frame Relay FRF.12, Multilink Frame Relay (FRF.16), and Multilink PPP.
Delay and Delay Variation
Users of interactive applications expect minimal delay in receiving feedback from the network. Voice and video applications also require minimal delay. In addition, voice and video applications require a minimal variation in the amount of delay that packets experience. Variations in delay, called jitter, cause disruptions in voice quality and jumpiness in video streams.
Applications that use the Telnet protocol are also sensitive to delay because the user expects quick feedback when typing characters. Telnet is becoming obsolete, but it hasn’t disappeared yet. With the Telnet remote echo option, the character typed by a user doesn’t appear on the screen until it has been acknowledged and echoed by the far end, and the near end has sent an acknowledgment for the echo. To help you recognize the need to design a network with low delay, you should determine if your customer plans to run any delay-sensitive applications, such as voice or video, or applications based on delay-sensitive protocols such as Telnet.
Causes of Delay
Any goals regarding delay must take into account fundamental physics. Despite science fiction stories that say differently, any signal experiences a propagation delay resulting from the finite speed of light, which is about 300,000 kilometers per second (186,000 miles per second). Network designers can also remember 1 nanosecond per foot. These values are for light traveling in a vacuum. A signal in a cable or optical fiber travels approximately two-thirds the speed of light in a vacuum.
Delay is relevant for all data transmission technologies but especially for satellite links and long terrestrial cables. Geostationary satellites are in orbit above the earth at a height of about 36,000 kilometers, or 24,000 miles. This long distance leads to a propagation delay of about 270 milliseconds (ms) for an intercontinental satellite hop. In the case of terrestrial cable connections, propagation delay is about 1 ms for every 200 kilometers (120 miles).
Another fundamental cause for delay is serialization delay, the time to put digital data onto a transmission line, which depends on the data volume and the speed of the line. For example, to transmit a 1024-byte packet on a 1.544-Mbps T1 line takes about 5 ms.
An additional fundamental delay is packet-switching delay. Packet-switching delay refers to the latency accrued when switches and routers forward data. The latency depends on the speed of the internal circuitry and CPU, and the switching architecture of the internetworking device. Latency also depends on the type of RAM that the device uses. Dynamic RAM (DRAM) needs to be refreshed thousands of times per second. Static RAM (SRAM) doesn’t need to be refreshed, which makes it faster, but it is also more expensive than DRAM. Low-end internetworking devices often use DRAM to keep the cost low.
Packet-switching delay can be quite small on high-end switches, in the 5- to 20-microsecond range for 64-byte Ethernet frames. Routers tend to introduce more latency than switches. The amount of latency that a router causes for packet switching depends on many variables, including the router architecture, configuration, and software features that optimize the forwarding of packets. Despite marketing claims by switch salespeople, you should not assume that a router has higher latency than a switch. A high-end router with a fast CPU, SRAM, optimized software, and a highly evolved switching fabric can outperform many low-end or medium-end switches.
Of course, a router has a more complicated job than a Layer 2 switch. In general terms, when a packet comes into a router, the router checks its routing table, decides which interface should send the packet, and encapsulates the packet with the correct data link layer header and trailer. Routing vendors, such as Cisco, have advanced caching mechanisms so that a frame destined for a known destination can receive its new encapsulation quickly without requiring the CPU to do any table lookup or other processing. These mechanisms minimize packet-switching delay.
Packet-switching speed depends on the type and number of advanced features that are enabled on a packet-switching device. When designing an internetwork fabric, consider the power that you will need to incorporate into the design to implement quality of service (QoS), Network Address Translation (NAT), IPsec, filtering, and so on. Consider the policies that your design customer wants to enforce and the effect they will have on packet-switching delay.
Packet-switching delay can also include queuing delay. The average number of packets in a queue on a packet-switching device increases exponentially as utilization increases, as you can see from Figure 2-3. If utilization is 50 percent, the average queue depth is one packet. If utilization is 90 percent, the average queue depth is nine packets. Without going into mathematical queuing theory, the general rule of thumb for queue depth is as follows:
Figure 2-3 Queue Depth and Bandwidth Utilization

Consider the following example. A packet switch has five users, each offering packets at a rate of 10 pps. The average length of the packets is 1024 bits. The packet switch needs to transmit this data over a 56-kbps WAN circuit. Putting all this together, you have the following equations:
Load = 5 × 10 × 1024 = 51,200 bps
Utilization = 51,200 / 56,000 = 91.4 percent
Average number of packets in the queue = (0.914) / (1 – 0.914) = 10.63 packets
By increasing bandwidth on a WAN circuit, you can decrease queue depth and hence decrease delay. Alternatively, to improve performance, you can use an advanced queuing algorithm that outputs certain types of packets first—for example, voice or video packets. Chapter 13 covers advanced router queuing techniques in more detail.
Delay Variation
As customers implement new digital voice and video applications, they are becoming concerned about delay and delay variation. Additionally, customers are becoming more aware of the issues associated with supporting bursty traffic on the same network that carries delay-sensitive traffic. If bursts in traffic cause jitter, audio and video streams experience problems that disrupt communications.
Desktop audio/video applications can minimize jitter by providing a jitter buffer. Display software or hardware pulls data from the buffer. The insulating buffer reduces the effect of jitter because variations on the input side are smaller than the total buffer size and therefore not obvious on the output side. The data is smoothed in the output, and the user experiences no ill effects from the input jitter.
If possible, you should gather exact requirements for delay variation from a customer. For customers who cannot provide exact goals, a good rule of thumb is that the variation should be less than 1 or 2 percent of the delay. For example, for a goal of an average delay of 40 ms, the variation should not be more than 400 or 800 microseconds.
Short fixed-length cells, such as ATM 53-byte cells, are inherently better than frames for meeting delay and delay-variance goals. To help understand this concept, consider the analogy of people trying to get onto an escalator. The escalator is like a bandwidth pipe. At first, each person gets onto the escalator in an orderly fashion and the delay is predictable. Then a school class arrives and the children are all holding hands, expecting to get onto the escalator all at once! What happens to your delay if you happen to be behind the children?
A gaggle of school children holding hands is analogous to a large frame causing extra delay for small frames. Consider the case of a user starting a file transfer using 1518-byte frames. This user’s data affects bandwidth usage and queuing mechanisms at internetworking devices, causing unexpected delay for other traffic. Good throughput for one application causes delay problems for another application.
Cell-relay technologies (ATM, for example) were designed to support traffic that is sensitive to delay and jitter. Depending on the class of service, ATM lets a session specify a maximum cell transfer delay (MCTD) and maximum cell delay variation (MCDV). Chapter 4 describes ATM service classes in more detail.
Response Time
Response time is the network performance goal that users care about most. Users don’t know about propagation delay and jitter. They don’t understand throughput in pps or in MBps. They aren’t concerned about BERs, although perhaps they should be! Users recognize the amount of time to receive a response from the network system. They also recognize small changes in the expected response time and become frustrated when the response time is long.
Users begin to get frustrated when response time is more than about 100 ms or 1/10th of a second. Beyond 100 ms, users notice they are waiting for the network to display a web page, echo a typed character, start downloading email, and so on. If the response happens within 100 ms, most users do not notice any delay.
The 100-ms threshold is often used as a timer value for protocols that offer reliable transport of data. For example, many TCP implementations retransmit unacknowledged data after 100 ms by default.
Note
Good TCP implementations also adjust the retransmit timer based on network conditions. TCP should keep track of the average amount of time to receive a response and dynamically adjust the retransmit timer based on the expected delay.
The 100-ms response time threshold applies to interactive applications. For bulk applications, such as transferring large files or graphical web pages, users are willing to wait at least 10 to 20 seconds. Technically savvy users expect to wait even longer if they know the file is large and the transmission medium is slow. If your network users are not technically savvy, you should provide some guidelines on how long to wait, depending on the size of files and the technologies in use (modems, high-speed digital networks, geostationary satellites, and so on).
Security
Security is a key technical goal, and security design is one of the most important aspects of enterprise network design. Increased threats from both inside and outside the enterprise network require the most up-to-date security rules and technologies. An overall goal that most companies have is that security problems should not disrupt the company’s ability to conduct business. Network design customers need assurances that a design offers protection against business data and other assets getting damaged or accessed inappropriately. Every company has trade secrets, business operations, and equipment to protect.
The first task in security design is planning. Planning involves identifying network assets that must be protected, analyzing risks, and developing requirements. This chapter briefly discusses security planning. Chapter 8, “Developing Network Security Strategies,” covers planning for secure networks in more detail.
As is the case with most technical design requirements, achieving security goals means making tradeoffs. Security implementations can add to the cost of deploying and operating a network. Strict security policies can also affect the productivity of users, especially if some ease of use must be sacrificed to protect resources and data. Poor security implementations can annoy users, causing them to think of ways to get around security policies. Security can also affect the redundancy of a network design if all traffic must pass through encryption devices, for example.
It is common practice to build systems with just enough security to bring potential losses from a security breach down to a desired level. A practical goal is to ensure that the cost to implement security does not exceed the cost to recover from security incidents. Alternatively, some organizations might want to implement stronger measures to mitigate unforeseen risks. As you work with your customer, you should analyze the cost associated with security incidents disrupting business and determine whether the customer wants to try to address unexpected problems.
Identifying Network Assets
The first step in security design is identifying the assets that must be protected, the value of the assets, and the expected cost associated with losing these assets if a security breach occurs. Network assets include hardware, software, applications, and data. Assets also include intellectual property, trade secrets, and a company’s reputation.
Consider the possibility of a hacker damaging an enterprise’s reputation by changing the enterprise’s public web pages. You may have read about some of the cases of hackers changing U.S. government web pages. These security breaches affected the government’s reputation in two ways: The changed web pages had silly graphics and text, and the government lost credibility because it appeared that it was easy to hack into government networks.
The data that a company uses to achieve its mission is an often-overlooked asset. Data can include engineering blueprints, financial planning documents, customer relations information, competitive analysis documents, configuration information for hardware and software, employee Social Security numbers, employee badge information, and so on. The integrity and confidentiality of this data must be protected from intentional or unintentional damage.
Some of the most important network assets are the networking devices themselves, including servers, switches and routers, and especially the firewalls and intrusion detection systems (IDS) that provide security services to network users. These devices are attractive targets to hackers and must be hardened (strengthened) against intrusions. As Chapter 8 discusses in more detail, hardening network devices involves running only the minimal necessary services, establishing trust only with authenticated partners, using secure device-management channels, and patching the device software to install fixes for known security problems.
You should consider more than just data and devices when identifying assets. The network user’s time can be considered an asset. Whenever a virus attacks a system, it takes time to get rid of it, even if it’s innocuous. The fact that this time is wasted is similar to a denial-of-service (D0S) attack. An asset might also be the capability to offer services to customers. This is especially true for Internet service providers (ISP), but also true for many other companies that offer medical, educational, financial, and other types of services.
Every design customer has different business assets and varying needs regarding the importance of assets. As a network designer, you should work with technical and business managers to identify which assets are critical to a business’s mission. A financial services business, for example, has different assets than a health organization or a biomedical research company. As part of the first step of network design, analyzing business requirements, you should have developed a good understanding of your network design customer’s overall business mission (which might be different from the corporate mission statement, by the way, which is often written in a lofty manner to motivate employees and impress shareholders).
Analyzing Security Risks
In addition to identifying assets, an important step in security planning is analyzing potential threats and gaining an understanding of their likelihood and business impact. Risk analysis and the consequent building of a security policy and secure network design is a continuous process, as risks change in their severity and probability on a regular basis. For example, a company’s encryption algorithm and the length of the encryption key might need to be reconsidered if a relatively inexpensive and exceptionally fast code-cracking computer becomes available, which allows easier decryption of valuable secrets.
Risk assessment includes an analysis of the danger of not taking any action. Ask your customer to help you understand the risks associated with not implementing a secure network. How sensitive is the customer’s data? What would be the financial cost of someone accessing the data and stealing trade secrets? What would be the financial cost of someone changing the data? What would be the financial cost associated with the network being down because of a security breach, causing employees to be unable to do their jobs?
As mentioned previously, one of the biggest risks that must be managed is the risk that a hacker can undermine the security of a network device, such as a switch, router, server, firewall, or IDS. When a network device is compromised, the following threats arise:
• Data flowing through the network can be intercepted, analyzed, altered, or deleted, compromising integrity and confidentiality.
• Additional, related network services, which rely on trust among network devices, can be compromised. For example, bad routing data or incorrect authentication information could be injected into the network.
• User passwords can be compromised and used for further intrusions and perhaps to reach out and attack other networks.
• The configuration of the device can be altered to allow connections that shouldn’t be allowed or to disallow connections that should be allowed.
Some customers worry about hackers using protocol analyzers to sniff packets to see passwords, credit cards numbers, or other private data. This is not as big a risk as it appears. Credit card numbers are almost always sent encrypted, using technologies such as the Secure Sockets Layer (SSL) protocol. Passwords are also sent encrypted and are often good for only one use anyway, if one-time passwords (OTP) are used. Even when passwords or credit cards are not encrypted, it is extremely difficult to find these minute pieces of data in the midst of millions of sniffed packets. Also, to sniff relevant packets, a hacker needs physical access to a link that carries relevant traffic or needs to have compromised a switch that supports port monitoring.
Hackers are getting more creative, though. Hackers disguised as customers, repair technicians, and contractors have been known to walk into organizations and gain network access via a network connection in an empty cubicle or a conference room. Sometimes companies have demo rooms, where they showcase their products. For ease of use of the people who configure the products, these rooms sometimes have access to the company’s intranet and to the Internet. Hackers love that sort of setup. Hackers who are less brazen, and don’t want to walk into an organization’s building, often sit outside in the parking lot with a wireless 802.11-enabled notebook computer or wireless handheld device and access corporate networks where the security was not well planned.
In addition to considering outside hackers as a security risk, companies should heed problems caused by inept or malicious internal network users. Attacks might come from inadvertent user errors, including the downloading of software from untrusted sites that introduce malware. Attacks might also come from malicious acts by internal users, including employees disgruntled by cost cuts, employees who become greedy during tough economic times, and employees with a political agenda. Organizations should have information security training and awareness programs to mitigate the risk of internal user attacks.
Reconnaissance Attacks
A set of security risks falls into the category of a reconnaissance attack. A reconnaissance attack provides information about potential targets and their weaknesses and is usually carried out in preparation for a more focused attack against a particular target. Reconnaissance attackers use tools to discover the reachability of hosts, subnets, services, and applications. In some cases the tools are relatively sophisticated and can break through firewalls. A less-sophisticated hacker could convince users to download a file from an alleged music, video, pornographic, or game website. The file could actually be a Trojan horse that gathers reconnaissance data.
During a reconnaissance attack, the attacker might make the following attempts to learn more about the network:
• Gather information about the network’s configuration and management from Domain Name System (DNS) registries.
• Discover access possibilities using “war dialing” (attempts to discover and connect to dialup access points) and “war driving” (attempts to discover and connect to misconfigured wireless access points).
• Gather information about a network’s topology and addressing using network mapping tools. Some tools, such as traceroute and Simple Network Management Protocol (SNMP) queries, are primitive. Others are sophisticated and can send seemingly legitimate packets to map a network.
• Discover the reachability of hosts, services, and applications using ping scans and port scans.
• Discover operating system and application versions and probe for well-known security holes in the software.
• Discover temporary holes created while systems, configurations, and software releases are being upgraded.
Denial-of-Service Attacks
Denial-of-service (DoS) attacks target the availability of a network, host, or application, making it impossible for legitimate users to gain access. DoS attacks are a major risk because they can easily interrupt business processes and are relatively simple to conduct, even by an unskilled attacker. DoS attacks include the flooding of public servers with enormous numbers of connection requests, rendering the server unresponsive to legitimate users, and the flooding of network connections with random traffic, in an attempt to consume as much bandwidth as possible. Distributed denial-of-service (DDoS) attacks are even worse than DoS attacks because the attacker marshals multiple hosts, from various networks, to attack the target.
DoS attacks are usually the consequence of a network’s, host’s, or application’s inability to handle an enormous quantity of data, which crashes the system or halts services on the system. DoS attacks also take advantage of a host’s or application’s failure to handle unexpected conditions, such as maliciously formatted input data or a buffer overflow. DoS attacks are one of the most significant risks that a company must recognize and manage, because they have the capability to cause significant downtime.
Developing Security Requirements
Security problems should not disrupt an organization’s capability to conduct business. That’s the most basic security requirement that every organization has. A secondary security requirement is to protect assets from being incapacitated, stolen, altered, or harmed. Although every design customer has different detailed security requirements, basic requirements boil down to the need to develop and select procedures and technologies that ensure the following:
• Confidentiality of data so that only authorized users can view sensitive information
• Integrity of data so that only authorized users can change sensitive information and so that authorized users of data can depend on its authenticity
• System and data availability, which should provide uninterrupted access to important computing resources
Other, more specific requirements could include one or more of the following goals:
• Let outsiders (customers, vendors, suppliers) access data on public web or File Transfer Protocol (FTP) servers but not access internal data.
• Authorize and authenticate branch-office users, mobile users, and telecommuters.
• Detect intruders and isolate the amount of damage they do.
• Authenticate routing-table updates received from internal or external routers.
• Protect data transmitted to remote sites across a VPN.
• Physically secure hosts and internetworking devices (for example, keep devices in a locked room).
• Logically secure hosts and internetworking devices with user accounts and access rights for directories and files.
• Protect applications and data from software viruses.
• Train network users and network managers on security risks and how to avoid security problems.
• Implement copyright or other legal methods of protecting products and intellectual property.
• Meet compliance and regulatory requirements.
Manageability
Every customer has different objectives regarding the manageability of a network. Some customers have precise goals, such as a plan to use SNMP to record the number of bytes each router receives and sends. Other clients have less-specific goals. If your client has definite plans, be sure to document them, because you will need to refer to the plans when selecting equipment. In some cases, equipment has to be ruled out because it does not support the management functions a customer requires.
Network management is discussed in more detail in Chapter 9, “Developing Network Management Strategies,” but it’s also important to consider management at the onset of a design project. During the initial gathering of technical requirements for a new network design or upgrade, you can use International Organization for Standardization (ISO) terminology to simplify the discussion of network management goals with your design customer. ISO uses the FCAPS acronym to help you remember the following network management functions:
• Fault management: Detecting, isolating, and correcting problems; reporting problems to end users and managers; tracking trends related to problems
• Configuration management: Controlling, operating, identifying, and collecting data from managed devices
• Accounting management: Accounting of network usage to allocate costs to network users and/or plan for changes in capacity requirements
• Performance management: Analyzing traffic and application behavior to optimize a network, meet service-level agreements, and plan for expansion
• Security management: Monitoring and testing security and protection policies, maintaining and distributing passwords and other authentication and authorization information, managing encryption keys, and auditing adherence to security policies
Usability
A goal that is related to manageability, but is not exactly the same as manageability, is usability. Usability refers to the ease of use with which network users can access the network and services. Whereas manageability focuses on making network managers’ jobs easier, usability focuses on making network users’ jobs easier.
It is important to gain an understanding of how important usability is to your network design customer, because some network design components can have a negative effect on usability. For example, strict security policies can have a negative effect on usability (which is a tradeoff that most customers are willing to make, but not all customers). You can plan to maximize usability by deploying user-friendly, host-naming schemes and easy-to-use configuration methods that make use of dynamic protocols, such as the Dynamic Host Configuration Protocol (DHCP).
Usability might also include a need for mobility. As mentioned in Chapter 1, users expect to get their jobs done regardless of their physical location. They expect to have network access in conference rooms, at home, at a customer’s site, and so on. Documenting this requirement as part of the technical requirements will help you recognize the need to select wireless and VPN solutions during the logical and physical design phases of the network design project. It will also help you recognize the need to conduct a site survey to prepare for a wireless infrastructure, as discussed in greater detail in the “Checking Architectural and Environmental Constraints” section of Chapter 3.
Adaptability
When designing a network, you should try to avoid incorporating any elements that would make it hard to implement new technologies in the future. A good network design can adapt to new technologies and changes. Changes can come in the form of new protocols, new business practices, new fiscal goals, new legislation, and a myriad of other possibilities. For example, some states have enacted environmental laws that require a reduction in the number of employees driving to work. To meet the legal requirement to reduce automobile emissions, companies need their remote-access designs to be flexible enough to adapt to increasing numbers of employees working at home. The adaptability of a network affects its availability. For example, some networks must operate in environments that change drastically from day to night or from winter to summer. Extreme changes in temperature can affect the behavior of electronic components of a network. A network that cannot adapt cannot offer good availability.
A flexible network design can also adapt to changing traffic patterns and QoS requirements. For some customers, the selected WAN or LAN technology must adapt to new users randomly joining the network to use applications that require a constant-bit-rate service. Chapter 4 discusses QoS requirements in more detail.
One other aspect of adaptability is how quickly internetworking devices must adapt to problems and to upgrades. For example, how quickly do switches and bridges adapt to another switch failing, causing a change in the spanning-tree topology? How quickly do routers adapt to new networks joining the topology? How quickly do routing protocols adapt to link failures? Chapter 7, “Selecting Switching and Routing Protocols,” discusses these issues in more detail.
Affordability
The final technical goal this chapter covers is affordability which is sometimes called cost-effectiveness. Most customers have a goal for affordability, although sometimes other goals such as performance and availability are more important. Affordability is partly a business goal and was discussed in Chapter 1. It is covered again in this chapter because of the technical issues involved.
For a network design to be affordable, it should carry the maximum amount of traffic for a given financial cost. Financial costs include nonrecurring equipment costs and recurring network operation costs. As mentioned in Chapter 1, you should learn about your customer’s budget so that you can recommend solutions that are affordable.
In campus networks, low cost is often a primary goal. Customers expect to be able to purchase affordable switches that have numerous ports and a low cost per port. They expect cabling costs to be minimal and service provider charges to be minimal or nonexistent. They also expect NICs for end systems and servers to be inexpensive. Depending on the applications running on end systems, low cost is often more important than availability and performance in campus network designs. For enterprise networks, availability is usually more important than low cost. Nonetheless, customers are looking for ways to contain costs for enterprise networks. Recurring monthly charges for WAN circuits are the most expensive aspect of running a large network.
To reduce the cost of operating a WAN, customers often have one or more of the following technical goals to achieve affordability:
• Use a routing protocol that minimizes WAN traffic.
• Consolidate parallel leased lines carrying voice and data into fewer WAN trunks.
• Select technologies that dynamically allocate WAN bandwidth—for example, ATM rather than time-division multiplexing (TDM).
• Improve efficiency on WAN circuits by using such features as compression.
• Eliminate underutilized trunks from the internetwork and save money by eliminating both circuit costs and trunk hardware.
• Use technologies that support oversubscription.
With old-style TDM networks, the core backbone capacity had to be at least the sum of the speeds of the incoming access networks. With cell and frame switching, oversubscription is common. Because of the bursty nature of frame-based traffic, access port speeds can add up to more than the speed of a backbone network, within reason. Enterprise network managers who have a goal of reducing operational costs are especially interested in solutions that will let them oversubscribe their trunks, while still maintaining service guarantees they have offered their users.
The second most expensive aspect of running a network, following the cost of WAN circuits, is the cost of hiring, training, and maintaining personnel to operate and manage the network. To reduce this aspect of operational costs, customers may require you to do the following as you develop the network design:
• Select internetworking equipment that is easy to configure, operate, maintain, and manage.
• Select a network design that is easy to understand and troubleshoot.
• Develop good network documentation that can help reduce troubleshooting time.
• Select network applications and protocols that are easy to use so that users can support themselves to some extent.
Making Network Design Tradeoffs
Despite what politicians tell us about state and federal budgets during an election year, in the real world meeting goals requires making tradeoffs. This section describes some typical network design tradeoffs.
To meet high expectations for availability, redundant components are often necessary, which raises the cost of a network implementation. To meet rigorous performance requirements, high-cost circuits and equipment are required. To enforce strict security policies, expensive monitoring might be required and users must forgo some ease of use. To implement a scalable network, availability might suffer, because a scalable network is always in flux as new users and sites are added. Implementing good throughput for one application might cause delay problems for another application. Lack of qualified personnel might suggest the need for expensive training or the need to drop certain features. The network design that you develop must take these tradeoffs into consideration.
One cause of network problems can be inadequate staffing and reduced training due to overzealous cost cutting. The tradeoff with cutting costs might be a network that isn’t robust or has substandard performance until the problem is recognized, which often takes a year or two. If the in-house network staff was cut, outsourcing might become a necessity, which could end up being more costly than it would have been to keep the in-house staff.
The network design process is usually progressive. This means that legacy equipment must coexist with new equipment. Your design might not be as elegant as you would like because you might need for it to support old devices and old applications. If the new network is not being introduced at the same time as new applications, the design must provide compatibility with old applications. Also, be aware that insufficient bandwidth in parts of the network, where the bandwidth cannot be increased due to technical or business constraints, must be resolved by other means.
To help you analyze tradeoffs, ask your customer to identify a single driving network design goal. This goal can be the same overall business goal for the network design project that was identified in Chapter 1, or it can be a rephrasing of that goal to include technical issues. In addition, ask your customer to prioritize the rest of the goals. Prioritizing will help the customer get through the process of making tradeoffs.
One analogy that helps with prioritizing goals is the “kid in the candy store with a dollar bill” analogy. Using the dollar bill analogy, explain to the customers that they are like children in a candy store who have exactly one dollar to spend. The dollar can be spent on different types of candy: chocolates, licorice, jelly beans, and so on. But each time more money is spent on one type of candy, less money is available to spend on other types. Ask customers to add up how much they want to spend on scalability, availability, network performance, security, manageability, usability, adaptability, and affordability. For example, a customer could make the following selections:
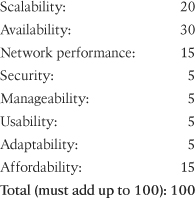
Keep in mind that, sometimes, making tradeoffs is more complex than what has been described because goals can differ for various parts of an internetwork. One group of users might value availability more than affordability. Another group might deploy state-of-the-art applications and value performance more than availability. In addition, sometimes a particular group’s goals are different from the overall goals for the internetwork as a whole. If this is the case, document individual group goals and goals for the network as a whole. Later, when selecting network technologies, you might see some opportunities to meet both types of goals—for example, choosing LAN technologies that meet individual group goals and WAN technologies that meet overall goals.
Technical Goals Checklist
You can use the following checklist to determine if you have addressed all your client’s technical objectives and concerns:
![]() I have documented the customer’s plans for expanding the number of sites, users, and servers for the next 1 year and the next 2 years.
I have documented the customer’s plans for expanding the number of sites, users, and servers for the next 1 year and the next 2 years.
![]() The customer has told me about any plans to migrate departmental servers to a centralized data center.
The customer has told me about any plans to migrate departmental servers to a centralized data center.
![]() The customer has told me about any plans to integrate data stored on a legacy mainframe with the enterprise network.
The customer has told me about any plans to integrate data stored on a legacy mainframe with the enterprise network.
![]() The customer has told me about any plans to implement an extranet to communicate with partners or other companies.
The customer has told me about any plans to implement an extranet to communicate with partners or other companies.
![]() I have documented a goal for network availability in percent uptime and/or MTBF and MTTR.
I have documented a goal for network availability in percent uptime and/or MTBF and MTTR.
![]() I have documented any goals for maximum average network utilization.
I have documented any goals for maximum average network utilization.
![]() I have documented goals for network throughput.
I have documented goals for network throughput.
![]() I have documented goals for pps throughput of internetworking devices.
I have documented goals for pps throughput of internetworking devices.
![]() I have documented goals for accuracy and acceptable BERs.
I have documented goals for accuracy and acceptable BERs.
![]() I have discussed with the customer the importance of using large frame sizes to maximize efficiency.
I have discussed with the customer the importance of using large frame sizes to maximize efficiency.
![]() I have discussed with the customer the tradeoffs associated with large frame sizes and serialization delay.
I have discussed with the customer the tradeoffs associated with large frame sizes and serialization delay.
![]() I have identified any applications that have a more restrictive response-time requirement than the industry standard of less than 100 ms.
I have identified any applications that have a more restrictive response-time requirement than the industry standard of less than 100 ms.
![]() I have discussed network security risks and requirements with the customer.
I have discussed network security risks and requirements with the customer.
![]() I have gathered manageability requirements, including goals for performance, fault, configuration, security, and accounting management.
I have gathered manageability requirements, including goals for performance, fault, configuration, security, and accounting management.
![]() I have updated the Network Applications chart to include the technical application goals shown in Table 2-2.
I have updated the Network Applications chart to include the technical application goals shown in Table 2-2.
Table 2-2 Network Applications Technical Requirements

![]() Working with my customer, I have developed a list of network design goals, including both business and technical goals. The list starts with one overall goal and includes the rest of the goals in priority order. Critical goals are marked as such.
Working with my customer, I have developed a list of network design goals, including both business and technical goals. The list starts with one overall goal and includes the rest of the goals in priority order. Critical goals are marked as such.
Chapter 1 provided a Network Applications chart. At this point in the design process, you can expand the chart to include technical application requirements, such as MTBF, MTTR, and throughput and delay goals, as shown in Table 2-2.
Summary
This chapter covered technical requirements for a network design, including scalability, availability, network performance, security, manageability, usability, adaptability, and affordability. It also covered typical tradeoffs that must be made to meet these goals.
Analyzing your customer’s technical and business goals prepares you to carry out the next steps in the top-down network design process, including making decisions about network technologies to recommend to a customer. Researchers who study decision models say that one of the most important aspects of making a sound decision is having a good list of goals.
At this point in the network design process, you have gathered both business and technical goals. You should make a list of your customer’s most important technical goals and merge this list with the list of business goals you made in Chapter 1. You should put the goals in the list in priority order, starting with the overall most important business and technical goal, and following with critical goals and then less critical goals. Later, you can make a list of options and correlate options with goals. Any options that do not meet critical goals can be eliminated. Other options can be ranked by how well they meet a goal. This process can help you select network components that meet a customer’s requirements.

Review Questions
- Discuss the term “scalability.” What does it mean? Why is it an important network design goal? What are some challenges designers face when designing for scalability?
- A network design customer has a goal of 99.80 percent uptime. How much downtime will be permitted in hours per week? How much downtime will be permitted in minutes per day and seconds per hour? Which values are acceptable in which circumstances?
- Assume you are in New York City in the United States and you are downloading a 100-KB web page from a server in Cape Town, South Africa. Assume that the bandwidth between the two cities is 1 Gbps. Which type of delay will be more significant, propagation delay or transmission delay? Defend your answer.
- The chapter mentioned reconnaissance attacks. Do some research to learn more about the tools that attackers use when on a reconnaissance mission. In your own words, describe two tools that you researched.
Design Scenario
Harriet’s Fruit and Chocolate Company was established in 1935 in the Pacific Northwest of the United States to ship gift baskets of locally grown peaches and pears to customers in the United States. The company also makes chocolates and baked goods to include in the gift baskets. It has grown extensively over the years and is currently one of the biggest companies in the Pacific Northwest.
Recently, Harriet’s descendants, who still run the company, have identified a need to immediately report when fruit is starting to ripen and should be picked and placed in cold storage. Employees in the marketing department have identified a need to access inventory data for the fruit in the orchards and in cold storage. With this data, they can design and sell gift-basket products that take advantage of the ripe fruit. This data must also be fed into e-commerce applications so that web orders can correctly specify product availability.
In addition, the company recently hired an ambitious programmer who is anxious to use her knowledge of SAS programming, SQL, and DB2 to design reporting applications for senior management. She calls you every day with new ideas on what she could accomplish if the network were upgraded so that she could reach up-to-date data from the orchards and cold storage buildings.
As the network designer for this company, you have been charged with selecting network technologies to reach the orchards and cold storage buildings. Each of the six orchards has a shack with one or two standalone PCs and a printer. The three cold storage buildings are huge warehouses that include a few standalone PCs and printers. The local telephone company has suggested that you lease fractional T1 links, but these links are expensive and possibly beyond your budget. Wireless technologies are also possible, but you have heard that fruit trees, especially full-grown trees that are tall and leafy, can absorb a wireless radio frequency (RF) signal. You have also heard that the cold storage buildings have ice hazards, making it hard to install equipment. But you will not let these challenges faze you.
- What investigation will you do with regard to the physical infrastructure of the orchards, the orchard shacks, and the cold storage buildings?
- Make a list of business goals for Harriet’s Fruit and Chocolate Company. What are some constraints that will affect these goals?
- Make a list of technical goals for Harriet’s Fruit and Chocolate Company. What tradeoffs might you need to make to meet these goals?
- Will a wireless solution support the low delay that will be needed to meet the needs of the applications? Defend your answer.
- What security concerns should you bring up as you design the network upgrade?