CHAPTER 3
The Framework to Put UDA to Work
A woodsman was once asked, “Give me six hours to chop down a tree and I will spend the first four sharpening the axe.
—Abraham Lincoln
INTRODUCTION
Over the past decade, the explosion of digital information has provided an unprecedented opportunity for businesses and organizations to capture, store, and process different types of new data, both structured and unstructured. With the advent of computing power and the decreased cost of storing information, the real challenge that companies face today is the variety of the data they have at their disposal: e-mails, chats, tweets, audio, video images, and pictures.
Information such as customers' needs, feelings, and feedback, as well as employee narratives, stays buried in tweets, Facebook updates, and human resource information systems and files. These real-time insights encapsulating consumers' viewpoints about content, a product, a service, consumers' needs and preferences, or employee experience engagement or satisfaction remain untapped.
Enhancements in computing power originally propelled a variety of analyses of structured data, leveraging several statistical and mathematical techniques. However, due to computing limitations, it was only in the late 1990s that unstructured data began to be analyzed. Most recently, deep learning algorithms have been used to analyze videos and voice streams. Tech giants, such as Google, Facebook, and Amazon, and online hiring solutions, such as LinkedIn and Monster, have created entire data products and lines of business by leveraging massive amounts of data, unstructured for the most part, that they collect from their users and consumers.
Originally, Google built its entire business by understanding text on Web pages to provide the best result for consumer search queries.
Big Data continues to be touted as the next wave of technology and analytics innovations. However, the magnitude of the wave is not related to the size of the data, but rather to the task of leveraging data intelligence that drives business performance. In this chapter I will provide key components of the UDA framework that you need to distill intelligence from all your data and discuss the following:
- Why Have a Framework to Analyze UDA?
- What Are the Key Components of the IMPACT Cycle?
- Story from the Frontline: Interview with Cindy Forbes EVP Chief Analytics Officer Manulife Financial
- The Team Tool and Techniques for Successful UDA
- Text Parsing Example and Text Analytics Useful Vocabulary
- The IMPACT Cycle in Action with: Airline Case Study
- Key Takeaways
WHY HAVE A FRAMEWORK TO ANALYZE UNSTRUCTURED DATA?
As we discussed in the previous chapter, in today's globally connected digital world, we have access to more data than ever before. More than 80 percent of that data is unstructured and more importantly, only .05 percent of the data is analyzed. Companies that are not analyzing their unstructured data are missing a huge opportunity to understand their customers, their prospects, their competition, and their overall market. So how can they tackle their unstructured data?
The human mind can read and comprehend text whether it is a sentence, a paragraph, or a document; a computer can be taught to efficiently achieve the same goal. To derive meaning from text or images, unstructured data must be transformed into quantitative representations (numbers), leveraging mathematical formulas like linear algebra. The computer needs to be taught how to read, interpret, and understand the structure of a phrase, a sentence, and a paragraph. It then uses mathematical algorithms to remove the noise and redundancies from the data and retain the most meaningful information, the essence of the original data, which I call the signal. Making the computer understand what the text is saying can be a daunting exercise, though great progress has been made in the past decade. Think about all the connections and associations your brain is doing while you are reading this chapter. Your level of understanding of some concepts such as vector space model, which will be introduced in this chapter, would depend on your background. If you have studied linear algebra, you know that vector space model will not refer to astronautics. You will quickly think about linear algebra. Without that background, however, the concept and its meaning need to be clearly defined and explained to avoid any ambiguity.
To create business value from complex data, we need to have a framework. The framework I will present in the following section is based on the IMPACT cycle along with the T3 (team, technique, and tools) approach. Based on my experience successfully building and implementing analytics capabilities, I will explain how the IMPACT cycle and the T3 are the essential ingredients any organization needs to put data analytics to work. This approach has also been validated through interviews I conducted with industry leaders during my research for my previous books and enhanced thanks to inputs from industry leaders in unstructured data analytics (UDA) I interviewed for this book. My goal was to ensure that all types of data analytics and business lines could benefit from it.
Regardless of whether your business is insurance, human resources (HR), fraud detection, finance, marketing, telecommunications, healthcare, sports, or national security, when you are inundated with data, your goal is to create business value from it. This means harnessing all of that data to understand your market and your customers; to anticipate your customer needs and behaviors; to leverage the voice of your customer to drive business performance; and to harness consumer feedback and insights to develop better products or services.
The upcoming sections discuss a useful and easy-to-implement framework that provides the essential ingredients to harness data and drive business performance.
THE IMPACT CYCLE APPLIED TO UNSTRUCTURED DATA
Focusing on the IMPACT
During my career of more than twenty-five years building and implementing analytics centers of excellence across several organizations and industries, and advising companies in different regions of the world, and through my twelve years of experience harnessing unstructured data from job seeker resumes, employer job openings, and customer service call logs, I saw most organizations sitting on a goldmine of unstructured data. During my research for this book, I spoke with 253 industry leaders, experts, and business partners about their data assets and challenges. Consistently, I heard that organizations are drowning in data but lacking in deriving actionable insights from it to better understand their customers, their prospects, the market, and their competition. I then realized that the IMPACT cycle powered by the T3 (the right team, tools, and technique) could help guide analysts to become insightful business partners. Introduced in my first book, Win with Advanced Business Analytics,2 the IMPACT cycle is a framework for creating actionable insights from structured and unstructured data.
To get analysts to pull their heads up from the data vault and focus on the business is not always an easy task. It is both an art and science. The IMPACT cycle offers the analyst the following steps, which are described in the following section:
- Identify
- Master
- Provide
- Act
- Communicate
- Track
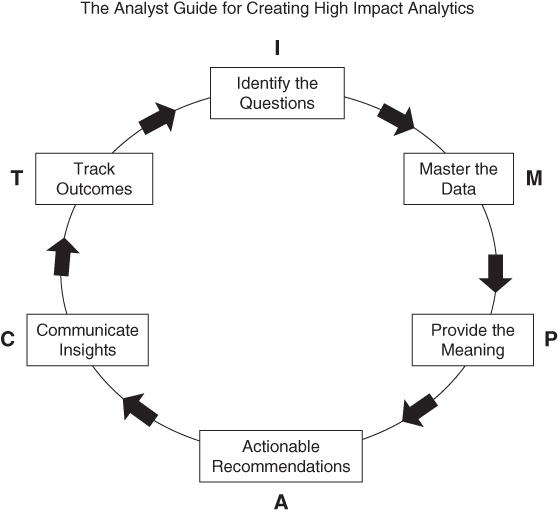
Exhibit 3.01 The IMPACT Cycle
Identify Business Questions
In a nonintrusive way, help your business partner identify the critical business questions he or she needs help to answer. Then, set a clear expectation of the time and the work involved to get the answer. In the case of unstructured data, business questions could include the following sample of thirty:
- Detect spam e-mails
- Filter and categorize e-mails
- Classify news items
- Classify job titles in a marketing database for e-mail prospecting
- Classify job seeker resumes in categories and occupations
- Classify new job openings in categories and occupations
- Cluster consumer and customer comments and complaints
- Classify and categorize documents, patents, and Web pages
- Cluster survey data (open-ended questions) to understand customer feedback
- Cluster analysis research in a database
- Cluster newsfeeds and tweets in predefined categories
- Classify and categorize research reports
- Classify research papers by topic
- Create new live-streaming movie offerings based on viewer ratings
- Create food menus and combos based upon customer feedback and ratings
- Retrieve information using search engine
- Predict customer satisfaction based on customer comments
- Predict customer attrition based on customer feedback or conversations with call centers
- Predict which resume best matches a job description
- Predict employee turnover based on social media comments and performance appraisal narratives
- Anticipate employee rogue behavior
- Predict call center cost based on call center logs
- Predict stock market price based on business news announcements
- Predict product adoption based on consumer feedback tweets
- Predict terror attacks based on social media content
- Detect and predict fraudulent transactions in banks and government
- Detect fraudulent claims in insurance companies
- Perform image detection, image recognition, and classification
- Perform facial recognition, video, and voice recognition
- Perform sentiment analysis
Master the Data
This is the data analyst's sweet spot—preparing, importing, assembling, analyzing, and synthesizing all available information that will help to answer critical business questions, and then creating simple and clear visual presentations (charts, graphs, tables, interactive data environments, and so on) of the data that are easy to comprehend.
To efficiently master unstructured data, we will leverage Exhibit 3.02: the UDA Recipe Matrix in the table below to describe what type of analytics and techniques could be used based on the type of unstructured data to be harnessed. In the upcoming sections, we will describe the analytics and techniques to be used when the type of unstructured data presented in the Recipe Matrix Table above is text.
| Unstructured Data Type | Analytics Category | Analytics Subcategory | Techniques |
| Text | Text analytics/Text mining Natural language processing (NLP) |
Text summarization Text /content categorization Topics extraction Text retrieval Opinion mining Sentiment/Emotion analysis |
Singular value decomposition (SVD) Latent semantic analysis (LSA) Quick response (QR) factorization Artificial intelligence (AI) Machine learning Deep learning |
| Images and pictures | Image analytics | Image classification Face classification Face recognition Computer vision |
SVD LSA QR factorization AI Machine learning Deep learning |
| Audio voice of customer |
Voice analytics Speech-to-text |
Voice recognition (NLP Text summarization and classification Topic extraction Sentiment analysis opinion mining |
SVD LSA QR factorization AI Machine learning Deep learning |
| Video | Video analytics | Video recognition Video classification |
Machine learning Deep learning |
Exhibit 3.02 UDA Recipe Matrix
If the unstructured data is audio, video, or pictures, we recommend using machine learning and deep learning techniques that will produce best results for recognition and classification. Techniques such as singular value decomposition (SVD) and principal component analysis could still be used for image classification and recognition; however, the latest progress in computer vision was achieved with the deep learning technique, which produces more robust and accurate results, although it requires more training data and more memory. This is no longer an issue since we moved from CPUs (central processing units) to GPUs (graphics processing units) and, most recently, to TPUs (tensor processing units), which enable effective usage of the deep neural network. Because this book is not about deep learning, for simplicity, let's discuss how to master text data using the traditional linear algebra technique.
Mastering Text Data
Mastering text data in all forms involves five steps, described in Exhibit 3.03.
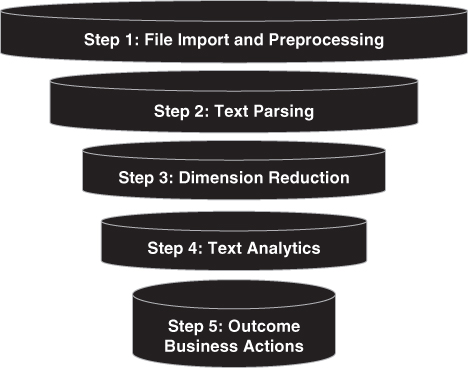
Exhibit 3.03 The Five Steps of Text Analysis
Step 1: Importing the Data and Preprocessing
The first step consists of identifying and defining what type of data you envision using to address your business question. Then, you integrate this data by loading your raw text data into your UDA software. It is important to note that you can access the data directly from the web via URL or point to a directory on your local machine or server. Your text document could be of any format: Adobe portable document format (PDF), rich text format (RTF), Word document, Excel file, HTML document, and the like. The output will be a dataset ready to be used by the unstructured analytics software you intend to use: Python, R, PERL, Math-lab, SAS Text Miner, IBM SPSS, or other. This process creates a working text-mining dataset that will include two important fields, one for customer identification and one generally called text that encompasses customer opinions or voice, as we will see later in this chapter.
Step 2: Text Parsing
Once the data is imported and preprocessed, parsing is performed. Text parsing is about decomposing the unstructured raw data (text or images) into quantitative representations that will be used for the analysis. The goal of the parsing is to normalize the raw text data and create a table with rows and columns in which rows represent the terms in the documents collection and columns represent the documents. This table is called a term-by-documents matrix. We will provide examples of term-by-document matrices in upcoming sections.
Below is a high-level summary of the ten major text parsing steps; if you are just seeking a high-level overview of text analytics, feel free to give this section a skim.
- Tokenization involves breaking sentences, paragraphs, or sections of the documents into terms.
- Identification and extraction of nouns, noun groups, multiword terms lists, synonymy and polysemy, and entities to consider and include in parsing (or treat as a parsed terms part of speech) that are meaningful to your application. It's helpful to work with linguists and other business partners to identify, based on the business questions and industry, what terms should be used as parts of speech, and what synonyms or polysemy to include or exclude from the analysis. Synonyms help to link together words that do not have the same base form but share the same meaning in context.
- Building automatic recognition of multiword terms and tagging parts of speech. A multiword term is a group of words that should be processed as a single term—for instance, idiomatic phrases, collections of related adjectives, compound nouns, and proper nouns.
- Normalization of various entities such as names, addresses, measurements, companies, dates, currency, percentages, and years.
- Extraction of entities such as organizations, products, Social Security numbers, time, titles, and the like.
- Stemming the data by finding the root form or base form of words. Stemming helps to treat terms with the same root as equivalent; it also helps to reduce the number of terms in the document collection.
- Apply filtering to identify the Stop Word List (list of terms to ignore) and Start Word List (list of terms to include). The stop word list is a collection of low information value words and terms that should be ignored during parsing.
- Creation of a Bag of Words: a representation that excludes some tokens and attributes.
- Weighting: Depending on the type of UDA, it is often useful to apply some weighting to terms in a document or document collection to optimize subsequent analysis results such as information retrieval and sentiment analysis.
- Create a term-by-document matrix: a term-by-document matrix is a quantitative representation of the original raw unstructured text that will be used as the foundation of the document collection analysis.
Step 3: Dimension Reduction and Text Transformation
Dimension reduction transforms the quantitative representation of the raw text data into a compact and informative format. Dimension reduction takes the terms-by-documents matrix, which is generally high dimension, and creates a simplified representation of the same documents collection in a lower dimension by leveraging linear algebra concepts such as vector space model, SVD, and QR factorization. Those linear algebra techniques, which will be discussed quickly in the T3 section and in broader details in the appendix Tech Corner are powerful tools in text analytics.
Why practice dimension reduction? Since the number of terms needed to represent each document in the document collection could be extremely high (thousands or hundred thousands or more) and consequently difficult to model, dimension reduction is a critical procedure when you want to analyze text. The goal of dimension reduction is to remove redundancy and noise from the original data and thereby get an optimal representation of the original data in a lower dimension.
The power of dimension reduction really comes to light when you have to address business questions with millions of variables and observations. Without dimension reduction, it would be impossible to find any meaning in the content. Dimension reduction is also useful in experimental science, where most experimenters frequently try to understand some phenomenon by measuring various quantities, such as velocities, voltages, or spectra. However, they will usually face the dilemma of not being able to figure out what is happening, which data to keep, and what part of data is redundant, noisy, or clouded. They must distill signal from noise.
Step 4: Text Analytics
The goal of text analytics is to articulate clear and concise interpretations of the data and visuals in the context of the critical business questions that were identified. This step is about performing several types of analyses, such as clustering, classification, categorization, link analysis, and predictive modeling, on the raw data collected. Beyond getting cluster categorization and sentiment from text analysis, the output of the text categorization or clusters could also be used as inputs or independent variables for predictive models, such as customer attrition, customer acquisition, fraud prevention and detection, resume matching, or job opening categorization.
Step 5: Outcome Business Actions
In Step 5, the findings from the text analytics are put into action across the organization. For instance, negative feedback regarding your service should lead to enhanced customer touchpoint training and lead to a subsequent increase in customer satisfaction. A negative sentiment regarding your brand should trigger actions that improve your online reputation. Groups of triggers within e-mail exchanges between customers and customer service representatives should result in proactive outreach and courtesy calls to prevent customer attrition.
Provide Meaning
This step is about finding the knowledge buried in your unstructured data using text analytics techniques described in the Text Analytics Process Stage 4 and 5, explained in the previous sections. Providing meaning is about articulating clear and concise interpretations of the data and visuals in the context of the critical business questions that were identified.
This is where businesses get actionable insights from their unstructured data.
Actionable Recommendations
The fourth step in building the IMPACT cycle is concerned with actionable recommendations. At this step, you create thoughtful business recommendations based on your interpretation of the unstructured data. Even if they are off-base, it's easier to react to a suggestion than to generate one. Where possible, tie a rough dollar figure to any revenue improvement or cost saving associated with your recommendations. Some recommendations with financial impact include:
- Proactively reduce insurance claim fraud by text mining customer claim narratives. A 1 percent decrease in fraud can represent a saving of $XXXX.
- Proactively reduce customer attrition by analyzing customer feedback and call center logs. A reduction of 10 percent in attrition can represent revenue increase of $XXXX.
- Develop an attractive new product based on consumer reviews and social media feedback mining. A profit of 10 percent can represent additional revenues of $XXXX.
Communicate Insights
Focus on a multipronged communication strategy that will get your insights as far into and as wide across the organization as possible. Maybe your strategy is in the form of an interactive tool others can use, a recorded WebEx of your insights, a lunch and learn, or even just a thoughtful executive memo that can be passed around. The final output should target end users, such as customer touchpoints (customer service representatives and sales representatives), and be easy to access and available in the system for them to do their job.
Track Outcomes
Set up a way to track the impact of your insights. Make sure there is future follow-up with your business partners on the outcome of any action. What was done? What was the impact? What was the return on investment? What are the new critical questions that require help as a result?
TEXT PARSING EXAMPLE
Let's go through a simple example to explain parsing in practice. In Exhibit 3.04, you find in the left column Sentence, the original statement; in the right column are Parsed Terms, the basic terms.
| Sentence | Parsed Terms |
| Randstad announced a buyout of Monster Worldwide Inc. on Aug 9, 2016, offering $3.40 per share in cash. The stock price surged more than 26%. | Randstad +announce a +buy of Monster Worldwide Inc. on Aug 9 2016 +offer $3.40 per share in cash The stock prize +surge more than 26% |
Exhibit 3.04 Sentence and Parsed Terms
The next example will provide a broader view of text parsing that includes text normalization, stemming, and filtering. The creation of terms-by-document matrix as well as the application of some parsing steps will be shown.
Term-by-Document Matrix
One of the biggest airlines in Europe ran a food satisfaction survey for its customer satisfaction retention regarding its business-class snack salad. Exhibit 3.05 is a sample of feedback from four customers in response to an open-ended question in the survey.
Customers were asked to provide which meal they enjoyed most during their last flight. Analyzing the text embedded in the open question enabled the airline to launch the right new salad, helping the airline increase customer satisfaction with food as well as the overall customer flying experience. The ultimate goal was significant improvement in customer retention and loyalty.
| Original Documents/Customer Responses | Parsing | Parsed Document | |
| Document1 | Customer1: “During my flight last week, I loved the banana and kiwi salad” | Normalize Stem Filter (remove low information words) |
+love banana kiwi |
| Document2 | Customer2: “During my flight last week, I really enjoyed the mango and kiwi salad” | +enjoy mango kiwi | |
| Document3 | Customer3: “During my flight last week, I loved the broccoli and bean salad” | +love broccoli bean | |
| Document4 | Customer4: “During my flight last week, I enjoyed the broccoli and cauliflower salad” | +enjoy broccoli cauliflower | |
Exhibit 3.05 Analyzing the Text
- Normalize: Identify and find noun group, noun entity part of speech word: for the above example: During, flight, I, and
- Stem: Identify root words to be used in the parsing:
- For loved, the root word is love, parsed as +love
- For enjoyed, the root word is enjoy, parsed as +enjoy
- Filter: Remove low-information words: during my flight, last week, I, and, salad have been removed because they are considered in this case to be low-information terms.
A term-by-document matrix table, a quantitative representation of the four documents after parsing and normalization, is represented in Exhibit 3.06.
| Document 1 | Document 2 | Document 3 | Document 4 | |
| +love | 1 | 0 | 1 | 0 |
| +enjoy | 0 | 1 | 0 | 1 |
| banana | 1 | 0 | 0 | 0 |
| kiwi | 1 | 1 | 0 | 0 |
| mango | 0 | 1 | 0 | 0 |
| broccoli | 0 | 0 | 1 | 1 |
| bean | 0 | 0 | 1 | 0 |
| cauliflower | 0 | 0 | 0 | 1 |
Parsing transformed each sentence into a parsed sentence (broken down into words/terms).
Text normalization filtered to exclude words that are prepositions/parts of speech such as and or I, words that do not have value.
Text stemming keeps only the roots of words: +love→ loved, +enjoy-→ enjoying, enjoyed.
Exhibit 3.06 Term-by-Document Matrix Table
The term-by-document matrix is a representation of how many times each term appears in each document. Sometimes we must apply weighting to impart more value on some of the terms. In this case, we did not apply any weighting. The above matrix becomes the foundation for subsequent analyses of the collection of the four documents. From this matrix, we can now apply dimension reduction, which is to find a collection of terms that best describes the concepts in the documents. This helps to assess the similarity between documents and terms versus documents.
In the next section, we will discuss what is needed to start your text analytics journey leveraging the IMPACT cycle.
The T3
Team
The ideal team to launch UDA includes people with a mix of business and technical backgrounds. The technical background is brought by data analysts, data scientists, statisticians, data miners, mathematicians, or computer scientists. The technical team members help import and load the data, and build algorithms to parse the data and analyze the text data through dimension reduction, clustering classification, and categorization prediction. Linguists and psychologists can help define the structure of the language, the meaning of words, and how to interpret and define some specific clusters in behavioral analysis or sentiment analysis. Their expertise is required because text analytics tools need be taught how to treat and understand the structure of the language, how sentences are formed, what words could be considered as a part of speech, idioms, polysemy, or synonymy in documents or sentence sections in a given sector or industry. Consequently, it is important that these experts work with data analysts to ensure the best understanding of the meaning of words, groups of words, concepts, topics, and text sentiment in the algorithms to be developed.
The business expertise is represented by managers who understand the business question to be addressed. They are also instrumental in explaining the business language and concepts to the technical team. People with business industry acumen are required to ensure the end results are practical and actionable.
Technique
The most frequently used technique to analyze unstructured data leverages linear algebra, vector space model, matrices decomposition, and dimension reduction techniques such as SVD or QR factorization. Once the dimensions are reduced, techniques such as clustering and classification predictive models are applied to get more insight from the text data. These techniques help to derive topics and concepts and provide answers to the original business question raised in the Identify stage of the IMPACT framework. SVD is the most important linear algebra technique used for dimension reduction in text mining or NLP. Deerwester, Dumais, Furnas, Landauer, and Harshman3 were the first to apply SVD to term frequency matrices. This was done in the context of information retrieval called latent semantic indexing (LSI).
SVD can be found in many technical textbooks. While this book is not technical, the notion of dimension reduction is so critical that it is worth detailing. You can think of SVD as a mathematical technique that creates an optimal representation of the information contained in text data by reducing its dimension while keeping the essence of the original text. Instead of having a document represented by, as an example, eight terms, we can find an optimal way to represent documents using two concepts.
In our previous example concerning airline food satisfaction survey, the concept fruit would represent banana, kiwi, and mango as one dimension, while broccoli, bean, and cauliflower would be represented by the concept vegetable as a second dimension. SVD simplifies the hundreds of dimensions (varieties of fruits and varieties of vegetables), into two dimensions: fruits and vegetables. Looking at the document with sentences about preference for fruit or vegetable could help to understand food appeal and support the design of salads with fruits or vegetables.
Exhibit 3.07 showcases how SVD is used to decompose a document-by-terms matrix into three matrices:
| The first matrix: | The document-by-concept similarity matrix |
| The second matrix: | The concept strength matrix |
| The third matrix: | The concept-by-term similarity matrix |
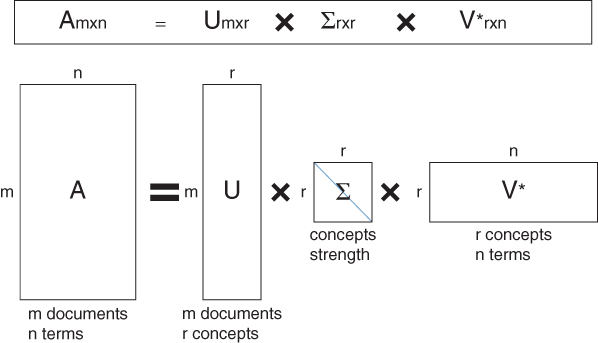
Exhibit 3.07 Singular Value Decomposition
Applying Exhibit 3.07 to our four documents, customer responses to airline satisfaction survey result in the table shown in Exhibit 3.08, a quantitative representation of the responses. Their responses were parsed, and the table showcases the terms used by each customer.
| Customer | love | enjoy | banana | kiwi | mango | broccoli | bean | cauliflower |
| Customer1 | 1 | 0 | 1 | 1 | 0 | 0 | 0 | 0 |
| Customer2 | 0 | 1 | 0 | 1 | 1 | 0 | 0 | 0 |
| Customer3 | 1 | 0 | 0 | 0 | 0 | 1 | 1 | 0 |
| Customer4 | 0 | 1 | 0 | 0 | 0 | 1 | 0 | 1 |
Exhibit 3.08 Quantitative Representation of Responses
Let's call the matrix representation of the document-by-terms Table A.
Thus: A encompasses the number of documents (m = 4), and the number of terms (n = 8). A is therefore a 4-by-8 matrix.
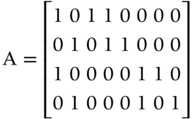
From matrix A, we can use SVD to factorize the document-by-term matrix A into a product of three matrices, including concepts, concept strength, and term. SVD defines a small number of concepts that connect the rows and columns of the matrix.
The trade-off for having fewer dimensions is the accuracy of the approximation.
For text analytics, SVD provides the mathematical foundation for text mining and classification techniques generally known as LSI. In SVD, the matrix U is an entity-of-documents matrix; a way to represent the document and text to be mined in a high-dimension vector space model that is generally known as hyperspace document representation. By reducing the dimensional space, SVD helps to reduce redundancies and noise in the data. It provides new dimensions that capture the essence of the existing relationship.
Important note: Readers interested in the technical details behind the SVD will find additional information in the Appendix section called Tech Corner Details.
Techniques such as machine learning and deep learning provide great performance and results for UDA.
Tools
Text mining or NLP could be performed by leveraging two types of tools or software: Open source software and paid software. Exhibit 3.09 is the list of 10 open source and paid text analytics software. An exhaustive list is available from Predictive Analytics Today.4
| Ranking* | Open Source | Paid Software |
| 1 | TM: Text mining infrastructure in R | SAS Text Analytics |
| 2 | Gensim: Python | IBM Text Analytics |
| 3 | MathLAbs | LExalytics Text Analytics |
| 4 | PERL | Smartlogic |
| 5 | Natural Language Toolkit | Provalis Research |
| 6 | RapidMiner | OpenText |
| 7 | KH Coder | AlchemyAPI |
| 8 | CAT | Pingar |
| 9 | Carrot2 | Attensity |
| 10 | QDA Miner Lite, Gate | Clarabridge |
Exhibit 3.09 Ten Open Source and Paid Text Analytics Software Packages
Exhibit 3.10 includes a summary of the T3 to support successful implementation of text analytics.
| The T3 | Name | Roles |
| Team (Talent) | Managers | Help define the business questions to address. Help to explain the business terminology and concepts. |
| Computer Scientists Statisticians Mathematician Data Scientists IT |
Import the raw unstructured data (documents and images). Build program to create a vector space model of the raw data. Build program to reduce dimension and analyze documents. Perform analyses such as clustering, classification, detection, and predictive model. Define the required infrastructure. |
|
| Linguists Psychologists |
Identify linguistics rules to use and help in defining parsing (term, synonymy, and polysemy) for document normalization. Help define concept definitions from clustering or topics analysis. |
|
| Techniques | Raw Text Import | Load the raw data into the text analysis tool. |
| Text Parsing | Normalize and stem, and filter the original data. | |
| Vector Space Model | Create a quantitative representation of the data. | |
| Terms by Document Matrix | A row and columns table (matrix) that encompasses the frequency of each term present in documents. | |
| Dimension Reduction | Create a simplified representation of the original data in lower dimension. | |
| Singular Value Decomposition (SVD) | Linear algebra mathematical technique used to reduce the number of rows while preserving the similarity structure among columns. | |
| QR Decomposition (Factorization) | Linear algebra/mathematical technique for matrices decomposition. | |
| Similarity Measure between Documents | Provide a measure of distance or similarity among documents. For example, cosine similarity measure is used in some information retrieval. | |
| Clustering, Classification Predictive Model | Group and classify input raw text into categories. | |
| Tools | Open Sources and Paid Software | Analyze text data by leveraging prebuilt algorithms or packages. |
Exhibit 3.10 The T3 Summary Table
There are also powerful artificial intelligence APIs that could be leveraged to help you harness your unstructured data, whether it be text audios videos or images.
So if you don't have data scientist talent in house—positions that are currently very hard to fill—you can leverage UDA APIs provided by companies such as Microsoft, Amazon Google, IBM, Kairos, Trueface.ai, and API.ai. These APIs are pretty scalable and can help you quickly get some actionable value from your unstructured data.
CASE STUDY
This example provides a comprehensive overview of how the IMPACT cycle is applied to text mining, expanding the previous example. Readers not interested in understanding the how-to could skip this case study and go to the Key Takeaways section.
Text Analytics Vocabulary
Let's review descriptions of each text analytics technique mentioned in the previous sections and provide useful definitions.
Important to note: If you are not interested in understand text analytics jargon used in the previous sections, feel free to skip the following section that discusses text analytics vocabulary. You can jump into the last section of this chapter, Key Takeaways, to conclude the chapter.
- Clustering is concerned with grouping different objects or people that have similar characteristics (like customer wants and needs) with one another, and that are dissimilar or different from other objects or people in other groups.
- Text clustering is about applying clustering to text documents. It involves measuring the similarities between documents and grouping them together. An unsupervised text analytics technique, it breaks documents into clusters by grouping together documents that have similar terms, concepts, and topics. It could also be used to group similar documents such as tweets, newsfeeds, blogs, resumes, and job openings into categories. Text clustering can be used to analyze textual data to generate topics, trends, and patterns. There are several algorithms that can be used in text clustering.
- Information retrieval: Information retrieval is concerned with comparing a query with a collection of documents to locate a group of relevant documents. Google search queries are good examples of information retrieval that leverages text analysis. Some techniques, such as QR factorization or SVD, are generally used to achieve this goal. We will also discuss these techniques in the next section.
- Classification or categorization helps to assign a class or category to a document based on the analysis of previous documents and their associated categories. This is a supervised process where a sample of the data with a known category is used to train the model, for instance, job postings with their respective occupations. The classification model will create a knowledge base from a sample of jobs descriptions with occupations which will enable assigning occupations to new jobs postings which have missing occupation designations.
Predictive models could be applied here to classify new documents, categorize new e-mails as spam, or detect and predict fraudulent activity.
Additional Useful Text Mining Vocabulary
The following is a list of terms useful in understanding some details of UDA.
Vector Space Model
For information retrieval, indexing, filtering, and relevancy ranking, the vector space model is an algebraic model used to represent any set of documents (text or images) as vectors of identifiers (rows and columns), where rows represent documents and columns represent document terms.
Let's illustrate vector space based on the following search queries from two documents:
Doc_1: customer loves meat
Doc_2: customer loves vegetables
Without doing any text filtering, the vector space model of Doc1 and Doc2 is represented in the table in Exhibit 3.16. It is a binary representation of the documents and their terms, where:
- 1 means the word (term) appears in the document
- 0 means the word (term) does NOT appear in the document
- Word frequency location filtering and normalization have been applied to this representation
| Customer | love | meat | vegetable | |
| Doc_1 | 1 | 1 | 1 | 0 |
| Doc_2 | 1 | 1 | 0 | 1 |
Exhibit 3.16 Vector Space Model
Term
Term refers to words, punctuation, phrases, multiword terms, expressions, or simply put, a token in any given document.
Document
A document is a collection of terms. It could be a title, a phrase, a sentence, a paragraph, a query, or a file. For instance, a resume, a news article, or a blog post could be considered documents in text analytics.
Corpus
A corpus is a collection of text data that is used to describe a language. It could be a collection of documents, writings, speeches, and conversation.
Exhibit 3.17 showcases examples of term, document, and corpus.
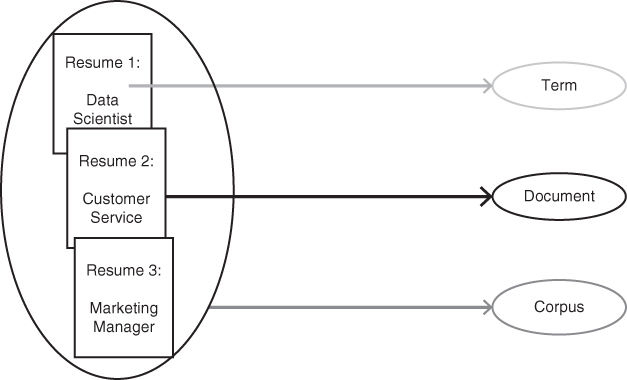
Exhibit 3.17 Term, Document, and Corpus
Stop Word List
Stop word lists are a set of commonly used words in any language that are ignored or removed during the text parsing due to their lack of relevance or value in the text analysis. For instance, articles, conjunctions, and prepositions provide little information in the context of a sentence.
Stop words are important in text analytics because they enable focus on the more important words to find pattern, trend, and meaning in text data. For instance, if we were to perform a search: “How to become a data scientist?” The search engine would find web pages that contain the terms how, to, become, a, data, and scientist. All the pages found with the terms how, to, and a would flood the search, since they are more commonly used terms in the English language, compared to data and scientist. So, by disregarding the frequent terms, the search engine can focus on retrieving pages that contain the keywords become, data, and scientist and the results will be closer to what we want.
Stop words are useful before clustering is applied. Commonly used stop words include:
- Prepositions: There are about 150 prepositions in English, such as about, above, across, as, at, along, around, before, below, but, by, beyond, for, from, in, into, of, over, than, to, since, via, with, without, and the like.
- Determiners: a, an, any, another, other, the, this, that, these, those, and the like.
- Some adjectives: kind, nice, good, great, other, big, high, different, few, bad, same, able, and the like.
It is important to note that for some analyses, such as sentiment analysis, some stop words should be included in the text mining to be able to find patterns, trends, and sentiments. When performing sentiment analysis, some information retrieval tools (search engine) will simply avoid removing those stop words to optimize the search results.
You can define and build your own stop words based on the type of analytics, domain, or industries you envision to apply text analytics. You can also define a role for your stop words and decide to include or exclude them if they are used as verbs or nouns. A good example is the word show. It could be excluded if it were used as a verb (display) while it would be included when it is used as a noun (spectacle). There are publicly available stop word lists that many text analytics software and open source tools use.
Start Word List
These lists enable you to control which terms are used in a text mining analysis. A start word list is a dataset that contains a list of terms to include in the parsing results. If you use a start word list, then only terms that are included in that list appear in parsing results.
Stemming
Stemming refers to the process of finding the stem or root form of a term. Like the start and stop word lists, most software uses predefined dictionary-based stemming. You can also customize your stemming dictionary to include a specific stemming technique, as in using declar as the stem for declared, declares, or declaration.
Parts of Speech
Parts of speech (POS) are the basic types of words that any language has. Each part of speech explains how the word is used. Words that are assigned the same POS have similar behaviors in terms of syntax and have similar roles within the grammatical structure of sentences in terms of morphology. In English, there are nine parts of speech: articles, nouns, pronouns, adjectives, verbs, adverbs, conjunctions, prepositions, and interjections.
Entity
An entity is any of the several types of information that should be distinguished from general text during text mining. Most text analytics software can identify entities and also analyze them as a unit. Entities are also normalized. You can customize the list of entities based on the domain to which you are applying text mining. Most software programs have a dictionary of normalized entities, such as company name, that will include a list of companies in a given country with all the taxonomy related to the name. An example of entity company name is: International Business Machine: IBM.
Entities that are commonly used include: person, proper noun, product, location, address, phone, time, date, company, currency, measure, organization, percent, Social Security number, code, or vehicle. You can modify this list of entities to include or exclude others based on the analysis you envision.
Noun Groups
A noun group is a group of words, nouns or pronouns, in a document collection. Noun groups are identified based on linguistic relationships that exist within sentences. Noun groups identified in text mining act as single units. You can choose, therefore, to parse them as single terms.
It is important to note that stemming noun groups will treat the group as a single term; for example, case studies is parsed as case study.
Synonymy
A synonym refers to a word or phrase that shares the same meaning with another word or phrase in the same language. Words that are synonyms are said to be synonymous, and the state of being synonymous is called synonymy.
Synonymy is very useful in text analytics, as it helps to reduce the redundancies by treating words with the same meaning as equivalents. A synonym list enables you to specify different words that should be processed equivalently, for instance, vehicle and car.
Polysemy
Polysemy refers to the capacity of a word term to have multiple meanings or senses: for instance, the word show could refer to a spectacle (noun), but it could also mean to display (verb). Polysemy is very useful in NLP and text mining, such as sentiment analysis.
N-grams of texts refer to a set of co-occurring words from a given sequence or window. An n-gram of size 1 is referred to as a unigram, size 2 is a bigram, size 3 is a trigram. Larger sizes are sometimes referred to by the value of n, for example: four-gram, five-gram, and so on. When building the n-grams you will basically move one word forward. You can also move two or more n words forward. For example, consider the sentence “The weather was really bad yesterday.”
If n = 2 (known as bigrams), then the n-grams would be:
- the weather
- weather was
- was really
- really bad
- bad yesterday
N-grams are extensively used in text mining and NLP tasks such as type-ahead spelling, correction, text summarization, and tokenization.
Zipf's Law: Modeling the Distribution of Terms
Zipf's law refers to the power law that is used to showcase terms' distribution across documents. Zipf's law is mathematically simple; it states frequencies proportionally. The most frequent word (i = 1) has a frequency proportional to 1, the second most frequent word (i = 2) has a frequency proportional to 1/2, the third most frequent word has a frequency proportional to 1/3, and so on (1/i: of Cfi ∼ 1/i).
Latent Semantic Analysis (LSA)
Latent semantic analysis (LSA)5 is a technique in NLP, like distributional semantics, in which relationships between a set of documents and the terms they contain are analyzed by producing a set of concepts related to the documents and terms. LSA assumes that words that are close in meaning will occur in similar pieces of text. A matrix containing word counts per paragraph (rows represent unique words and columns represent each paragraph count) is constructed from a large piece of text. Then SVD is used to reduce the number of rows while preserving the similarity structure among the columns. Words are compared by taking the cosine of the angle between the two vectors or the dot product between the normalizations of the two vectors formed by any two rows. Values close to 1 represent very similar words while values close to 0 represent very dissimilar words. LSA is used for information retrieval from search queries.
Dot Product
The dot product is a measure of a distance or angle between two vectors in each space coordinate. This operation takes two equal-length vectors (or sequence of numbers) and returns a single number. Algebraically, it is the sum of the products of the corresponding entries of the two sequences of numbers. Geometrically, it is the product of the Euclidian magnitudes of the two vectors and the cosine of the angle between them. For instance, let vectors V1 = [1, 2, 3] and V2 = [4, 5, 6]; the dot product (V1, V2) = 1 × 4 + 2 × 5 + 3 × 6 = 32.
Dot products and cosines are used to measure the similarity between documents. Once a quantitative representation of document is created, the cosine is used to measure the similarity between vectors that represent each term document.
NOTES
FURTHER READING
- Russ Albright , “Taming Text with the SVD,” 2004: ftp://ftp.sas.com/techsup/download/EMiner/TamingTextwiththeSVD.pdf
- Russell Albright , James A.Cox, and KevinDaly, “Skinning the Cat: Comparing Alternative Text Mining Algorithms for Categorization,” Proceedings of the 2nd Data Mining Conference of DiaMondSUG, Chicago, IL. DM Paper 113 (Cary, NC: SAS Institute), 2001: https://pdfs.semanticscholar.org/db99/a4bd20b0054975a2b4498d7e7fd7d6158c16.pdf