CHAPTER 1
The Age of Advanced Business Analytics
In God we trust; all others must bring data.
—Attributed to W. Edwards Deming
INTRODUCTION
If you believe that the data analytics revolution has already happened, think again. After the steam engine, mass production, and Internet technology, the Internet of Things and artificial intelligence make up the fourth industrial revolution. However, the motor of this fourth revolution is analytics. The impact of analytics in our societies, our communities, and the business world has just begun. In fact, knowledge gained from analytics in the recent years has already reshaped the marketplace, changing the way we shop, buy, think, vote, hire, play, choose, date, and live. With more than 20 billion connected devices by 20201 and more than 5 billion people with IP addresses sharing information and intelligence by 2025, the pace of upcoming changes resulting from analytics is mind boggling. The Internet of Things was the genesis of the Analytics of Things and Analytics of Apps. In the Analytics of Things era, new knowledge, resulting from artificial intelligence, like machine learning, deep learning and cognitive analytics, and blockchain, will be gathered from complex information networks flowing from billions of connected devices and from humans interfacing with their intelligent devices such as machines, apps, and wearables of all kinds.
Today, companies are under extreme pressure to dig deeper into and connect all information and pieces of data at their disposal to find new differentiators from their competition. They need to better understand their market, customers, competitors, and talent pool. They also need to think laterally and look for creative ideas and innovations in other fields. Think of all the new information layers that are at their disposal to help them achieve this goal. Exhibit 1.01 showcases the five layers of new information that are being generated and helping organizations to create business value.
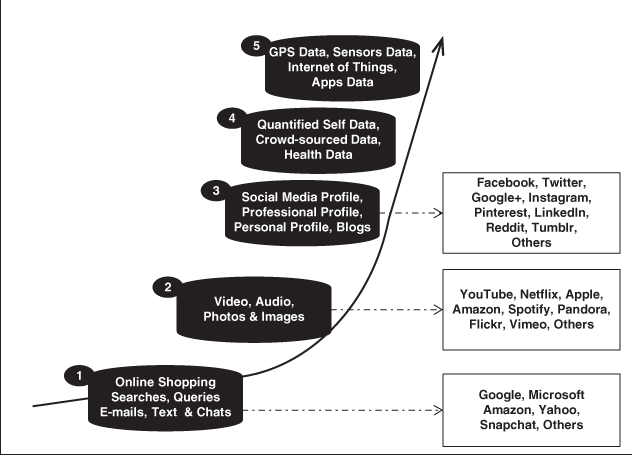
Exhibit 1.01 The Exponential Growth of New Information: The Five Layers
Exhibit 1.02 showcases the exponential growth of digital information. According to International Data Corporation (IDC) estimates, by 2020, data production will balloon to 44 times what it was in 2009.
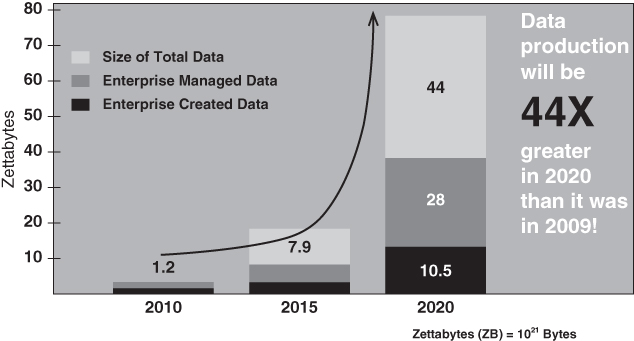
Exhibit 1.02 Data Production Evolution
Source: CSC IDC Estimate
Customers and users have become more technology-savvy and are expecting more from their service providers or product manufacturers. They are very fickle and can switch to the competition with a single click. They have options and a lot of choices. They expect their service provider to know their habits, wants, and needs and even to anticipate their next move or transaction. Therefore, for any leading organizations poised to play in this digitized data economy where consumers and users are empowered, selective, and highly informed, analytics is key.
Analytics enables organizations of all sizes to meet and exceed customers' expectations by becoming data-driven to play in the new digital economy, where customers and market deep knowledge are front and center. However, to harness and create actionable insights from the complex user- and machine-generated data, organizations need to apply science to that data. Yes, science. In data science, specialists play with unorganized or “messy” data2 to distill the intelligence differentiator.
Data Scientist: The Sexiest Job of the Twenty-First Century
You probably came across this concept if you read Harvard Business Review in October 2012. In their article,3 Thomas H. Davenport and D. J. Patil provided a comprehensive overview of the prominent job occupation for Big Data tamers. They underscored the sudden rise of data science in the business scene.
For those of us with a math and computer science background, being labeled as sexy was a shock. When I was a graduate in mathematics and statistics, most of my class was made up of men. We were referred to as “those guys” or “those geeks,” and we were mostly left alone by others. Our program was perceived as difficult to understand or too theoretical. This made our field of study very hermetic and unappealing to many. At that time, none of us could see a real-life application resulting from linear algebra. How did all the theorems and concepts we were learning apply to the business world? Our ideal career pathways in those days were math teacher or researcher, not data scientist. The term was not sexy at that time.
Studying the theory of vector space along with the concept of singular value decomposition (SVD) in algebra, we manually decomposed a matrix into a product of three matrices. We understood SVD was useful in dimension reduction: It helped to transform any matrix with a universe of n vectors into a smaller number of vectors that contained all the information of the original complex matrix. For high-dimension matrices, the process was manually tedious, starting with finding eigenvalues and then building eigenvectors. While we became adept in SVD, we had no clue as to where this skill-set could be applied in real life. At that time, we didn't know that SVD would be used to analyze text. We didn't know that counting terms weights and using SVD dimension reduction would provide clean separation of customer opinion or text categorization and sentiment analysis. Now computers are proficient in running complex computations like SVD (see Chapter 3). It was when I entered the workforce that I finally came across the first application of SVD, embedded in a software program designed for text analytics. There it was, hidden in the technical section of the software: The theory of vectors space reduction power of SVD was leveraged. The text content was placed into a matrix, and a quantitative representation of the content matrix was then created. Eigenvalues and -vectors were found to reduce the content into a smaller number of vectors while retaining the essence of the original content. It turns out that the vectors space reduction and SVD I had learned in algebra were the foundations of most text analysis.
It is uncertain whether our professors had envisioned the real-life applications for the math theories they were teaching then. Only visionaries could have foreseen such an explosion of applications in our lives, today and in the future, given the new information layers I mentioned. Such foresight would have changed the evolution of the data science for sure. However, it is the explosion of technologies, the new information layers, and the empowerment of the consumers and users that have shed light on analytics and propelled it into a new science.
WHY THE ANALYTICS HYPE TODAY?
Analytics is now part of the bottom line of leading organizations and industries of all sizes and types. Some companies have used analytics to power growth and to move into new sectors. In today's global competitive landscape, where data never stops flowing and challenges and opportunities keep changing, a lot of hype surrounds advanced business analytics. Your company is probably constantly exhorted to build and implement strategies to collect, process, manage, and analyze data (big and small) and to create business value from it. And you are warned about the potential risk of falling behind your competition by not doing so.
The data scientist job title has been around for a few years; it was coined in 2008 by D.J. Patil and Jeff Hammebacher, data analytics leaders at (respectively) LinkedIn and Facebook. In fact, a lot of data scientists were working in leading companies long before the recent traction around data science. The rapid appearance of data analytics in the business arena came from Silicon Valley's online giant companies, such as Google, eBay, LinkedIn, Amazon, Facebook, and Yahoo!, all of which surged to prominence during the Y2K dot.com boom. These online firms started to amass and analyze the gigantic volume of data generated by the clickstreams generated through user searches. They pioneered the data economy by building data products, and Big Data invaded the business world. A new data economy was created; companies were inundated with information flowing from different sources, in varieties, volumes, velocity, and veracity that they wanted to harness to create actionable business value. The emergence of Big Data has triggered the overall traction around advanced business analytics, which was propelled by the consortium of the following pillars:
- Costs to store and process information have reduced
- Interactive devices and censors have increased
- Data analytics infrastructures and software have increased
- User-friendly and invisible data analytics tools have emerged
- Data analytics have become mainstream, and it means a lot to our economy and world
- Major leading tech companies have pioneered the data economy
- Big Data analytics has become a big market opportunity
- The number of data science university programs and MOOCs has intensified
1. Costs to Store and Process Information Have Reduced
The cost of storing information has significantly dropped: $600 will buy a disk drive that can store the entire world's music.4 In 1990, it cost $11,000 to buy 1 GB of disk space; today, 1 GB disk space costs less than 1 cent.5 Data storage and data processing have grown tremendously. The smartphones we all carry have more storage and computer power than a mainframe did in the 1980s. And large amounts of complex and unorganized data, such as audio, video, graphic, e-mail, chat, and text data, are widely available across infinite networks of computing environments at very low cost. In parallel, the cost of censors, photovoltaic cells, and all kinds of high-technology data-driven products has also decreased, enabling more people to use them—and generating more data to store and process.
2. Interactive Devices and Censors Have Increased
There are countless interactive devices such as smartphones, tablets sensors, surveillance cameras, and wearable devices that can capture, store, and send information, including everything we see, touch, hear, feel, and smell. This information no longer resides on an offline siloed desktop. It is instantly sent online via Internet Protocol (IP) and shared, transformed, and enriched by millions of users. Data is pumping in from a growing universe of connected sensors and machines.
3. Data Analytics Infrastructures and Software Have Increased
Over the past few years, there has been a rapid increase of data analytics tools and software that process and analyze data with unprecedented speed. Technologies such as artificial intelligence, machine learning, and deep learning are advancing more quickly than anyone anticipated.
The recent enthusiasm was propelled by the emergence of technology that makes taming Big Data possible, including Hadoop, the highly used framework for data file systems processing. Nowadays data scientists turn to Spark (and other tools) as a more efficient data processing framework. Open source cloud computing and data visualization capabilities are commonplace. A self-driving car, for example, can collect nearly 1 GB of data every second—it needs that granularity to find patterns to make reliable decisions. It also needs the computing power to make those decisions in a timely manner. As far as the computing power goes, we have moved from the central processing unit (CPU) to the graphics processing unit (GPU), and more recently, Google has developed the Tensor Processing Unit (TPU). During Google's 2017 I/O Conference, Google chief executive officer (CEO) Sundar Pichai discussed how Google is rethinking its computational architecture and building artificial intelligence and machine learning first data centers. He introduced Google's TPU, which supports Google's new artificial intelligence computational architecture, because, according to Google, TPUs are not only 15 to 30 times faster than CPUs and GPUs but also 30 to 80 percent more powerful. TPUs are now used across all Google products. In 2016, the TPU powered DeepMind AlphaGo during its historic 4–1 victory against Lee Sedol, the Go grandmaster. Machines can diagnose diseases, navigate roads, and understand and respond in natural language.
4. User-Friendly and Invisible Data Analytics Tools Have Emerged
There is an emergence of easy-to-use software that enables the processing and creation of actionable business value from the raw data. These user-friendly tools do not necessarily require technical background from the end user. Data analytics is becoming pervasive because the volume of data generated by embedded systems increases, and vast pools of structured and unstructured data inside and outside the enterprise are now being analyzed. According to David Cearley, vice president and Gartner fellow, “Every app now needs to be an analytics app.”6 Organizations need to manage how best to filter the huge amounts of data coming from the Internet of Things, social media, and wearable devices, and then deliver exactly the right information to the right person at the right time. He continues, “Analytics will become deeply, but invisibly embedded everywhere.” Big Data is the enabler and catalyst for this trend, but the focus needs to shift from Big Data to Big Analytics, because the value is in the answers, not the data.
5. Data Analytics Is Becoming Mainstream, and It Means a Lot to Our Economy and World
There has been a significant proliferation of analytics benefits from a variety of sectors and industries. Cases demonstrating how organizations and businesses are winning with analytics are more and more available and accessible to everyone. Marketing has been extremely powerful in sharing those success stories everywhere, from business magazines to traditional media. Depending on their level of analytical maturity and their most pressing business objectives, companies and organizations across different industries and business functions have embraced analytics to create business value and develop competitive differentiators. Following are examples where advanced analytics are impacting today's world:
Politics
- Politicians have been leveraging data analytics to be more successful at winning elections.
- Politicians use social media analytics to determine where they must campaign the hardest to win states, provinces, and cities in the next election.
- During the 2012 presidential election, President Obama's team tactically leveraged Big Data analytics to target fundraising messaging to voters by location, age, group, occupation, and interest. For instance, according to their models, women from 35 to 49 years old were more likely to respond to messages such as “Dinner with the president and George Clooney.” Data-driven targeted fund activities helped the Obama team raise more than $1 billion (an all-time record in any presidential campaign in modern history). The team optimized their campaign ad spend and, more importantly, targeted undecided voters in swing states to register and persuaded them to vote for Obama.
- Following the unexpected results of the 2016 election between Clinton and Trump, analysts attributed the discrepancy to five factors that traditional polling data could not capture: (1) A nontraditional candidate (no previous political history that resonated with traditional nonvoters); (2) An unprecedented investigation by the FBI during the final few days of the election; (3) The alleged influence of a foreign state; (4) The miscalculation in the distribution of voters (turnout) among different demographic groups; and (5) The impact of the “digital disruption of media,” which allowed so many new channels of conflicting information to spring up. The 2016 election is likely going to change how political analytics is conducted in the future.
- It is important to note that the Trump campaign also leveraged Big Data insights from a U.K.-based Big Data analytics company called Cambridge Analytica, the same company that helped the Brexit leaders to win. Cambridge Analytica crunched data for Donald Trump, building psychological profiles of American voters. They leveraged more than 5,000 pieces of data about every adult American from sources such as personality tests on social media, voting history, personality type, shopping history, and television and cable viewing history. Insights from this analysis helped the Trump campaign tailor its message and strategy in battleground states and win.
Sport & Entertainment
- Forward-looking companies use machine learning to analyze video content and identify key information aspects from it. Machine-learning technique is also helping them to uncover actionable insights from video content. These insights are helping their digital marketers to align their advertisements with the right videos and drive customer engagement.
- Companies such as New York-based Dataminr, which provides a market monitoring platform for Brand, help businesses monitor and track their brand and immediately take appropriate actions. For instance, the platform can identify tweets related to stock trading and monitor discussion threads and communications to identify relevance and urgency. News organizations such as CNN and BBC use similar unstructured data analysis (UDA) technology to quickly identify news stories and have reporters deployed or engaged to cover them in a timely manner.
- Video analytics and sensor data of tennis, baseball, and football games are used to improve the performances of players and teams. You can now buy a baseball with more than 200 sensors in it that will give you detailed feedback on how to improve your game.
- Augmented reality technology is used to overlay supplemental information, such as scores and other statistics, over a live video field in sporting events to enhance the viewers' experience.
- The Oakland Athletics (an American professional baseball team based in Oakland, California) pioneered analytics in sports, and now all teams use analytics. Today information and statistics about players are a prerequisite for recruitment.
- Spotify uses unstructured data analytics to provide its popular Discover Weekly playlists, which are personalized to our musical tastes. The company leverages collaborative filtering, convolutional neural networks, and natural language processing to scan music blogs, build microgenres, analyze the contents of playlists, and detect and eliminate outliers to find songs that fit our profile, but that we haven't yet listened to.
- Artists such as Lady Gaga are using data about our listening preferences and sequences to determine the most popular playlists for live performances.
Business
- Amazon uses analytics to recommend what books to buy; more than 35 percent of their sales are generated from these recommendations: “People who bought this book also bought …”
- Netflix leverages analytics to recommend movies you are more likely to watch. More than 70 percent of Netflix movie choices arise from its online recommendations.
- Pinterest leverages UDA to provide a personalized experience on its home feed by surfacing content each user would be more interested in seeing.
- Companies use sentiment analysis from Facebook and Twitter posts to determine and predict sales volume and brand equity.
- Target (a large retailer) predicts when a pregnant woman is due based on products she purchases. The company simply combines her loyalty card data with social media information, hence detecting and leveraging changing buying patterns. As a result, the company can target pregnant women with promotions for baby-related products. The company increased revenue 15 to 20 percent by targeting direct mail with product choice models.
- Google's self-driving car analyzes a gigantic amount of data from sensors and cameras in real time to stay safe on the road.
- The global positioning system (GPS) in our phones provides location and speed information for live traffic updates. Location-based data has generated billions of dollars for companies and even more value for users.
Healthcare
- Pediatric hospitals apply data analytics to livestreamed heartbeats to identify patterns. Based on the analysis, the system can now detect infections 24 hours before the baby would normally begin to show any symptoms, which enables early intervention and treatment.
- After winning the TV show Jeopardy, Watson the IBM supercomputer now assists physicians to better diagnose and cure aggressive diseases such as cancers. Watson is being enlisted to help doctors predict cancer in patients. Watson has greatly speeded diagnosis of acute myeloid leukemia, a type of blood cancer, as well as glioblastoma multiform, an aggressive brain cancer.
- DNA sequencing: It took 10 years to sequence the DNA of one person, at a cost of more than $100 million. Today, DNA sequencing is done very quickly for less than $99. This availability leads to personalized medicine and drug prescriptions. Genomic precision medicine is becoming a game changer.
- Natera can predict Trisomy 21 disease without the risk of miscarriage from an amniocentesis test just by testing blood from the mother-to-be. The results of that blood test have a 99 percent accuracy rate, similar to those from the traditional amniocentesis test.
Government, Security, and Police
- The FBI combines data from social media, closed-circuit television (CCTV) cameras, phone calls, and texts to track down criminals and predict terrorist attacks.
- JPMorgan Chase & Co. invested $837 million in people analytics to anticipate rogue employee behavior that has cost the bank more $36 billion since the end of the 2008 financial crisis.
Human Capital Management
- HR analytics companies are now using people analytics to optimize talent management. Big Data analytics help to attract, acquire, develop, and retain talent. Google, Cisco, Microsoft, GE, Xerox, Bloomberg, Deloitte, and Pfizer have been accumulating success stories and benefits from people analytics to optimize their talent equation.
6. Major Leading Tech Companies Have Pioneered the Data Economy
Major tech companies such as Google, Facebook, eBay, Amazon, LinkedIn, and Yahoo began to monetize their data. As a result, their entire businesses reside on their ability to harness the data at their disposal. Most recently, some of these companies shared Big Data analytics algorithms they pioneered with the public: open source, Hadoop, and Spark. As a result, entire businesses that stem from data analytics and raw data have been developed. A new digital economy was born, in which data is the currency and analytics sets the trading rules. Data analytics has become pervasive and omnipresent. Social media, cloud, mobile, and Big Data provide disruptive ways to capture, process, analyze, and communicate data analytics findings and recommendations.
7. Big Data Analytics Has Become a Big Market Opportunity
Big Data analytics has a big market opportunity: The research firm IDC forecast that the market opportunity for Big Data and business analytics software, hardware, and services will grow by 50 percent from 2015 to 2019. This means that the market size will reach 187 billion by 2019. Services accounting for the largest portion of the revenue with manufacturing and banking poised to lead the spend.7
8. The Number of Data Science University Programs and MOOCs Has Intensified
Before Big Data, there were no university data science programs or degrees. The need to harness the complex volume of so-called “messy” data such as images, text, audio, video, chat, graphics, and pictures forced universities to adapt. The article “Big Data: The Next Frontier for Innovation, Competition, and Productivity” from McKinsey&Company8 has played a key role in raising the awareness of the eminent data scientist labor shortage. According to the article, in 2018, there will be 140,000 to 190,000 data scientists and 1.5 million data-savvy managers. This headline has pulled the alarm signal, creating awareness among organizations eager to join the new data economy.
A variety of business schools and universities now offer data mining and data science programs and degrees. In the United States alone, there are more than 20 universities offering data science programs,9 as well as a panoply of executive programs covering data analytics either locally from universities' classrooms or via the Internet and videos. This has led to the multiplication of massive open online courses (MOOCs). MOOC distance education was first introduced in 2008 and emerged as a popular mode of learning in 2012,10 and offers a lot of data science modules and programs.
The top of the list includes MOOCs in Exhibit 1.3, organized based upon the date of inception.11
| MOOC Name | Inception Date | Founders | MOC Summary/Value Proposition |
| Khan Academy | 2006 | Salman Khan | Khan Academy is a nonprofit educational organization that produces YouTube videos of short lectures on specific topics within many subject areas to supplement classroom learning. It uses online tools to provide meaningful educational content to students |
| Udemy | 2010 | Eren Bali, Octay Caglar, and Gagan Biyani | Udemy is an online learning platform that does not focus on traditional college courses. Instead it enables instructors to build online courses aimed at professional adults and offer those courses to the public. |
| Udacity | 2011 | Sebastian Thrun, David Stavens, and Mike Sokolsky | Udacity is a for-profit educational organization that originally offered traditional university courses, but in 2013, it shifted focus to vocational courses for adult professionals |
| edX | 2012 | Harvard University and the Massachusetts Institute of Technology (MIT) | edX provides interactive online classes in a wide number of subjects, ranging from biology, chemistry, and engineering to law, literature, and philosophy from partner organizations including university MOOC. |
| Coursera | 2012 | Andrew Ng and Daphne Koller (Stanford University computer professors) | Coursera partners with universities to offer online courses in a wide range of subjects. Its student users can even pursue specializations and degrees as well as a comprehensive list for data science programs. |
Exhibit 1.03 MOOCs
Other MOOCs include Future Learn Open Education Europe and The Open University Classroom.
At Harvard University, more people signed on in one year to the online courses than had graduated from the university in its 377 years of existence.
In addition, communities' and analytics groups' niche sites have been proliferating. The ever-growing data volume has put more pressure on companies to hire data scientists. This job occupation has been a hard-to-fill position, a situation that is not poised to change. How did we get here? What is the timeline that led to the Analytics Age?
A SHORT HISTORY OF DATA ANALYTICS
Modern UDA has been 58 years in the making. In 1958, IBM engineer H. P. Luhn wrote an article in which he indicated that business intelligence is the analysis of structured and unstructured text documents. In that article, he defined business intelligence as a system that will:
However, the first representation of data in rows and columns can be traced back in the second century in Egypt! With today's fast evolution and revolution of technology (software and hardware), data mining, business intelligence, and UDA have evolved rapidly since 1958. Past unresolved analytics problems are now being addressed, thanks to the sophistication of tools and software. Consider Siri, Apple's voice recognition technology for the iPhone. Siri's origins go back to a Pentagon research project that was spun off as a Silicon Valley start-up. Apple bought Siri in 2010 and has been feeding it data ever since. Now, with people supplying millions of questions, Siri is becoming an increasingly adept personal assistant, offering reminders, weather reports, restaurant suggestions, and answers to an expanding universe of questions.
From a historical perspective, consider the following timeline, which outlines key milestones leading to the current state of UDA:
- Second century: In Egypt, the first table with data represented in rows and columns.
- Seventeenth century: The two-dimensional graph is invented by René Descartes (French philosopher and mathematician).
- 1756–1806: The line graph, line chart, line bar chart, and pie chart were invented by William Playfair.
- 1856–1915: Frederick Winslow is credited for applying engineering principles to factory work, which was instrumental in the creation and development of industrial engineering.
- Eighteenth and nineteenth centuries: Modern statistics emerged, with A. Fisher and Karl Spearman introducing factor analysis and principal components analysis (PCA). Spearman introduced PCA in 1901.
- 1958: The first definition of business intelligence as text analytics or document analysis appeared. H. P. Luhn, an engineer from IBM, introduced the idea of basic stats analysis on text terms. He also introduced the concept of text summarization, but the software and the tools were not ready to support it.
- 1960–1980: The focus was on database technology and relational databases.
- 1970–1980: Analytics became mainstream. John Tukey published Exploratory Data Analysis in 1977.
- 1980–1990: Business intelligence emerged as software categories and a field of expertise, but the focus was on numeric-coded data and relational databases.
- 1990: Scott Deerwester, Susan T. Dumais, George W. Furnas, Thomas K. Landauer, and Richard Harshman introduced the first application of SVD to text mining in their article, “Indexing by Latent Semantic Analysis,” in the Journal of the Association for Information Science and Technology.
- 1990: The World Wide Web became global with its influx of data clickstreams and searches.
- 1990–2010: Text analytics and data mining rose in prominence. Companies such as AltaVista and Teragram focused their efforts on search and text mining.
- 1995–1998: Online giant firms came to life: in 1995, Amazon and eBay, and in 1998, Google, Hotmail, and PayPal.
- 2010–Present: Currently, there are advances in advanced text analytics and semantics. Social media analytics, human resources (HR) analytics, healthcare analytics … the current trend is the Analytics of Things.
The last step in Exhibit 1.4 illustrates how semantics really is the future in the analysis of unstructured data:
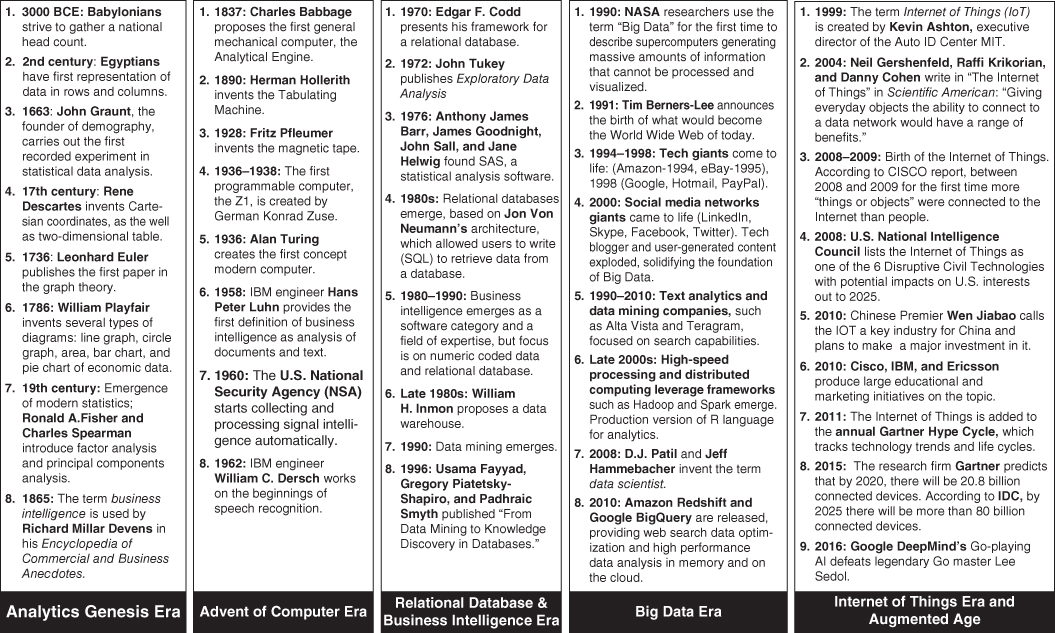
Exhibit 1.04 Analytics Evolution
- 2000: Social media giants came to life: in 2003 LinkedIn and Skype, in 2004 Facebook, and in 2006 Twitter.
- Late 2010: A variety of UDA solutions providers, vendors, and open sources were available: more than 70 commercial and 30 open source.
Early Adopters: Insurance and Finance
To best navigate today's globally connected competitive marketplace, which has been propelled by the explosion of digital information, companies have been embracing analytics at different paces to derive strategic insights.
From an industry perspective, some early adopters pioneered the integration of analytics into their business processes, then the late adopters followed, and finally the laggards trailed far behind. While most businesses have heard about the benefits of analytics, some struggle to move beyond basic reporting. However, the majority of leaders are requesting their analytics team to deliver on Big Data promises, monetizing their data by creating new data products and services to truly compete on analytics—as one CEO told me, “to rethink our analytics journey.”
In Win With Advanced Business Analytics,13 I described how the insurance and financial service industries have been pioneers in collecting, managing, and leveraging predictive analytics to create actionable insight from their data. Given the mandatory reporting environment of these fields, not to mention the direct correlation between accurate data and revenue, these industries first began using analytics in the 1800s to price life insurance and underwrite marine insurance. They have since continued innovating, undergoing many waves of improvement, including the use of neural networks14 to optimize premiums, the introduction of credit scores in evaluating a customer's financial position, and the use of various behavioral, third-party, and social media datasets to supplement their forecasts and future predictions.
Over the years, the success stories have been numerous, and financial institutions that are not currently using predictive analytics in product pricing and underwriting are seen as obsolete and doomed to failure. As a result, these companies are now developing new applications and expanding their analytics into different business units. For instance, safety analytics is the science of using information about a company's current state and other geodemographic data to prevent accidents from happening and avoid the associated insurance costs by creating a safer workplace. Similarly, claims analytics is a discipline in which claim severity (amount of loss) is scrutinized for drivers of high-dollar claims by injury type. It aims at understanding and predicting probable losses (damages, litigation costs, etc.) based on frequency, severity, and other characteristics of the claims. Claims analysis is also used for early identification of litigious claims, efficient claims settlement, adequate loss reserving, and claims predicting, among other activities.
Fraud analytics is also a hot topic. It is estimated that fraud claims cost the insurance industry between $5 and $7 billion every year. Complex predictive models designed to find intricate patterns of unusual behavior to uncover fraudulent schemes are being used by various insurance organizations and state agencies throughout the United States. Models that use machine-learning techniques to adapt to new schemes are being built and put into production to pinpoint which incoming claims are likely to be fraudulent, prompting an investigation.
Today, major players in the data economy are monetizing their data to create new products and services, making their data the most powerful currency in this digital world.
The evolution of analytics can be summarized in three major eras:
- Analytics before Big Data
This analytics era was characterized by relational databases, data warehouses (DWHs), statistical analyses performed on samples, and numeric-based analytics. The advent of computers and the growth of personal computers have helped to increase adoption.
- Analytics in the Big Data era
The advent of Internet (World Wide Web) and the birth of Silicon Valley's online business behemoths such as Google, LinkedIn, Facebook, Amazon, and Yahoo! pioneered the digital economy and promoted the analysis of new types of complex and messy user-generated data. This enabled the development of infrastructures and tools powered by Hadoop and Spark cloud computing mobile, with computing power that made data processing, analysis, and distribution more efficient and effective than ever before. This analytics era is also defined by the emergence of computing power that enabled the realization of artificial intelligence (AI), machine learning, representation learning, and deep learning. The Big Data era fed those algorithms with endless data to learn by experience and to understand the world in terms of hierarchy of concepts. It also provided new solutions to previously unsolved problems, such as computer recognition of images and video.
- Post–Big Data analytics era: The Analytics of Things and Apps, cognitive analytics, and the Augmented Age
As demonstrated in Exhibit 1.4, we are just at the beginning of the Analytics of Things era, and disruptive changes are coming within the next decade. Billions of connected devices and intelligent machines interacting with human beings will generate a tsunami of data that organizations and companies will have to analyze to play in the data economy. The post–Big Data era will also be defined by cognitive analytics and the real-time integration of AI, machine learning, representation learning, and deep learning algorithms to address business and societal challenges coming from billions of connected objects. More importantly, these algorithms will build a dynamic intelligence based on the interaction between human censors and computers, using natural language to communicate with computers and devices for the most part.
We are now heading into the augmented age, where Big Data, Internet of Things, intelligent apps, and AI will provide additional insights at our fingertips. Think about what we do today when somebody asks you a question and you don't know the answer. Your smartphones automatically come to your rescue, enabling you to Google the information needed. As Maurice Conti, chief innovation officer at Telefónica, eloquently put it:
Where does your organization sit on this scale?
WHAT IS THE ANALYTICS AGE?
The Analytics Age is simply a data-driven, intelligence-driven environment. It is an era in which questions related to business, people management, and consumer behaviors are addressed using data intelligence. A period in which data intelligence for decision making is the new norm. Where best-in-class, data-driven companies are using machine learning and a deep analytics arsenal to understand customers/consumers, voters, players, talent, court rulings, patents, and markets, and to develop new products in response. Whether in sports, politics, entertainment, healthcare, HR, legal services, research, security, or government, the usage of analytics is pervasive. In this Analytics Age, complacent companies and organizations not using analytics are considered laggards and risk being left behind.
The speed at which technology has evolved, enabling the capture, storage, and rapid processing of information without limit, has set the foundation for the Analytics Age. Gone are the days where part of the web log data had to be purged for lack of space, and where building models was limited to running cumbersome samples and queries on the entire customer base. In the Analytics Age, data is the currency, and decisions are made in real time or near-real time. This new era is a playground for artificial intelligence, machine learning, and deep learning.
In the Analytics Age, companies can now address business questions that were previously ignored or omitted because there was no software robust enough to process and analyze the data. Physicians can make better diagnoses of some diseases by leveraging image recognition software powered with deep learning algorithms. Even though the mathematic formulae used in today's analytics were developed a while ago, the interest in applying analytics to business and real world questions is a new phenomenon. Previously, data intelligence and applied analytics were mostly living in research labs. In marketing, analytics climaxed with the emergence of the World Wide Web and its influx of clickstream and search data. Marketers were even praised for their intuition and creativity in developing and executing campaigns. They started asking questions such as:
- Which customers should we retain?
- Which prospects should we acquire?
- Which customers should we win back?
- Which customers should we upsell?
- To whom should we market?
As a result, marketing analytics became a must-have department in every respected data-driven organization.
In 2009, Hal Varian, chief economist at Google, said, “I keep saying the sexy job in the next ten years will be statisticians.”16 When people laughed, he argued that marketers could gain a 360-degree understanding of their customers, given that they had access to resources and could interpret them with statistics and mathematics. Such resources could transform data from multiple sources into actionable insights to address business challenges.
There is an intensifying demand for science, technology, engineering, and math (STEM) occupations, as the world is becoming an economy of service. A service economy requires a full understanding of customers' needs, preferences, habits, and more importantly customer satisfaction drivers. A happy customer is a customer who does not need to ask, one who has a great experience when doing business with you. Companies should follow the footsteps of the Silicon Valley giants: monetize their data in all capacities by creating data services and data products that will help them achieve a 360-degree understanding of their customers.
NOTES
FURTHER READING
- Natalino Busa , “The Evolution of Data Analytics,” SlideShare.net, May 12, 2015: www.slideshare.net/natalinobusa/the-evolution-of-data-analytics-48033452
- Bloomberg Technology video, “Why Big Data Failed to Predict the U.S. Election,” Bloomberg.com, November 9, 2016: www.bloomberg.com/news/videos/2016-11-10/why-big-data-failed-to-predict-the-u-s-election
- Cray, Infographic: “The Evolution of Data Analytics.” www.cray.com/sites/default/files/resources/evolution-of-data-analytics-infographic.pdf
- Thomas H. Davenport , “Analytics 3.0,” Harvard Business Review, December 2013: https://hbr.org/2013/12/analytics-30
- Robert Handfield , “A Brief History of Big Data Analytics,” International Institute for Analytics (September 26, 2013): http://iianalytics.com/research/a-brief-history-of-big-data-analytics
- Mathew Ingram , “Here's Why the Media Failed to Predict a Donald Trump Victory,” Fortune, November 9, 2016: http://fortune.com/2016/11/09/media-trump-failure/
- Alex Jones , “Data Analytics for Business Leaders Explained,” KDnuggets.com (September 2014): www.kdnuggets.com/2014/09/data-analytics-business-leaders-explained.html
- Masashi Miyazaki , “A Brief History of Data Analysis,” FlyData.com (March 11, 2015): www.flydata.com/blog/a-brief-history-of-data-analysis/
- Reuters, “Decoded: Why the Opinion Polls Failed to Predict the Trump Win,” DNAIndia.com, November 10, 2016: www.dnaindia.com/world/report-decoded-why-the-opinion-polls-failed-to-predict-the-trump-win-2272109
- Ira Simon , “The Evolution of Analytics: Then and Now,” Industry Perspectives, The VAR Guy guest blog, June 10, 2014: http://thevarguy.com/blog/evolution-analytics-then-and-now
- “Wise after the Event, or Why Big Data Failed to Predict President-Elect Trump,” Cyber Security Intelligence, November 29, 2016: www.cybersecurityintelligence.com/blog/wise-after-the-event-or-why-big-data-failed-to-president-elect-trump-1892.html