Chapter 4. Performance
This chapter covers the following subjects:
• Tune and Optimize vSphere Performance —This section covers tuning ESXi host resources and configuring advanced settings.
• Optimize Virtual Machine Resources - This section covers tuning and sizing virtual hardware resources for virtual machines.
• Utilize Advanced vSphere Performance Monitoring Tools - This section covers utilizing commands to collect and analyze performance data.
• Troubleshoot CPU and Memory Performance - This section covers troubleshooting CPU and Memory related issues that affect ESXi host and VM performance.
• Troubleshoot Network Performance and Connectivity - This section covers utilizing commands and other tools to troubleshoot network performance and connectivity related issues.
• Troubleshoot Storage Performance and Connectivity - This section covers utilizing commands and other tools to troubleshoot storage performance and connectivity related issues.
• Troubleshoot vCenter Server and ESXi Host Management - This section covers troubleshooting vCenter Server and ESXi host management related issues.
This chapter contains material pertaining to the VCAP5-DCA exam objectives 3.1, 3.2, 3.4, 6.2, 6.3, 6.4, 6.5
This chapter is intended to provide you with the knowledge and skills to successfully execute performance tuning, optimization, and troubleshooting. It is also intended to ensure that you have the skills to successfully complete the performance analysis, configuration, and troubleshooting tasks that might be part of the VCAP5-DCA exam. As you read this chapter, take time to practice the steps that are provided until you are confident that you can perform such tasks quickly and without any assistance. Some of these steps involve using the vSphere Client. Others involve using the vCLI and PowerCLI.
“Do I Know This Already?” Quiz
The “Do I Know This Already?” quiz allows you to assess how well you might already know the material in this chapter. Table 4-1 outlines the major headings in this chapter and the corresponding “Do I Know This Already?” quiz questions. You can find the answers in Appendix A, “Answers to the ‘Do I Know This Already?’ Quizzes and Troubleshooting Scenarios.” Because of the advanced and hands-on nature of this particular exam, you should read the entire chapter and practice performing all the described tasks at least once, regardless of how well you might do on this quiz. This quiz can be helpful to determine which topics will require the most effort during your preparation.
Table 4-1. “Do I Know This Already?” Foundation Topics Section-to-Question Mapping
1. Which option summarizes the steps that can be taken to ensure that an ESXi host supports SplitRx Mode?
a. Select the ESXi host, navigate to Configuration tab > Advanced Settings, and set Net.NetSplitRxMode = true.
b. Select the ESXi host, navigate to Configuration tab > Advanced Settings, and set SplitRx-Mode = true.
c. Select the ESXi host, navigate to Configuration tab > Advanced Settings, and set Net.NetSplitRxMode = 1.
d. Select the ESXi host, navigate to Configuration tab > Advanced Settings, and set SplitRx-Mode = true.
2. Which option summarizes the steps that can be taken to calculate the available remaining memory resources in a DRS cluster that are not reserved for VMs or resource pools?
a. Choose the cluster, navigate to Performance tab > Overview Graphs, and select the Available Memory graph.
b. Choose the cluster, navigate to Performance tab > Overview Graphs, select the Memory Usage graph, and manually calculate the available memory by subtracting Memory Used in the graph from the known total memory capacity of the cluster.
c. Choose the cluster and navigate to the Resource Allocation tab.
d. Choose the cluster and navigate to the DRS tab.
3. Which option summarizes the steps that can be taken to save a custom profile in RESXTOP?
a. Press the W key and enter a filename at the prompt.
b. Press the w key and enter a filename at the prompt.
c. Press the P key and enter a filename at the prompt.
d. Press the p key and enter a filename at the prompt.
4. Which option summarizes the steps that can be taken to determine whether a Windows VM needs to be resized with more memory?
a. Use the vSphere Client to determine whether ballooning is high for the VM.
b. Use esxtop to determine whether the SWCUR value is higher than zero for the VM.
c. Use the vSphere Client to determine whether memory compression or swapping is occurring on the ESXi host where the VM is running.
d. Log in to the Windows VM and use Windows Performance Monitor to determine whether Pages per Second is high.
5. Which option summarizes the steps that can be taken using the ESXi Shell to display configuration and statistics for a dvSwitch?
a. Use the esxcli network dvswitch namespace.
b. Use the esxcfg-dvswitch command.
c. Use the esxcli network core dvs namespace.
d. Use the net-dvs command.
6. Which option summarizes the steps that can be taken to identify all the iSCSI adapters in an ESXi host?
a. Use the vSphere Client to navigate to Configuration tab > Storage > iSCSI Adapters.
b. Use the esxcli iscsi adapter list command.
c. Use the esxcli storage adapter iscsi list command.
d. Use the esxcfg-iscsi –l command.
7. Which option summarizes the steps that can be taken to restart the vCenter agent on an ESXi host?
a. In the ESXi Shell, enter restart vpxa.
b. In the ESXi Shell, enter /etc/init.d/vpxa restart.
c. In the ESXi Shell, enter restart hostd.
d. In the ESXi Shell, enter /etc/init.d/hostd restart.
Foundation Topics
Tune and Optimize vSphere Performance
This section describes how to tune ESXi host resources. It provides details for optimizing the configuration of ESXi host memory, network, CPU and storage resources. It provides examples and scenarios that involve the use of the vSphere Client and the vCLI.
Capacity Planning and Peak Workload
The first key to achieving solid performance in a vSphere environment is to ensure that sufficient resources are provided to meet the peak concurrent demand from the virtual machines (VMs) and the system overhead. In this case, peak demand refers to the combined workload of a set of VMs at the moment when the combined concurrent workload of the VMs reaches its highest value.
For example, consider a case where you assess a set of 50 physical Windows servers that you plan to virtualize. You could use an assessment tool like VMware Capacity Planner to collect resource usage data from the Windows servers at regular intervals for a duration that you expect to be sufficient to represent the behavior of the servers. In this example, assume that you selected the sampling interval to be 1 hour and the duration to be 30 days. After the collection period is finished, you should use the tool or a spreadsheet to sum the values of the memory usage counter for all the servers at each sampling interval. In other words, use the tool to provide a table or graph that shows the total memory used by all servers at each 1-hour interval taken during the 30-day period. Then determine what is the highest (peak) value of the total memory usage at any particular interval during the 30-day period. Consider this value to be the peak concurrent memory usage. In this example, assume that on the last Friday of the month, several application servers such as payroll, financial reports, and other monthly reporting run concurrently, and the peak concurrent memory usage of the 50 Windows servers is 100 GB. If you size a cluster of ESXi hosts to run these 50 Windows servers as virtual machines, then you should plan to provide at least 100 GB of physical memory to the VMs—if you want the VMs to perform as well as the original servers. You should include additional physical memory for virtualization overhead, future growth, and redundancy.
Tune ESXi Host Memory Configuration
Although ESXi 5.1 hosts require a minimum of 2 GB of physical RAM, each ESXi host should be configured with at least 8 GB of RAM to take full advantage of ESXi features and to allow sufficient space to run VMs. Ensure that each ESXi host has sufficient memory resources to meet the peak concurrent demand of its VMs and system services.
Usually, the performance of VMs can be significantly enhanced when hardware-assisted memory management unit (MMU) virtualization is used. Hardware-assisted MMU virtualization is a feature provided by CPUs and is implemented by Intel using extended page tables (EPTs) and by AMD with rapid virtualization indexing (RVI). Hardware-assisted MMU virtualization provides an additional level of page tables in the hardware that maps VM memory (what the guest operating system perceives to be physical memory) to actual host physical memory (commonly called machine memory). ESXi hosts that utilize hardware-assisted MMU virtualization do not need to maintain shadow page tables, thus reducing overhead memory consumption and improving the performance of workloads in VMs. VMware recommends that when available, set the system BIOS of the ESXi host to enable hardware-assisted MMU virtualization.
The performance benefit of hardware-assisted MMU virtualization can be negated if a VM’s workload causes a high frequency of misses in the hardware translation lookaside buffer (TLB) because the time required for the ESXi host to service a TLB miss is increased in the absence of shadow page tables. In most cases, the additional cost to accommodate TLB misses can be overcome by configuring the guest O/S in the VM and the ESXi host to utilize large pages, which is covered in the Modify Large Memory Page Settings section of this chapter.
Some systems that support non-uniform memory architecture (NUMA) provide a BIOS option to enable node interleaving. In most cases, VMware recommends disabling node interleaving, which effectively enables NUMA and enables ESXi to optimally place each page of each VM’s virtual memory.
The BIOS of some ESXi host systems that utilize ECC memory can contain an option to set the memory scrub rate. In these cases, set the memory scrub rate to match the manufacturer’s recommendations, which is typically the default setting.
Memory overhead is required for the VMkernel and host agents, such as hostd and vpxa. A new feature in ESXi 5.1 enables the use of a system swap file, which allows up to 1 GB of this memory overhead to be reclaimed when the host is under memory pressure. This feature is not enabled by default but can be enabled using an ESXCLI command. For example, to create and enable a system swap file on a data store named Local-01, the following command can be used:
esxcli sched swap system set –d true –n Local-1
Note
The system swap file is unrelated to the standard VM swap file (VSWP) file, which is used to enable the VM’s guest O/S to consume less physical memory than the configured memory.
Memory overhead is also required for each running virtual machine. The per-VM memory overhead supports the following VM components:
• VM executable (VMX) process, which is needed to bootstrap and support the guest O/S
• VM monitor (VMM), which contains data structures that are used by the virtual hardware, such as the TLB, memory mappings, and CPU state
• Virtual hardware devices, such as mouse, keyboard, SVGA, and USB
• Other subsystems, such as the kernel and management agents
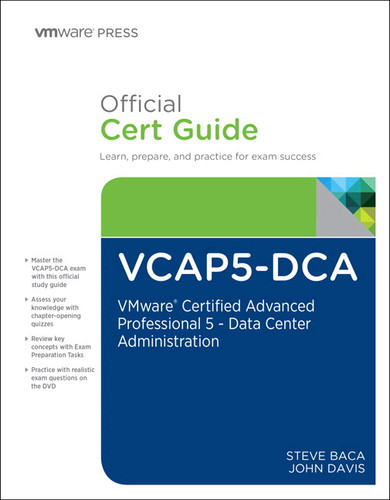
Although the memory requirements for the VMM and virtual devices are fully reserved at the moment the VM is started, the memory reserved for the VMX process can be reduced by the use of VMX swap file. The size of the VMX swap file is typically less than 100 MB. Its use typically reduces the VMX memory reservation from about 50 MB or more per VM to about 10 MB per VM. By default, the ESXi host automatically creates a VMX swap file for each VM in the VM’s working directory, but this can be controlled by setting a value for the sched.swap.vmxSwapDir parameter in the VMX file. The sched.swap.vmxSwapEnabled parameter can be set to FALSE in a VM’s VMX file to prevent it from using a VMX swap file. To set these parameters, click the Configuration Parameters button located on the Options tab of the VM’s Properties pages. In the Configuration Parameters dialog box, search the Name column for the name of the parameter. If it exists, then modify its value. Otherwise, use the Add Row button to create a row for the parameter. When adding a row, be sure to enter the parameter name and value carefully. For example, to modify a VM, such that its VMX swap file is stored in a datastore named Local-01, add a row to the Configuration Parameters, where the parameter name is sched.swap.vmxSwapDir and the value is /vmfs/volumes/Local-01/, as illustrated in Figure 4-1.
Figure 4-1. VMX swap file configuration parameter.
To verify success, power on the VM and use the vSphere Client to examine the VM’s files on the Local-01 datastore using the Datastore Browser, as illustrated in Figure 4-2.

Note
The VMX swap file is unrelated to the standard VM swap file (VSWP) file, which is used to enable the VM’s guest O/S to consume less physical memory than the configured memory.
Tune ESXi Host Networking Configuration
Although ESXi 5.1 hosts require a minimum of just one network interface card (NIC), each ESXi host should be configured with at least two NICs to provide redundancy. Ensure that the combined throughput of the NICs in each ESXi host is sufficient to meet the demand of the VMs that run on the ESXi host plus the demand from the VMkernel, such as management and vMotion activities. Many networking tasks, particularly those that happen entirely with an ESXi host (such as VM-to-VM communication on the same host), consume CPU resources. Ensure that sufficient CPU resources are available to process the peak concurrent levels of network for the VMs and VMkernel.
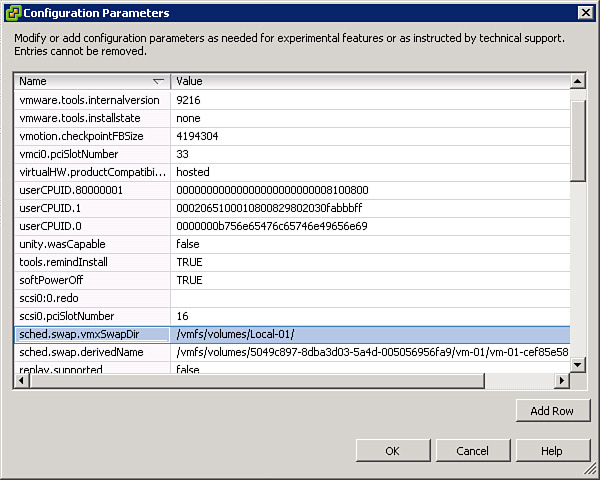
Each ESXi host should be configured with supported server-class NICs for best performance. Ensure that the network switches, switch ports, and other components of the network infrastructure are properly configured to support the capabilities of the NIC. For example, ensure that the speed and duplex are properly set on the switch ports and physical NICs. To set the speed and duplex on a physical adapter using the vSphere Client, navigate to the vSwitch, select Properties, select the Network Adapters tab, select the physical adapter (such as vmnic3); then click Edit, as illustrated in Figure 4-3.
Figure 4-3. NIC speed and duplex.
In some rare cases, Direct I/O might be desired to meet the high throughput demand of a virtual machine. In these cases, ensure that the BIOS settings of the ESXi host system are configured to enable the appropriate hardware-assisted virtualization support, such as Intel VT-d or AMD-Vi.
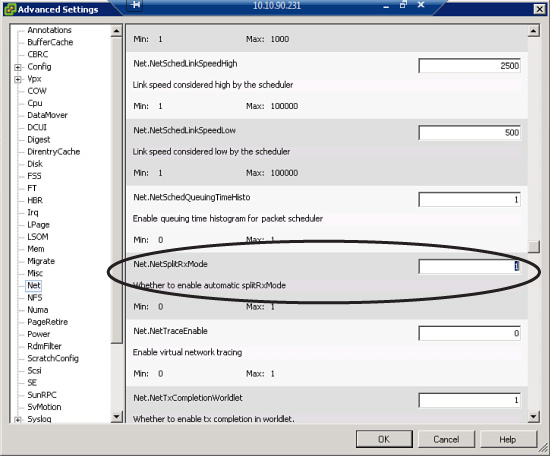
SplitRx mode is an ESXi feature that uses multiple physical CPUs to process network packets from a single network queue. This feature can improve the performance of specific workloads, such as multiple VMs receiving multicast traffic from a single source. By default, the feature is automatically enabled on VMXNET3 virtual network adapters whenever vSphere 5.1 detects that a single network queue on a physical NIC is heavily utilized and servicing at least eight virtual network adapters with evenly distributed loads. SplitRx mode can be enabled or disabled by adjusting the value of the NetSplitRxMode parameter. This setting can be viewed and modified by using the vSphere Client to navigate to the ESXi host’s Configuration tab > Advanced Settings > Net.NetSplitRxMode, as illustrated in Figure 4-4. The default value is 1, which means SplitRx mode is enabled. If the value is set to 0, then SplitRx mode is disabled.
Figure 4-4. SplitRx mode setting.
Tune ESXi Host CPU Configuration
ESXi 5.1 should be installed only on system hardware containing CPUs that are supported for ESXi 5.1and having at least two CPU cores. Ensure that each ESXi host has sufficient CPU resources to meet the peak concurrent demand of its VMs and system services. VMware recommends using modern CPUs that provide the latest features, such as hardware-assisted virtualization.
The performance of VMs can be significantly enhanced whenever hardware-assisted instruction set virtualization is used. Instruction set virtualization is a feature provided by CPUs that support Intel VT-x or AMD-V, where the hardware traps sensitive events and instructions eliminating the need for hypervisor to do so. VMware recommends that when available, set the system BIOS of the ESXi host to enable hardware-assisted instruction set virtualization. As mentioned in other sections, VMware also recommends enabling the hardware-assisted MMU virtualization features: Intel EPT and AMD RVI.

VMware also recommends making the following settings in the system BIOS when available:
• Enable all installed CPU sockets and cores.
• Enable Intel Turbo Boost, which allows the CPU to run at faster than its thermal design power (TDP) configuration specified frequency whenever the hypervisor requests the highest processor performance state and the CPU is operating below its power, current, and temperature limits.
• Enable hyperthreading, which allows each core to behave as two logical CPUs, permitting two independent threads to run concurrently on the core.
• Disable any devices that will not be utilized. For example, if the system includes a serial port that you plan to never use, disable it in the BIOS.
By default, ESXi automatically uses hyperthreading if it is available on the hardware and enabled in the BIOS. This behavior can be changed by using the vSphere Client:
1. Select the ESXi host and select the Configuration tab.
2. Navigate to Hardware > Processors > Properties.
3. In the dialog box, set the hyperthreading status to either enabled or disabled.
4. Click OK.
Tune ESXi Host Storage Configuration
If the ESXi host is configured to boot from local storage, ensure that a supported RAID controller is used and the selected RAID type includes redundancy, such as RAID-1. If the local storage is equipped with write-back cache, enable the cache and ensure it has a functional battery.
Ensure that only supported host bus storage adapters (HBAs) are installed and that each HBA is installed in slots with enough bandwidth to support their expected throughput. For example, a dual-port 16 Gbps Fiber Channel HBA should be installed in, at a minimum, a PCI Express (PCIe) G2 x8 slot, which can support up to 40 Gbps in each direction. Ensure that the maximum queue depth of the HBA is configured to meet manufacturer and VMware recommendations, which are unique depending on the combination of ESXi version and HBA model and version. Here are some useful examples of using ESXCLI commands to manage HBA queue depth:
• To view all currently loaded modules, use this command:
esxcli system module list
• To view all currently loaded Qlogic HBA modules, use this command:
esxcli system module list | grep qla
• To view all currently loaded Emulex HBA modules, use this command:
esxcli system module list | grep lpfc
• To view all currently loaded Brocade HBA modules, use this command:
esxcli system module list | grep bfa
To determine the current queue depth for an HBA, first use the vSphere Client to navigate to the Storage Adapters configuration page for the ESXi host and identify the device name of the HBA. Then use the esxtop command to determine the queue depth size. For example, to determine the queue depth for vmhba33, the following steps can be used:
1. In the ESXi Shell, enter esxtop.
2. Press the d key to display statistics for storage adapters.
3. Press the f key to display the available fields.
4. Press the d key to select the Queue_Stats field. Press the f and g keys to hide two other columns.
5. Examine the value for the AQLEN field for device vmhba33, as illustrated in Figure 4-5.
Figure 4-5. AQLEN field in ESXTOP.

The name of the parameter to set the queue depth on an HBA depends on the HBA module. To determine the available parameters for a particular HBA module, use the esxcli system module parameters list command. For example, to list the available parameters for the qla2xxx module, use this command:
esxcli system module parameters list -m qla2xxx
In this example, by examining the results you might determine that the appropriate parameter name is ql2xmaxqdepth. To set the maximum queue depth for the qla2xxx module, use this command:
esxcli system module parameters set -p ql2xmaxqdepth=64 -m qla2xxx
VMware recommends maintaining uniform configuration settings for all the HBAs used in an ESXi host cluster. You should ensure that any changes to a specific HBA’s queue depth in one ESXi host is also implemented to all identical HBAs throughout that host and all hosts in the cluster.
Configure and Apply Advanced ESXi Host Attributes
ESXi hosts provide many advanced attributes that could be configured in specific situations, such as the Mem.AllocGuestLargePage and the Net.NetSplitRxMode attributes described elsewhere in this chapter. To view the existing advanced attributes for an ESXi host using the vSphere Client, select the host and navigate to the Configuration tab > Software > Advanced Settings. To change the value of one of the advanced parameters, navigate to the parameter, enter its new value in the provided box, and click OK.
Configure and Apply Advanced Virtual Machine Attributes
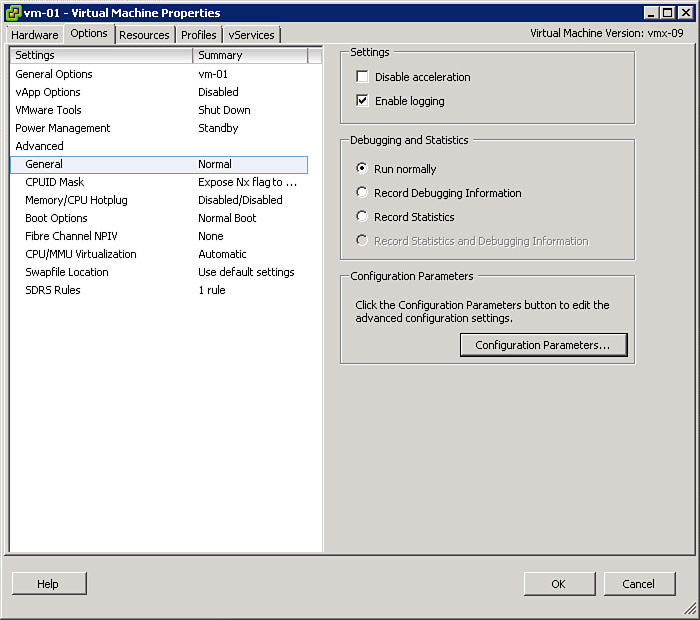
You can use the vSphere Client to modify many advanced options. For example, you can right-click a VM; select Edit Settings; select the Options tab; and use it to view and edit Advanced attributes, such as CPUID Mask, Memory/CPU Hotplug, and CPU/MMU Virtualization. For example, Figure 4-6 illustrates the Options tab for a VM named VM-04.
Figure 4-6. VM Properties Options tab.
Additionally, you can select Advanced > General on the Options tab and click the Configuration Parameters button, which opens a dialog box where these advanced configuration parameters can be viewed and edited. The dialog box contains a table with rows of configuration parameters, where the first column is the name of the parameter and the second column is the value of the parameter. Many advanced configuration parameters appear in the dialog box by default, but many more can be added by using the Add Row button. This requires the administrator to have prior knowledge of the exact parameter name and its acceptable values. The administrator should enter parameter names and values carefully. All parameters that are added and all values that are set using this dialog box are automatically added to the VM’s VMX file.
To fix this problem, add a configuration parameter named keyboard.typematicMinDelay and set its value to 2000000, which effectively configures the VM console to wait 2000000 microseconds (two seconds) for a key to be held before triggering auto-repeat. This can be accomplished by using the Add Row button in the Configuration Parameters dialog box, as shown in Figure 4-7.
Figure 4-7. Add the VM configuration parameter Keyboard Min Delay.

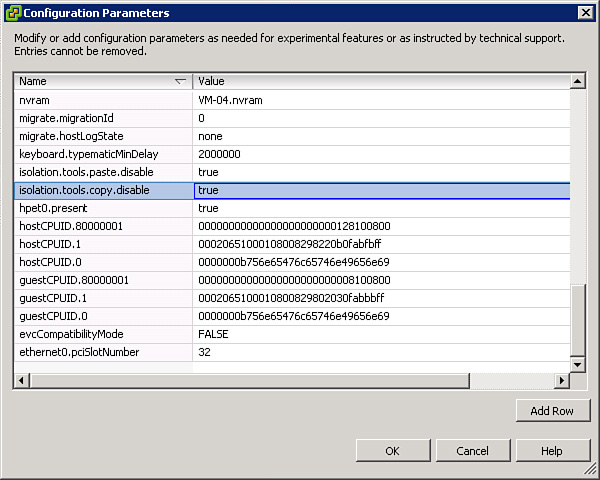
To fix this problem, add configuration parameters named isolation.tools.copy.disable and isolation.tools.paste.disable to the VM and set both parameters to true, as shown in Figure 4-8.
Figure 4-8. Additional VM configuration parameters.
To test this, use the Options tab of the VM’s Properties page to modify the CPU/MMU Virtualization attribute. Set its value to Use Intel VT/AMD-V for instruction set virtualization and software for MMU virtualization, as shown in Figure 4-9.
Figure 4-9. CPU/MMU virtualization attribute.

Configure Advanced Cluster Attributes
DRS clusters provide a means to set advanced options, much like ESXi hosts and VMs provide advanced setting and advanced configuration parameters. Many of the ESXi host and VM advanced attributes are covered in this chapter, but DRS cluster advanced attributes, such as PowerPerformanceRatio, HostMinUptimeSecs, PowerPerformanceHistorySecs, and MinPoweredOnCpuCapacity, are covered in Chapter 5, “Clusters.”
Optimize Virtual Machine Resources
This section describes how to size and tune VMs. It provides details on configuring VM hardware, calculating available resources, and configuring the swap file. It provides examples and scenarios involving the vSphere Client and the vCLI.
Tune Virtual Machine Memory Configurations
At a minimum, each VM should be configured with sufficient virtual memory to meet the O/S and application manufacturers’ recommendations for the VM. This includes meeting the manufacturers’ recommendations to accommodate the expected peak workload for the VM. In most cases, a VM should not be configured with a significantly higher amount of memory than it is expected to use. Although ESXi is designed to intelligently manage memory and is typically capable of reclaiming any excess memory assigned to VMs when the ESXi host is under memory pressure, the practice of continuously assigning excess memory to VMs tends to lead to issues. For example, if a specific VM is expected to need only 2 GB of memory but you choose to configure it with 4 GB memory, then a side effect is that the VM’s swap file is also 4 GB, which can waste disk space.
If a VM is not performing well due to memory contention rather than the size of its memory, you might want to increase its memory reservation to determine whether the performance improves. A sensible approach is to increase the reservation gradually to a point at which further increases do not make a noticeable performance improvement to the user.
To meet this requirement, you can examine the Installing VMware vCenter Server 5.1 Best Practices knowledgebase article (KB 2021202), which reveals that the minimum supported memory for running just vCenter Server 5.1 in a Windows VM is 4 GB and no additional memory is required in deployments with fewer than 50 ESXi hosts and fewer than 500 VMs. Based on this information, you might decide to configure the VM memory for 4 GB.
Tune Virtual Machine Networking Configurations
VMware recommends that you choose to use VMXNET3 virtual network adapters for all your VMs that run a supported guest O/S for VMXNET3 and have VMware Tools installed. The VMXNET3 virtual adapter is optimized, such that it provides higher throughput, lower latency, and less overhead than other virtual adapter choices. But, operating system vendors do not provide the driver for the VMXNET3 virtual adapter. The VMXNET driver is supplied by VMware Tools.
Tune Virtual Machine CPU Configurations
At a minimum, each VM should be configured with enough virtual CPU resources to meet the O/S and application manufacturers’ recommendations for the VM. This includes meeting the manufacturers’ recommendations to accommodate the expected peak workload for the VM. In most cases, a VM should not be configured with more virtual CPU cores than it is expected to need. Although ESXi is designed to intelligently schedule CPU activity and fairly grant CPU access to VMs using shares, when the ESXi host is under CPU pressure, the practice of continuously assigning excess virtual CPU cores to VMs tends to lead to issues. For example, consider a case where the CPUs in an ESXi host are currently being stressed and the contention is causing one of the VMs to perform poorly. It is possible that if you add more virtual CPU cores to the VM that its performance could actually worsen, due to the extra burden of scheduling more virtual CPUs.
If a VM is not performing well due to CPU contention rather than the number of virtual CPU cores, you might want to increase its CPU reservation to see if the performance improves. A sensible approach is to increase the reservation gradually to a point at which further increases do not make a noticeable performance improvement to the user.
To meet this requirement, you can examine the Installing VMware vCenter Server 5.1 Best Practices knowledgebase article (KB 2021202), which reveals that the minimum number of CPU cores supported for running just vCenter Server 5.1 in a Windows server is 2 and no additional CPU cores are required in deployments with less than 50 ESXi hosts and less than 500 VMs. Based on this information, you might decide to configure the VM with 2 virtual CPU cores.
Tune Virtual Machine Storage Configurations
When addressing VM performance, you might need to address and tune its storage configuration. In many cases the placement of the VM onto a particular datastore has a significant impact on its performance. Ensure the VM is not experiencing high I/O latency due to overworked LUNs. Ensure that the LUN on which the datastore resides is configured with appropriate disks, RAID type, and cache to meet the concurrent peak I/O requirements of all the virtual machines housed on the datastore. If I/O becomes constrained on the datastore, the issue might be resolved by using Storage vMotion to migrate one or more VMs to datastores that have fewer competing workloads or that are configured for better performance.
Another storage configuration option to consider is the virtual SCSI controller type. In most cases, the default virtual SCSI controller type, which is based on the guest O/S type, is adequate. If a VM’s disk throughput is not adequate, you could consider modifying its virtual SCSI controller type to VMware Paravirtual, as illustrated in Figure 4-10. This choice does require the installation of VMware Tools in the VM to provide the appropriate driver, and it requires a supported guest O/S.
Figure 4-10. Changing the SCSI controller type to VMware paravirtual.

You should ensure the file system used by the guest O/S is properly configured for proper track alignment. In a modern guest O/S, the default settings should properly align the tracks of the file system, but this should be verified—preferably before creating VM templates. The steps for proper track alignment are unique in each guest O/S type. For example, in Windows 2003, the diskpart command could be used to properly align the NTFS partitions.
When configuring a VM for maximum performance, configure the virtual disk type as thick provision eager-zeroed, which preallocates the disk space and pre-zeroes the bits in the virtual disk. This is the best performing virtual disk type because it does not have to obtain new physical disk blocks or write zeros to newly accessed blocks at runtime.
In rare cases, VMs could be configured to use raw device mappings (RDMs) to remove the VMFS layering.
Calculate Available Resources
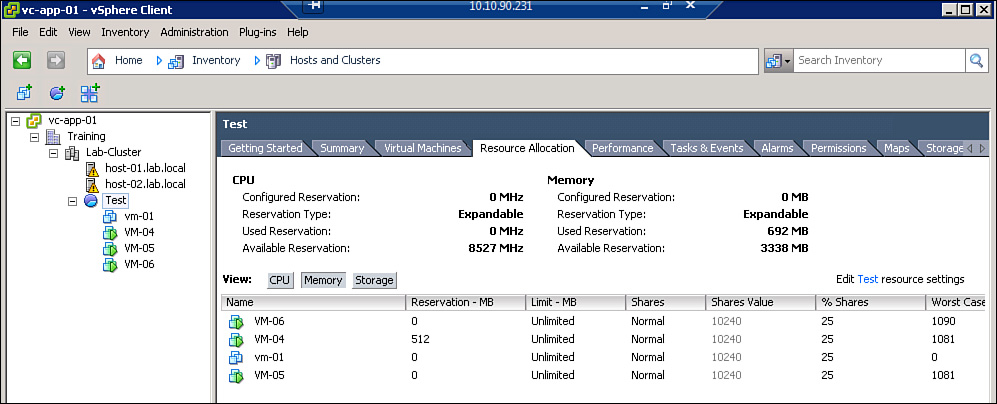
Prior to deploying new VMs or increasing the size of existing VMs, you should examine the target ESXi host, resource pool, and cluster for available resources. For an ESXi host, you could use the Overview graphs on the Performance tab to determine CPU and memory utilization. The CPU(%) graph could be used to determine how much CPU capacity is being utilized and how much CPU capacity is available. Likewise, the Memory(%) graph could be used to determine how much memory capacity is being utilized and how much memory capacity is available. These are good tools to use when making decisions based on actual unused resources. But, in many cases, the main concern is to guarantee that VMs and applications receive sufficient resources to ensure that certain performance levels are met. In these cases, the best tool to determine the available resources can be the Resource Allocation tab of the associated resource pool or cluster. The resource allocation tab provides the Total, Reserved, and Available Capacity for the entire cluster or resource pool. It also provides details on each VM, including the Reservation, Limit, and Shares for both CPU and Memory. The information on the Resource Allocation tab enables you to size VMs based on reservations rather than on actual usage. Figure 4-11 illustrates an example of the Resource Allocation tab for a resource pool named Test, where the memory reservation of one VM is 512 MB and the available memory reservation of the pool is 3338 MB.
Figure 4-11. Memory resource allocation for the test resource pool.
Properly Size a Virtual Machine Based on Application Workload
First, size each VM according to vendor recommendations for the guest O/S, application, and workload. As mentioned in previous sections, ensure that the virtual memory size and the number of virtual CPU cores in each VM is at least as large as any supported minimum requirements identified for the software application in the VM. Additionally, ensure that the VM’s memory and CPU are sized accordingly with any vendor recommendations based on the expected workload. For example, Microsoft might publish memory and CPU recommendations for exchange servers based on the number of mailboxes or concurrent users. Next, adjust the memory and CPU size of each VM based on measured usage. For example, if a VM consistently uses 80% or more of its available CPU resources, then you should consider adding more virtual CPU cores. Or if a VM’s guest O/S is swapping internally, you should consider adding more virtual memory. In either case, making these increases would be warranted only if the current utilization is causing the VM to perform badly. High utilization does not always correlate to poor performance.
As a general rule, don’t size the memory and CPU of many VMs much higher than necessary. Doing so can cause performance issues for those and other VMs. For example, configuring excess virtual CPUs for a VM makes the job of scheduling its virtual CPUs much more difficult for the VMkernel. If a VM already suffered from poor performance due to CPU contention for available ESXi host resources, increasing its number of virtual CPU can make it run more slowly. If most VMs are configured with twice as many virtual CPU cores as needed, it might reduce the number of VMs that you could place on the ESXi host before performance is noticeably degraded. If Windows 2008 VMs are configured with more memory than needed, the memory consumption on the ESXi host might be extremely high because the VMs might be using large pages, which cannot be shared by the VMkernel. This can cause the ESXi host to enter soft and hard memory states with fewer VMs running on the hosts than necessary, which in turn triggers ballooning, swapping, and compression.
To meet this requirement, you can examine the Installing VMware vCenter Server 5.1 Best Practices knowledgebase article (KB 2021202), which reveals that the minimum supported memory for running just vCenter Server 5.1 in a Windows Server is 4 GB and the minimum number of cores is 2. But, it also reveals that VMware recommends configuring at least 8 GB memory and 4 CPU cores if the deployment includes between 50 and 300 ESXi hosts and between 500 and 3,000 VMs. Given this information, you might choose to configure the VM with 8 GB virtual memory and 4 virtual CPU cores.
Modify Large Memory Page Settings
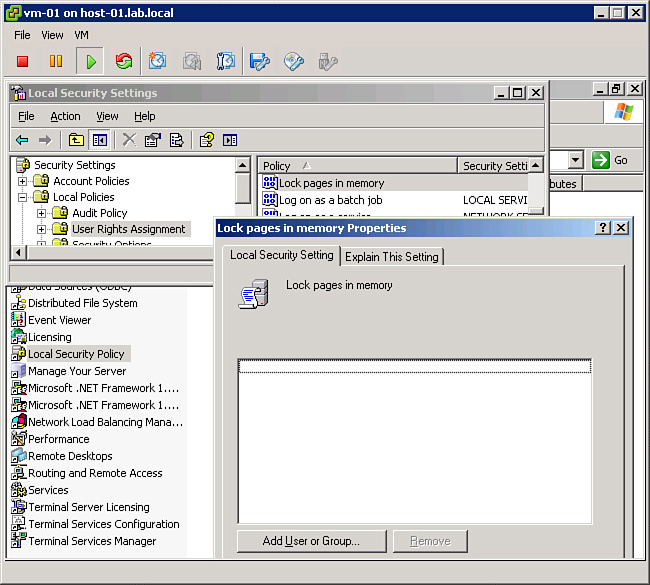
Many modern guest operating systems are configured to use large memory pages by default. Likewise, ESXi is configured to support and deliver large memory pages by default. In other words, in many cases today, no additional effort is needed to enable ESXi hosts to successfully deliver large memory pages for guest O/S use. However, some guest operating systems might be unable to utilize large memory pages or might require some configuration to use large memory pages. For example, in Windows Server 2003, the system administrator must grant a privilege called “lock pages in memory” to user accounts that run applications where the use of large memory pages would be beneficial. To accomplish this, the following steps can be performed:
1. Log on to Windows using the Administrator account.
2. Select Start > Control Panel > Administrator Tools > Local Security Policy.
3. In the left pane, expand Local Policies and select User Rights Assignment.
4. In the right pane, right-click Lock pages in memory and select Properties.
5. In the Local Security Setting dialog box, click Add User or Group.
6. Enter the appropriate username, and click OK.
7. On the Ready to Complete page, click Finish.
The interfaces used in this procedure are illustrated in Figure 4-12.
Figure 4-12. Configuring a Windows Server 2003 user to support large memory pages.
Large memory page support is enabled in ESXi 5.x by default. The advanced setting named Mem.AllocGuestLargePage can be used to view and modify support for large memory pages per ESXi host. Likewise, the setting monitor_control.disable_mmu_largepages can be set in a VM’s configuration file to control its capability to use large pages. One use case for modifying this setting involves its impact on transparent page sharing.
To accomplish this task, the administrator can perform the following steps:
1. Using the vSphere Client, navigate to Inventory > Hosts and Clusters and select the ESXi host.
2. Click the Configuration tab.
3. Select Software > Advanced Settings.
4. In the Advanced Settings dialog box, select Mem.
5. In the right pane, set Mem.AllocGuestLargePage to 0.
6. Click OK.
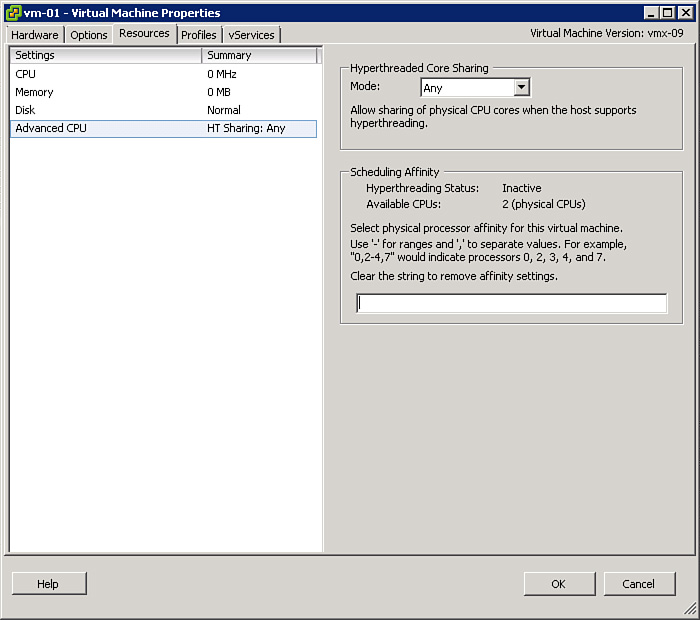
Understand Appropriate Use Cases for CPU Affinity
By default, the VMkernel is permitted to schedule the VM’s virtual CPU cores to run on any of the logical CPUs provided by the ESXi host hardware. You can modify this behavior and force the ESXi host to restrict the logical CPUs that can be used for running a VM. Using the vSphere Client, you can select Edit Settings to modify the settings of a VM and use the Resources tab to modify the Advanced CPU settings of a VM. You can use the Advanced CPU settings to configure Scheduling Affinity for the VM’s virtual CPUs. In the provided text box, you can specify the logical CPUs that are permitted for use by the VM by listing individual logical CPU numbers and ranges of logical CPU numbers. For example, on an ESXi host with 16 logical CPUs, numbered from 0 to 15, a valid setting for Scheduling Affinity is “1,3,5,7-10”. Figure 4-13 is an example of a VM’s Advanced CPU settings page.
Figure 4-13. The CPU scheduling affinity setting page.
VMware recommends that you use CPU scheduling affinity only in very rare cases. One primary reason is that vMotion is not functional with VMs configured with CPU scheduling affinity. If a VM resides in a DRS cluster, enabling CPU scheduling affinity is disabled. One valid use case for using CPU scheduling affinity is for troubleshooting purposes. If you are troubleshooting the performance of a CPU intensive VM, you might wonder if its performance would improve if you migrated it to CPU hardware that is not used by other VMs. If you do not have the flexibility of temporarily running just one VM on an ESXi host, the next best choice might be to use CPU scheduling affinity to configure the VM to use specific logical CPUs and to configure all other VMs to use the remaining logical CPUs.
CPU scheduling affinity is also a useful tool for testing and capacity planning purposes. For example, you might be interested in measuring a VM’s throughput and response time when it is pinned along with a set of competing VMs to a specific set of logical CPUs.
Configure Alternative Virtual Machine Swap Locations
The location of the VM’s swap file can be set at the VM level, ESXi host level, and cluster level. You can use the Options tab > Advanced > General > Configurations Parameters in the VM’s properties to add a row for the sched.swap.dir parameter. Set its value to the full path to relocate the VM’s swap file. This setting will not take effect until the VM is power cycled.
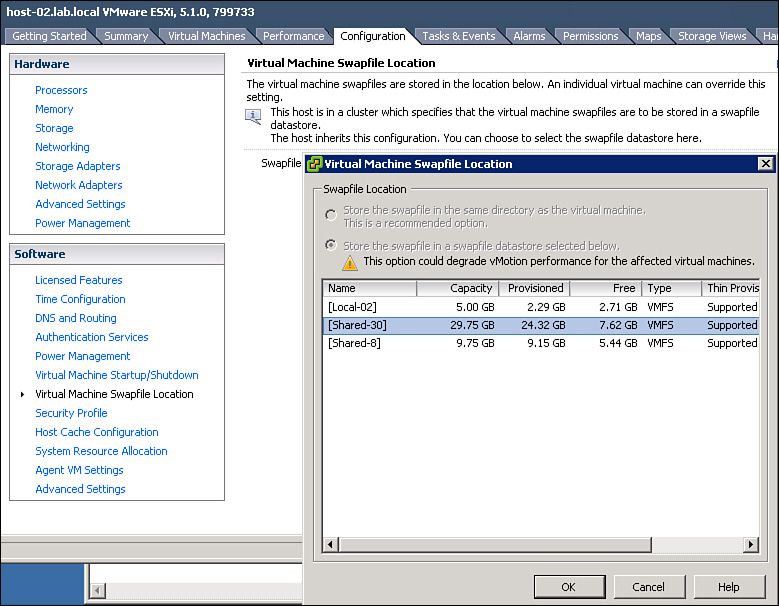
Alternatively, you can change the VM swap file location for an entire cluster. The first step is to edit the settings of the cluster and set the Swap File Location to Store the swap file in the datastore specified by the host. The next step is to use the Configuration tab for the ESXi host to select Software > Virtual Machine Swapfile Location and click Edit. In the Virtual Machine Swapfile Location dialog box, select the datastore to use to store the swap file for all VMs on the host and click OK, as illustrated in Figure 4-14.
Figure 4-14. VM swap file location setting.
Note
The standard VM swap file (VSWP) file is unrelated to the VMX swap file, which is used to reduce the memory requirement for the VM’s VMX process when the ESXi host experiences memory pressure.
Utilize Advanced vSphere Performance Monitoring Tools
This section describes how to collect and analyze performance data for VMs and ESXi hosts using advanced methods. It provides details on using advanced features available in ESXTOP and RESXTOP and on utilizing the vscsiStats utility. It also provides examples and scenarios of using these utilities in specific use cases.
Configure ESXTOP/RESXTOP Custom Profiles
As described in Chapter 1, “Administrator Tools,” in this guide, ESXTOP is a tool that can be used in the ESXi Shell to interactively display resource usage statistics per world. RESXTOP is a nearly identical command that is designed for remote use from the vCLI. For simplicity, the remainder of this section will refer to the ESXTOP utility, but the details in this section can actually be applied to both ESXTOP and RESXTOP. ESXTOP enables the user to interactively select the resource type to be monitored. For example, the user can press the n key to display network statistics. It enables the user to select the fields to include in the display. For example, when monitoring CPU statistics, the user can press the f key and then use the h key to toggle the display of the CPU Summary Stats fields. After selecting the resource type and selecting fields, the user might want to save these selections to facilitate making identical selections in the future. ESXTOP allows the use of custom profiles to save such changes. When launching ESXTOP, any available custom profiles can be specified to customize the output.
To create a custom profile, first use ESXTOP interactively to make all the desired selections for resource type and fields. Then save the selections in a custom profile by pressing the W key and entering the name of the file to store the profile. After creating the custom profile, to use it with ESXTOP, provide the –c switch followed by the filename of the profile when entering the esxtop command.
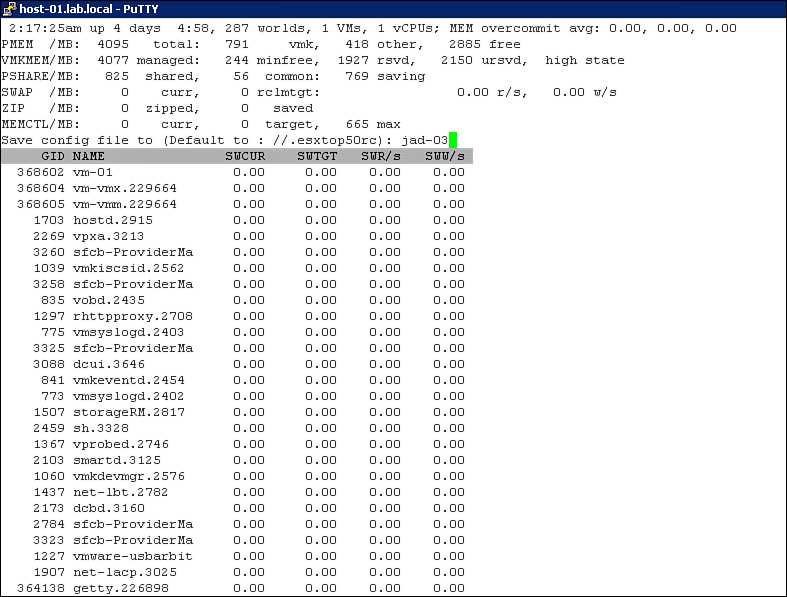
For example, to create a custom profile named jad-03 that can be used to display just memory swap statistics, the following steps can be used. In this example, the host name is host-01.lab.local:
1. In the ESXi Shell, enter esxtop.
2. Press the m key to display memory statistics.
3. Press the f key to display the available memory fields.
4. Press the k key to select the SWAP STATS fields. Press the h key, the l key, and the o key to deselect some other statistics.
5. Press the V key to display only the VM worlds.
6. Press the W key to save the settings in a custom profile.
7. When prompted, enter jad-03, as illustrated in Figure 4-15. The file is saved in the present working directory because jad-03 is not a fully qualified name. Alternatively, a fully qualified name could have been used.
Figure 4-15. Saving a custom profile in ESXTOP.
8. Press the q key to quit RESXTOP.
9. Enter this esxtop -c jad-03 to open ESXTOP with the custom profile, which must be in the present working directory because it is not a fully qualified name.
10. Verify that ESXTOP opens to the memory statistics and that only the swap statistics fields are displayed. Notice that the selection to display only VMs was not saved as part of the custom profile.
You can maintain multiple custom profiles for use with ESXTOP. You can also modify the default ESXTOP profile, which enables you to control the data that is displayed by ESXTOP when it is opened without specifying a custom profile. To modify the default profile for ESXTOP, enter esxtop to open ESXTOP without using a custom profile, make the desired selections, and then use the W key to save selections without entering a filename. This allows the settings to be saved in the default profile, which is stored at /.esxtop50rc (The default profile for RESXTOP is /home/vi-admin/.esxtop50rc.)
ESXTOP Interactive, Batch, and Replay Modes
ESXTOP and RESXTOP are not typically required for daily activities by most vSphere administrators. Instead, administrators typically use the performance graphs in the vSphere Client and the vSphere Web Client to examine resource usage and to troubleshoot performance issues. The main use case for utilizing ESXTOP and RESXTOP is when the administrator needs more granular information than the data provided by the performance graphs. For example, if data samples need to be taken at a higher frequency than every 20 seconds, RESXTOP is a better choice than performance graphs.
The interactive mode provided by ESXTOP and RESXTOP is useful in situations where the current workload is rather steady and the administrator has ample time to examine all the necessary data. These utilities offer a batch mode, where they can be used to collect data and save it in a comma-delimited file to be examined later using third-party tools, such as Windows Performance Monitor. Batch mode is useful in situations where you want to use other tools to examine and display performance data that was collected by these utilities. ESXTOP—not RESXTOP—also offers a replay mode that allows ESXTOP to input data that was collected using the vm-support command. Replay mode enables ESXTOP to display data as if it was coming from a live ESXi host; instead, it is actually coming from data previously collected by vm-support. Batch and replay modes are useful in situations where the workload that needs examination might exist only for a short time. They enable the data to be collected in the present time to be examined at a future time. Batch and replay modes are also useful in scenarios when data needs to be collected for a long period of time.
For example, if you want to collect data at two-second intervals for a duration of two minutes and have the ability to use ESXTOP to analyze the collected data in replay mode, you could enter the following commands from the ESXi Shell. In this example, a preexisting folder named tmp that it located on a datastore named Shared-30 is used to store the data files produced during the collection:
1. Change the folder to the temp folder by entering:
cd /vmfs/volumes/Shared-30/tmp
2. Generate the batch collection by entering:
vm-support -p -d 120 -i 2 -w /vmfs/volumes/Shared-30/tmp
3. Locate the output file using the ls command.
4. Extract the file by entering:
tar -xzf esx-host-01.lab.local-2014-01-14--13.18.tgz
5. Locate the appropriate folder using the ls command.
6. Change the folder to the appropriate location using:
cd esx-host-01.lab.local-2014-01-14--13.18/
7. Execute the reconstruct script using:
./reconstruct.sh
8. Change to the parent folder and replay the batch collection using:
esxtop -R esx-host-01.lab.local-2014-01-14--13.18
Figure 4-16 contains a screenshot illustrating these commands.
Figure 4-16. ESXTOP replay mode.

In this example, the –p parameter is used with the vm-support command to instruct it to collect performance data. The –d parameter is used to set the duration to 120 seconds, and the –i parameter is used to set the interval to 2 seconds. The –w parameter is used to set the target directory for the output file. In Figure 4-16, after the vm-support command completes, a message appears that identifies the output TGZ file. This filename is then used in the tar command that extracts the contents of the TGZ file, using the –xzf parameters. The ls commands are used to illustrate the files and folders that exist in the tmp folder prior to and after the execution of the tar command. After the tar command execution completes, the cd esx-host-01.lab.local-2014-01-14--13.18/ is used to change the default directory into the directory produced by the tar command. Next, the files used for replay are prepared by executing the reconstruct.sh script. Finally, esxtop –R is used to open ESXTOP in replay mode using the prepared data, which is identified by using the directory name.
Chapter 1 of this guide contains an example of using ESXTOP in batch mode to collect data and display it using the Windows Performance Monitor.
To address these needs, you could collect data using vm-support and examine the data using ESXTOP replay mode. You could decide to use a VMFS datastore named VMFS-01 to hold the data prepared by vm-support. Promptly at 2 a.m., you could use vm-support to collect data for 60 minutes at 10-second intervals, using this command.
vm-support -p -d 3600 -i 10 –w /vmfs/volumes/VMFS-01
After the collection is finished, you can use the steps provided in the previous example to finish preparing the data using the tar command and reconstruct.sh script. After the data is prepared, use the ESXTOP replay mode to examine the data with the esxtop –R command and the name of the folder where the prepared data resides.
Use vscsiStats to Gather Storage Performance Data
The vscsiStats utility, which is available in the ESXi Shell, can be used to troubleshoot VM storage performance-related issues. It can be used to collect data at the virtual SCSI device level in the VMkernel and report the data using histograms. It collects data on each I/O operation and reports on I/O metrics such as length, seek distance, number of outstanding I/Os, I/O latency, and inter-arrival time. So, it covers more storage statistics than ESXTOP, which covers only latency and throughput statistics. Because it works at the virtual SCSI device level, it can be used to analyze the storage activity of virtual disks regardless of storage type. For example, it can be utilized to analyze latency for NFS traffic.
This data can be useful for characterizing the associated workload. For example, if vscsiStats reports that seek distance for a large majority of the IOs during a specific sampling period is very small, the workload can be sequential. This information can be useful in determining the best choice for the RAID type that services the workload.
The first step for using vscsiStats is to determine the world ID and handle IDs associated with the VM you intend to monitor. You can use the vcsciStats –l command to list information on all currently running VMs and their virtual disks, including the worldGroupID of each VM and the handleID of each virtual disk. The second step is to start the data collection for a specific single virtual disk or for all virtual disks associated with a specific VM. To start the data collection for all virtual disks used by a specific VM whose worldGroupID is 1000, use this command:
vscsiStats -s -w 1000
To start the data collection for a specific virtual disk whose handleID is 2000 that is used by a specific VM whose worldGroupID is 1000, enter this command:
vscsiStats -s -w 1000 –i 2000
The data collection runs in the background. While the data collection is running, you can use vscsiStats -p option to print a histogram for a specific statistic. The choices for statistics are iolength, seekDistance, outstandingIOs, latency, and interarrival. For example, this command be used to print a histogram for the latency statistic:
vscsiStats –p latency
Figure 4-17 shows the results of a sample execution of this command. In this example, for the first disk, no I/Os completed in 100 microseconds or less; no I/Os took longer than 15,000 microseconds; and 55 I/Os experienced latency between 100 and 500 microseconds.
Figure 4-17. Latency histogram by vscsiStats.

By default, the data collection will run for 30 minutes, but you can stop it by entering the following command:
vscsiStats -x
Troubleshoot CPU and Memory Performance
This section describes how to troubleshoot CPU- and memory-related issues that affect ESXi host and VM performance. It provides details on performance metrics that can be used to identify specific performance issues. It includes examples that involve the use of the vSphere Client and the vCLI.
Troubleshoot CPU Performance Issues
You can use the vSphere Client, as well as other tools like ESXTOP and RESXTOP, to troubleshoot CPU performance issues that impact ESXi hosts and VMs. The vSphere Client provides two types of performance graphs for ESXi hosts and VMs, overview and advanced. The advanced graphs, which provide the most granular data, are typically more useful for CPU troubleshooting than the overview graphs. The steps for using the vSphere Client advanced graphs to analyze CPU performance issues are as follows:
1. In the inventory pane, select either the ESXi host or VM.
2. Select the Performance tab.
3. Select Advanced.
4. Click Chart Options.
5. In the Customize Performance Chart dialog box, in the Chart Options section, expand CPU and select the desired option, such as Real Time.
6. In the Objects section, select the CPU objects to include in the graph. For example, for VMs, you can select an object that matches the name of the VM, which represents all CPU activity in the VM. You can also select individual virtual CPUs used by the VM, such as virtual CPU 0.
7. In the Counters section, select the CPU metrics to include in the graph, such as Usage and Ready.
8. Click OK.
Figure 4-18 illustrates an example of customizing a performance chart for a VM named vm-01 that is configured with a single virtual CPU.
Figure 4-18. Custom VM CPU chart options.

The vSphere Clients offer many CPU-related counters for use with advanced performance graphs. Certain counters are more useful than others for troubleshooting specific CPU-related issues. For example, for a poorly performing VM, high CPU Ready Time indicates that CPU contention exists, where the VM is contesting with other VMs for scheduled CPU time. Table 4-2 contains a set of potential CPU-related performance issues. For each potential issue, the table includes an “Indicators” column that contains details on using specific CPU counters in real-time graphs to identify the issue. Also, for each potential issue, the table includes a column that lists some potential resolutions.
Table 4-2. Potential CPU Issues and Resolutions

Note
Table 4.2 does not contain all the potential resolutions, just a few examples. Other potential resolutions exist. Likewise, it does not contain all the indicators, just a few of the strongest indicators.
Troubleshoot Memory Performance Issues
You can use the vSphere Client, as well as other tools like ESXTOP and RESXTOP, to troubleshoot memory performance issues that impact ESXi hosts and VMs. The vSphere Client provides two types of performance graphs for ESXi hosts and VMs, overview and advanced. The advanced graphs, which provide the most granular data, are typically more useful for memory troubleshooting than the overview graphs. The steps for using the vSphere Client advanced graphs to analyze memory performance issues are shown here:
1. In the Inventory pane, select either the ESXi host or VM.
2. Select the Performance tab.
3. Select Advanced.
4. Click Chart Options.
5. In the Customize Performance Chart dialog box, in the Chart Options section, expand Memory and select the desired option, such as Real Time.
6. In the Objects section, select the memory objects to include in the graph. For example, for VMs, you can select an object that matches the name of the VM, which represents all memory usage of the VM.
7. In the Counters section, select the memory metrics to include in the graph, such as Balloon and Active.
8. Click OK.
Figure 4-19 illustrates an example of customizing a performance chart for a VM named vm-01 that is configured with 1 GB virtual memory.
Figure 4-19. Custom VM memory chart options.

A number of memory-related counters are available for use with advanced performance graphs. Certain counters are more useful than others for troubleshooting specific memory-related issues. For example, for a poorly performing VM, a high Swap in rate indicates that memory contention exists, where the VM is competing with other VMs for access to physical memory. Table 4-3 contains a set of potential memory-related performance issues. For each potential issue, the table includes an “Indicators” column that contains details on using specific Memory counters in real-time graphs to identify the issue. Also, for each potential issue, the table includes a column that lists some potential resolutions.
Table 4-3. Potential Memory Issues and Resolutions
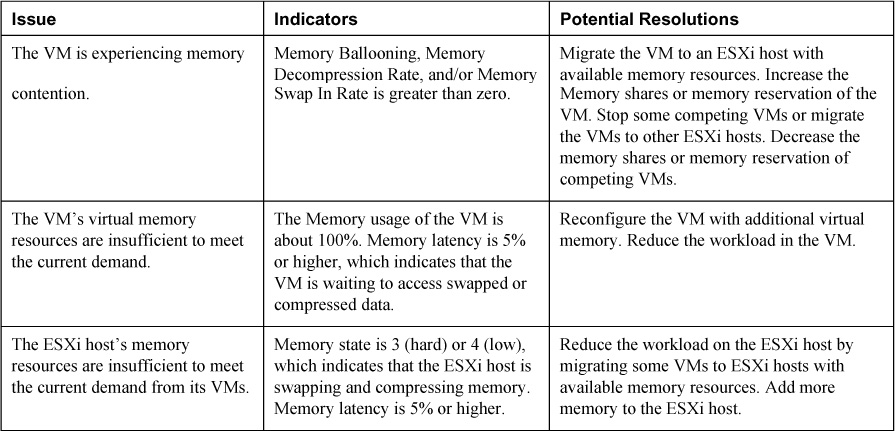
Other indicators that a VM’s virtual memory resources are insufficient to meet the demand from its current workload can be found within the guest O/S. For example, the Performance Monitor on a Windows VM could be used to examine the Pages per sec counter, which indicates that Windows is actively swapping data in from its page file.
Use Hot-Add Functionality to Address CPU and Memory Performance Issues
As indicated in the previous sections, CPU and memory can be added to VMs to resolve certain performance issues. In many cases, CPU and memory can be added to running VMs without user interruption, by making use of the vSphere feature to hot-add CPU and memory to a VM. Naturally, the guest O/S in the VM must be capable of accepting memory increases or CPU additions while the guest O/S is running. An ESXi host will allow the configured memory of the VM to be increased if the guest O/S supports the increase and the VM is configured to permit memory hot-add. Likewise, an ESXi host will allow virtual CPUs to be added to a VM if the guest O/S supports the increase and the VM is configured to permit CPU hot-add. To configure memory and CPU hot-add for a VM, use the vSphere Client and follow these steps:
1. Ensure the VM is powered down.
2. Right-click the VM and select Edit Settings.
3. Select the Options tab.
4. Click Memory/CPU Hotplug.
5. Check the Enable memory hot add for this virtual machine option. Then check either Enable CPU hot add only for this virtual machine or Enable CPU hot add and remove for this virtual machine.
6. Click OK.
After successful completion of these steps, the VM will be able to increase its memory and/or add virtual CPUs while the VM is running. Figure 4-20 illustrates an example of what the Options tab shows for a VM whose guest operating system (in this case Windows 2003 Standard 32-bit) does not support CPU hot-add.
Figure 4-20. Hot-add CPU and RAM.

Note
The setting to enable hot-add of CPU and memory is disabled by default for each VM. This setting can be enabled only while the VM is powered off. So, if you want to use this feature for a VM, be sure to enable the hot-add feature shortly after creating the VM.
Troubleshoot Network Performance and Connectivity
This section describes how to use commands and other tools to troubleshoot network performance and connectivity issues. It provides details on troubleshooting distributed virtual switches, private VLANs, and DNS issues. It provides details for using the net-dvs utility, the Direct Console User Interface (DCUI), and port mirroring for troubleshooting. It provides examples and scenarios of where each of these tools can be applied.
Use net-dvs to Troubleshoot vSphere Distributed Switch Configurations
The net-dvs command can be used from the ESXi Shell or the vCLI to display information about a distributed vSwitch (dvSwitch) configuration for an ESXi host. As explained in Chapter 2, “Network Administration,” the configuration of dvSwitches is managed by vCenter Server, but each ESXi host that connects to a dvSwitch receives details about the configuration and stores this data in a local file named /etc/vmware/dvsdata.db. The ESXi host ensures the data in the dvsdata.db file is kept current by updating its contents at five-minute intervals. When executed, the net-dvs command examines this file and displays configuration details for the dvSwitch, distributed port groups, and ports. It also displays details on port statistics, much like the vSphere Client does on the Ports tab for a dvSwitch or distributed port group.
One use case for net-dvs is when networking troubleshooting is necessary but the vCenter Server is unavailable or unreachable. If the vCenter Server is not available and you need to examine the configuration of a dvSwitch, you could use the net-dvs command. To do so, you could simply enter net-dvs from the ESXi Shell, but the amount of information returned by the command is typically too much to easily process. You might prefer to enter net-dvs | less, which enables you to scroll forward and backward through the results. Or, you might prefer to output the results to a file and then use traditional commands like grep, less, more, cat, or vi to view the file. For example, to export the results of net-dvs to a file named net-dvs-results, use this command:
net-dvs >> net-dvs-results
To use the vi text editor to view the net-dvs-results file, use this command:
vi net-dvs-results
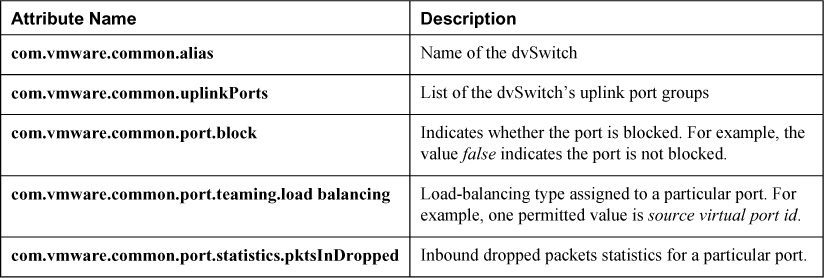
Typically, the first line of this file begins with the string switch, which indicates the first row in a section that provides details on a specific dvSwitch. The following lines contain details about the configuration of the dvSwitch, such as max ports and global properties. To quickly find the first line for next dvSwitch section, press the / key and enter switch at the prompt (including a space character at the end). To navigate through each dvSwitch section, use the arrow keys on the keyboard. Each section contains many attribute names and corresponding values. Table 4-4 provides information for a few of the attributes, including a brief description.
Table 4-4. Attributes in net-dvs Results
After using vi to view the file, you can close the file without changes. To do so, type the : key and enter q! at the prompt.
Use vSphere CLI Commands to Troubleshoot ESXi Network Configurations
Chapter 2 of this guide describes using the vCLI to configure and manage virtual networks. The information is also useful for troubleshooting ESXi network configurations. In many cases, the vCLI provides more than one command choice for performing certain network tasks, but the commands provided by the ESXCLI command set are typically preferred over other choices. The ESXCLI command set is available in the ESXi Shell as well as in the vCLI. During efforts to troubleshoot issues that affect the ESXi management network, access to the ESXi host from the vSphere Client, an SSH client, the vCLI, or the vMA might be unavailable. Troubleshooting ESXi network issues can require using ESXCLI commands from the ESXi Shell accessed directly from the ESXi host console. This section focuses on troubleshooting ESXi network issues using ESXCLI commands from the ESXi Shell, but it could be applied to using the vCLI, if available.
Chapters 1 and 2 of this guide provide details for using the ESXCLI command set, the ESXi Shell, and specific network-related commands. This section provides scenarios and sample solutions for troubleshooting specific ESXi network configuration issues.
To address this challenge, you could access the ESXi Shell directly from the console and enter the following commands. The first command displays information on all of the ESXi host’s vSwitches. The second command displays information on all the ESXi host’s VMkernel ports:
esxcli network vswitch standard list
esxcli network vswitch standard portgroup list
To address this need, you could access the ESXi Shell directly from the console and enter the following command:
esxcli network vswitch standard portgroup set -p 'Management Network' -v 100
To address this challenge, you could use CLI to enter the following command:
esxcli network nic list
Troubleshoot Private VLANs
Configuring private VLANs (PVLANs) is covered in the Chapter 2 of this guide. Troubleshooting PVLAN issues mostly involves testing communication between virtual adapters that use the PVLANs and examining the configuration of the associated distributed port groups and associated physical switch ports. For VMs in a community secondary PVLAN, troubleshooting might involve using ping commands in the VMs to ensure they can communicate with each other, can communicate with VMs in promiscuous PVLANs, and cannot communicate with VMs any other PVLANs. For VMs in an isolated secondary PVLAN, troubleshooting can involve using ping commands in the VMs to ensure they can communicate with VMs in promiscuous PVLANs but cannot communicate with each other or with VMs in any other PVLANs. For VMs in a promiscuous secondary PVLAN, troubleshooting might involve using ping commands in the VMs to ensure they can communicate with each other and with VMs in all the PVLANs.
For example, consider a case in which the virtual network design calls for the use of three secondary PVLANs identified as 70-101, 70-102, and 7-103. 70-101 is a promiscuous secondary PVLAN, 70-102 is a community secondary PVLAN, and 70-103 is an isolated secondary PVLAN. During implementation testing, none of the associated distributed virtual port groups appear to work. You could begin troubleshooting by using the vSphere Client to examine the PVLAN settings of the dvSwitch and ensure that each of the three PVLANs is properly numbered and properly configured with the appropriate PVLAN type as in the design. You could then examine the configuration of each of the associated distributed port groups and ensure that each is assigned the appropriate PVLAN settings as stated in the design. You could also examine the configuration of the physical switch and ports where the dvSwitch uplinks connect and ensure that the switch and ports are also properly configured for these PVLANs.
As another example, consider the same network design used in the previous example. In this case, assume that multiple ESXi hosts and multiple VMs are successfully using all the PVLANs. But on one particular ESXi host, the VMs connected to the distributed port group assigned to the 70-102 PVLAN cannot successfully communicate with other VMs running on other ESXi hosts and connected to the same distributed port group. Because the VMs on the troubled ESXi host connect to the same distributed port group as VMs that are communicating successfully, you should be able to eliminate improper PVLAN type configuration as a potential root cause. In other words, if the wrong PVLAN type is assigned to the 70-102 PVLAN on the dvSwitch and the 70-102 PVLAN is assigned to a distributed port group, it would affect all VMs on all ESXi hosts that are connected to the distributed port group. A better fit for the root cause of the problem could be the configuration of the physical network ports, where the physical adapters from the troubled ESXi host are connected. If one of these ports is misconfigured, it could impact just the VMs on this specific ESXi host. Perhaps one of these ports is not properly configured to accept the 70-102 PVLAN.
Troubleshoot VMkernel-related Network Configuration Issues
Some examples of troubleshooting VMkernel configuration issues have already been provided in this chapter, but they focused on using the commands. This section covers other examples and provides a methodology.
Troubleshooting VMkernel-related network issues could begin with steps aimed at narrowing the scope of potential root causes, such as testing connectivity and examining settings. The tests typically involve using the vmkping command to test connectivity from a VMkernel port to another network end point. The settings to examine include those on the VMkernel virtual adapter, virtual port groups, vSwitches, and physical network infrastructure. Other troubleshooting steps, such as examining log files, can also be used. Here is a high-level methodology that could be applied for identifying the root cause of a networking issue that involves a VMkernel port on an ESXi host:
1. Use vmkping to test connectivity from a VMkernel port to other VMkernel ports on the same network and to other known working addresses on the network. Determine whether communication is successful with some end points and not successful with other end points.
2. Determine whether connectivity is successful with VMkernel ports and VMs connected to the same distributed virtual port group, which might require temporarily attaching VMs for test purposes. Determine whether communication is successful with virtual adapters on the same ESXi host, but not with virtual adapters on other ESXi hosts.
3. If the issue seems to be isolated to just one VMkernel port, examine its IP address, mask, gateway settings, and other direct settings.
4. If the problem appears to be isolated to a specific ESXi host, examine the corresponding virtual port group, vSwitch, and uplink settings. For example, ensure that the appropriate physical adapters are configured as Active uplinks.
5. If the problem appears to be isolated to a specific virtual port group (standard or distributed), examine its settings, such as VLAN and Load Balancing policies.
To address this need, you could begin by accessing the ESXi Shell on the source ESXi host and enter the following command to see whether the target VMkernel port responds:
vmkping –I vmk1 192.168.2.11
This scenario could be caused by duplicate IPs on the vMotion VMkernel ports on host-01 and host-02. When troubleshooting VMkernel network connectivity issues where tests fail and succeed intermittently, consider whether duplicate IP addresses could be the root cause. This could be determined by first temporarily disconnecting, disabling, or deleting one the associated VMkernel ports and then pinging its address to see whether some other network node responds to the ping. Another approach is to examine the events and logs of the ESXi hosts to search for messages indicating duplicate IP addresses.
Troubleshoot DNS- and Routing-related Issues
Many DNS-related issues can be identified by performing tests that involve IP addresses instead of hostnames. For example, if you suspect that the DNS settings on an ESXi host are incorrect or that their DNS servers are not successfully resolving some names, you could begin by using vmkping tests from the ESXi Shell on the host. First, use vmkping to test connectivity to known servers on the management network and networks that are reachable from the management network. For these tests, use the hostnames of the target servers and ensure the target servers can be pinged from other sources. If these tests fail, repeat the tests, but this time use the IP address of each target server. If the second test succeeds but the first test fails, then the problem might be DNS related. You can also use the nslookup command to determine whether specific hostnames are properly being resolved to the correct IP addresses. Figure 4-21 illustrates an example from the ESXi Shell, where nslookup is used to test the resolution for a hostname vma-01. In this example, the hostname is resolved to IP address 192.168.1.12 by the DNS server at IP address 192.168.1.1.
Figure 4-21. Nslookup example.

To determine the root cause of routing issues, first examine the mask and gateway settings of the VM or VMkernel port. Then use the traceroute command in the ESXi Shell (or similar command in a VM, such as tracert in a Windows VM) to examine the network route that is being traversed. The traceroute command provides the –s parameter, which can be used to identify the source IP address. Figure 4-22 illustrates an example in which traceroute displays details for successfully reaching a server named vma-01 from a VMkernel management network interface, whose IP address is 192.168.1.10.
Figure 4-22. Traceroute example.

Use ESXTOP/RESXTOP to Identify Network Performance Problems
To use ESXTOP or RESXTOP to analyze network performance-related issues, press n to display network statistics. If VM or VMkernel virtual adapters are experiencing poor performance, the problem could be related to network contention, where the physical uplinks are struggling to process the outbound traffic from a set of VMs. Use the USED-BY column to locate the row in the display that corresponds to the troubled virtual adapter (VMkernel virtual adapter or VM virtual adapter) and determine whether the %DRPTX is higher than zero, which indicates that outbound network contention is present. The problem could be related to a lack of CPU resources, which prevents efficient processing of inbound network packets. Determine whether %DRPRX is higher than zero, which indicates that CPU resources are insufficient to process the inbound packets.
If no packets are dropped, examine the PKTTX/s (packets transmitted per second), MbTX/s (megabits transmitted per second), PKTRX/s (packets received per second), and MbRX/s (megabits received per second) to determine whether the expected throughput is being achieved. If necessary, consider placing a test network load in one or more VMs to measure the maximum throughput. Figure 4-23 illustrates an example of using ESXTOP to examine network statistics.
Figure 4-23. ESXTOP network statistics.

If dropped packets or low throughput is discovered for a VM or a VMkernel port, examine the dropped packets and throughput statistics for the associated physical NIC.
Determine Whether the Root Cause Originates in the Physical Network Infrastructure
To determine whether the root cause for a given network connectivity problem originates in the physical infrastructure, begin by using ping tests from within VMs or vmkping tests from the ESXi Shell to determine whether connectivity is successful using end points on the same ESXi host, same virtual port group, and same vSwitch. If you determine that tests succeed whenever they involve VMs on the same ESXi host but tests fail whenever they involve the physical infrastructure, the root cause might be in the physical infrastructure or in the ESXi host’s connection to the infrastructure. You should check settings, such as the speed and duplex of the physical adapter, as mentioned previously in this section. You should also check settings such as the NIC Teaming Load Balancing policy, MTU, and VLAN to ensure that the configuration is compatible with the physical switch port settings. For example, verify that the route based on IP Hash load-balancing policy is configured only on the virtual port group in cases where Etherchannel is configured on the associated physical ports. For another example, if the virtual port group is configured with a VLAN ID, ensure that the physical port is configured to allow that VLAN ID in its VLAN trunk.
Configure and Administer Port Mirroring
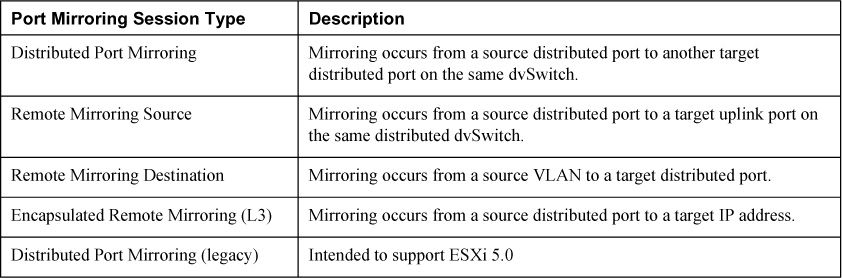
Port mirroring can be a useful troubleshooting tool for dvSwitches in cases where you need to analyze network packets for a particular VM. As described in Chapter 2 of this guide, you can create a port mirror session on a dvSwitch that mirrors packets on one virtual port to another port on the dvSwitch, where a VM is used to analyze the network packets. The VM should be using a network analysis software application, such as Wireshark. In vSphere 5.1, a mirroring session that mirrors data from one port group to another on the same ESXi host and dvSwitch is called Distributed Port Mirroring. In vSphere 5.1, several Port Mirroring Session Types can be used to allow traffic to be mirrored to VMs on other ESXi hosts, devices connected directly to an ESXi host uplink, and devices located elsewhere in the network. Table 4-5 contains a summary of the port mirroring session types provided by vSphere 5.1.
Table 4-5. Port Mirroring Session Type in vSphere 5.1
Utilize the DCUI and the ESXi Shell to Troubleshoot ESXi Networking
This section focuses on using the direct console user interface (DCUI) to troubleshoot and configure ESXi networking. Previous sections and chapters have provided details on using the ESXi Shell to troubleshoot, configure, and monitor ESXi networking, but in some cases, the DCUI might need to be used.
For example, consider a case where no ESXi management interfaces are responding to attempts to use the vSphere Client, the vCenter Server, or an SSH client to access an ESXi host. Or consider a case where Lockdown Mode is enabled and vCenter Server loses connection to an ESXi host. In these cases, you will likely need to use the DCUI to address the problem.
To get started using the DCUI to troubleshoot ESXi networking issues, access the ESXi console either directly or by an available remote access connection, such as HP ILO, Dell DRAC, or KVM. At the ESXi 5.x splash screen, press F2 to open the login prompt and enter credentials for the root account—or another appropriate Login Name. The DCUI should appear and provide a menu of options that can be used for troubleshooting, configuring, and monitoring the ESXi host, as illustrated in Figure 4-24.
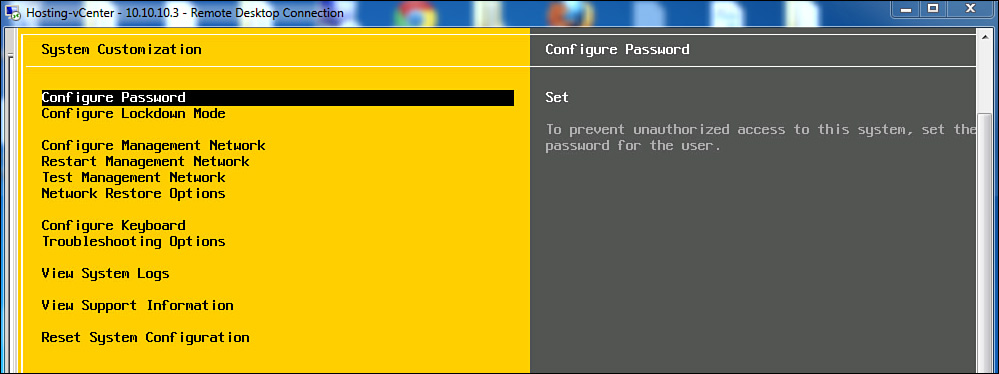
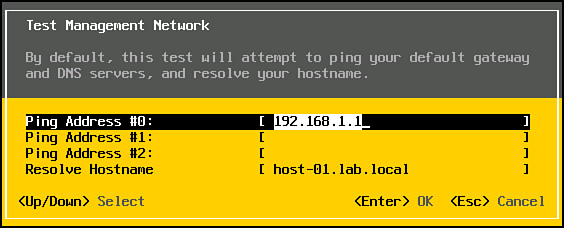
The first ESXi management network troubleshooting step is typically to select the Test Management Network option. This option provides a dialog box, as illustrated in Figure 4-25, where you can choose to ping up to three addresses and resolve a hostname. By default, it will ping the gateway and resolve its own fully qualified hostname, but you can modify these values and add more addresses.
Figure 4-25. The DCUI Test Management Network option.
Another step is to examine the configuration of the management network and make corrections, if necessary. To perform this step, select the Configure Management Network option, which enables you to change the physical network adapter, IP address, gateway, mask, and VLAN that is used for the management interface. Regardless of whether you reconfigure the management network, the next step should be to select the Restart Management Network option to see if the issue still exists.
ESXi 5.1 provides some new Network Restore Options, as illustrated in Figure 4-26. These options are useful in scenarios in which a management network issue was caused by a recent configuration change to port group or vSwitch. These options provide a means to undo or correct the misconfiguration. One choice is the Restore Network Settings option, which reverts all network settings back to the original default configuration. The other choices are the Restore Standard Switch and Restore vDS options, which revert changes made to virtual switches.
Figure 4-26. Network restore options.

Other troubleshooting steps could involve selecting the Troubleshooting option to enable the ESXi Shell, which allows you to enter the ESXi Shell from the DCUI by typing Alt-F1. From the ESXi Shell, you can use the ESXCLI command set as described elsewhere in this chapter to perform troubleshooting tasks. To return to the DCUI, type Alt-F2. From the Troubleshooting menu, which is shown in Figure 4-27, you can also select the Restart Management Agents option if you suspect the root cause is actually related to the agent itself and not the management network.
Figure 4-27. The DCUI Troubleshooting Mode Options menu.
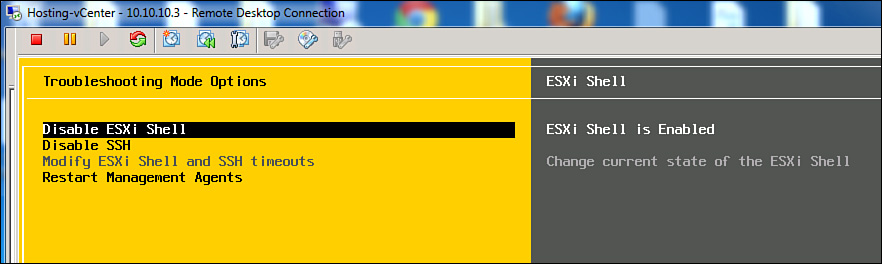
From the DCUI, you can also select the System Logs option and choose the specific logs you want to view, as shown in Figure 4-28.
Figure 4-28. DCUI system logs.
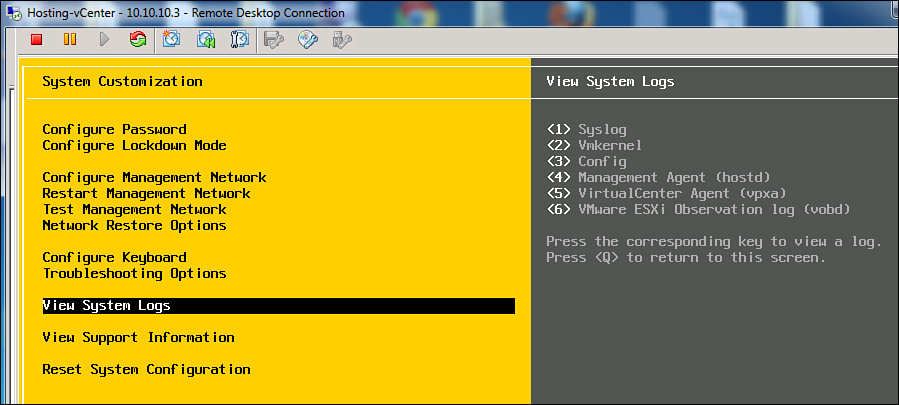
Troubleshoot Storage Performance and Connectivity
This section describes how to troubleshoot storage performance and connectivity issues. It provides details for using commands to resolve storage-related issues for ESXi hosts such as multipathing, NFS, and VMFS-related issues. It includes examples and scenarios that involve the use of the ESXCLI command set, ESXTOP, and vscsiStats.
Use ESXCLI Commands to Troubleshoot Multipathing- and PSA-related Issues
The first step for using the ESXCLI command set to troubleshoot storage issues, such as issues related to mulitpathing and Pluggable Storare Architecture (PSA), is to use it to identify storage devices (LUNs). To identify storage devices, use this ESXCLI command:
esxcli storage core device list
The results of this command tend to be long, so you might with to add | more to the end of the command to display one page at a time, as shown in Figure 4-29.
Figure 4-29. Using an ESXCLI command to list storage devices.
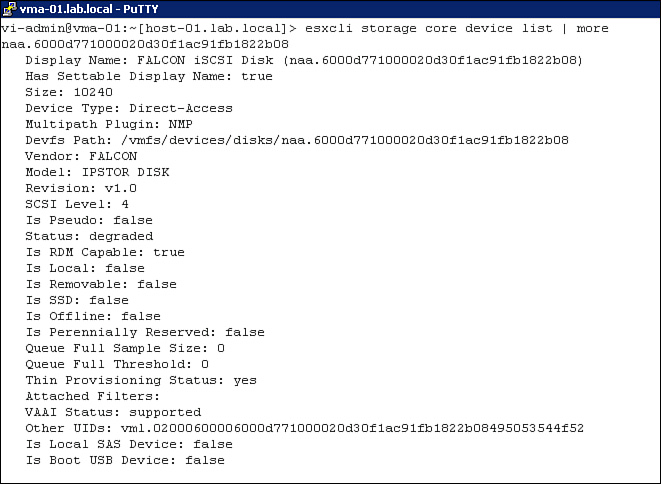
If you want to focus on troubleshooting multipathing or PSA issues related to a specific LUN, you can use the same command with the –d parameter to identify the LUN, as shown in Figure 4-30. In this example, the results show that the Multipath Plugin used to access this LUN is NMP, which is the VMware Native Multipath Plugin. This information is useful in troubleshooting PSA-related issues. In this example, you might determine that NMP is not the best or desired multipath plug-in for this LUN. Typically, this can be resolved by following the storage manufacturer’s recommendations to install vendor-specific multipath plug-ins and modify claim rules.
Figure 4-30. Using an ESXCLI command to obtain details on a specific storage device.

Another typically useful troubleshooting step is to identify all the paths to LUNs that are available on an ESXi host, using this command:
esxcli storage core path list
The results of this command contain every path that is known to the ESXi host. You could use this information to determine all the known paths for a particular LUN, but it would be challenging due to the size of the results.
A more convenient way to identify all the paths for a given LUN is to use the esxcg-mpath command. For example, to list all the paths for a LUN whose identifier is naa.6000d771000020d40f1ac91fb172e72e, use this command:
esxcfg-mpath –l –d naa.6000d771000020d40f1ac91fb172e72e
To troubleshoot multipathing issues, you might want to closely examine the details of a particular path. To see the details for a specific path, you can use the previous command with the –path parameter to identify the path using the Runtime Name, as shown in Figure 4-31. In this example, the results show that the State of the path is active. If any other value appeared for the State, it could be the sign of a problem or a misconfiguration.
Figure 4-31. Using an ESXCLI command to list multiple paths for a LUN.
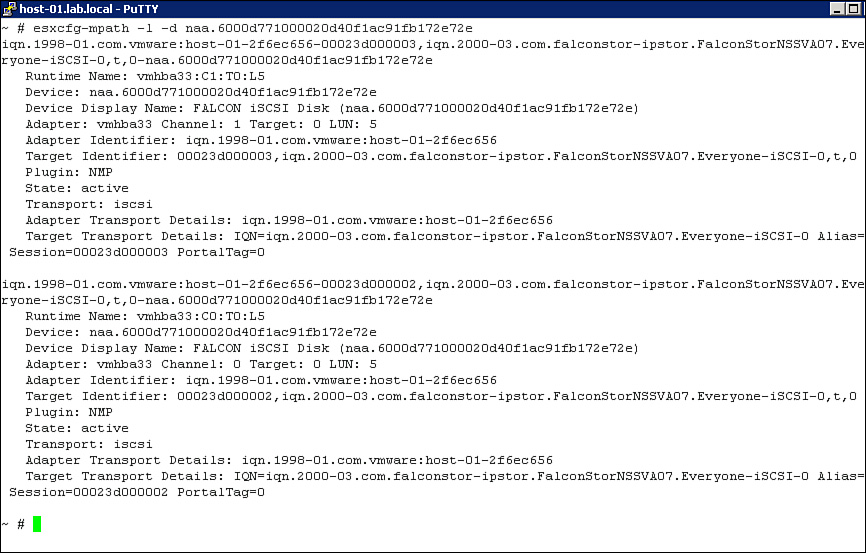
If you are concerned that a particular path has some health or performance issues, you could examine the statistics for the path by using the ESXCLI command set. For example, the following command can be used to retrieve the statistics for a specific path identified by the runtime name vmbha33:C0:T0:L9:
esxcli storage core path stats get --path vmhba33:C0:T0:L9
Figure 4-32 shows a sample of the results for this command. In this example, the results include many statistics for the path, such as 759 successful commands; 42,584 blocks read; 2 failed commands; and 0 failed write operations. When troubleshooting performance issues for a LUN, any non-zero values for the any of the Failed statistics could indicate issues with the path or the storage.
Figure 4-32. Using an ESXCLI command to get statistics for a LUN.
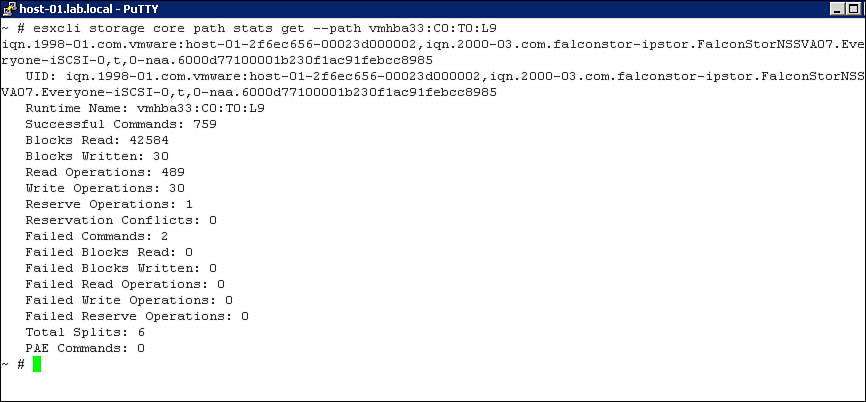
As mentioned previously in this section, you might need to modify claim rules to resolve PSA-related issues. For example, you might need to modify claim rules to allow a custom multipath plug-in or custom path selection policy to claim a LUN. Another purpose for modifying claim rules is to configure the MASK_PATH plug-in to claim all the paths to a LUN, which effectively prevents the ESXi host from accessing the LUN. For example, if you suspect that one ESXi host is experiencing unreliable connection issues to a datastore and are concerned that it could impact the performance of VMs running on other ESXi hosts, you could modify the ESXi host to allow the MASK_PATH plug-in to claim each path to the LUN. To accomplish this, first examine the current claim rule list by using this command:
esxcli storage core claimrule list
An example of this command is shown in Figure 4-33, which indicates that MASK_PATH is initially configured to claim a couple of specific DELL devices, but all other devices are claimed by NMP. In this case, you could create new rules that are assigned rule numbers in the acceptable range between 150 and 199. Each new rule should assign a specific path to the MASK_PATH plug-in.
Figure 4-33. Using an ESXCLI command to list claim rules.
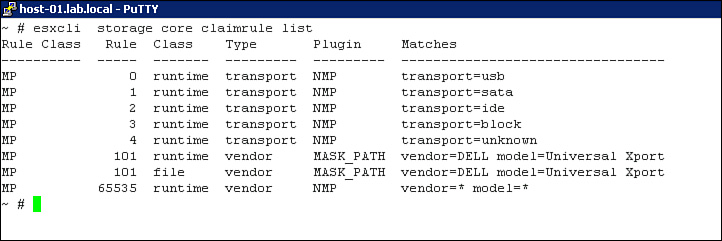
To address this need, you could create a claim rule numbered 192 that claims the path with MASK_PATH, as shown in Figure 4-34.
Figure 4-34. Using ESXCLI commands to create a claim rule.
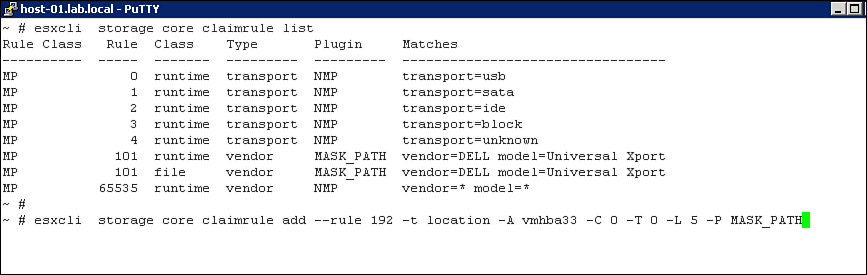
After creating the claim rule, use this command to load the rule into the active working set and to reclaim the LUN. In this example, the LUN identifier is naa.6000d771000020d40f1ac91fb172e72e:
esxcli storage core claimrule load
esxcli storage core claiming reclaim -d naa.6000d771000020d40f1ac91fb172e72e
You can then use this command to verify that one path has been removed:
esxcfg-mpath -l -d naa.6000d771000020d40f1ac91fb172e72e
You can then repeat these steps for the second path, whose runtime name is vmhba33:C1:T0:L5:
Use ESXCLI Commands to Troubleshoot VMkernel Storage Module Configurations
Troubleshooting issues related to storage modules typically begins with identifying all the storage adapters (HBAs) in an ESXi host. To do this, use the following command, which identifies the driver and other details for each HBA:
esxcli storage core adapter list
Figure 4-35 shows an example of this command. In this example, the second column identifies the driver for each HBA. You should ensure that the correct driver is assigned to each adapter by following the manufacturer’s recommendations. If you suspect that a driver or adapter is not functioning well, you could display adapter statistics using this command:
esxcli storage core adapter get
Figure 4-35. Using ESXCLI commands to list storage adapters and statistics.
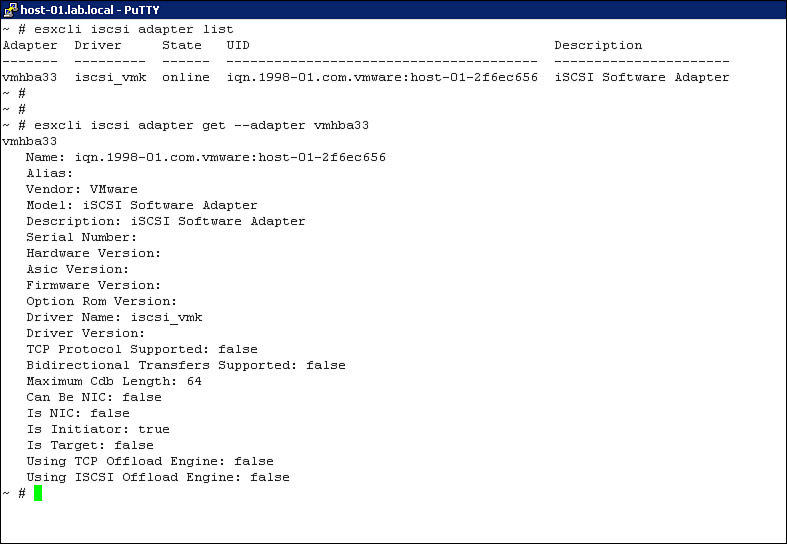
Figure 4-35 also shows an example of using this command, which shows statistics, including failure statistics. In this example, no failed commands appear on vmhba0.
A commonly used troubleshooting tactic is to rescan the paths accessible by an HBA, which can be done using the following command. In this example, the adapter identified as vmhba33 is scanned:
esxcli storage core adapter rescan --adapter vmhba33
Use ESXCLI Commands to Troubleshoot iSCSI-related Issues
The ESXCLI command set includes several commands that are specifically intended for configuring and troubleshooting iSCSI storage. These commands are in the namespace esxcli iscsi. Troubleshooting often starts by using the following command to display a list of all iSCSI adapters used by the ESXi host:
esxcli iscsi adapter list
The results of this command include the Name, Driver, State, Unique ID (UID), and Description of each iSCSI adapter. To display more details on a specific iSCSI adapter, such as an adapter named vmhba33, the following command can be used:
esxcli iscsi adapter get --adapter vmhba33
These commands, shown in Figure 4-36, can be used to examine details like the Hardware Version and Firmware Version of hardware iSCSI adapters, which can be useful for troubleshooting.
Figure 4-36. Using ESXCLI iSCSI commands.
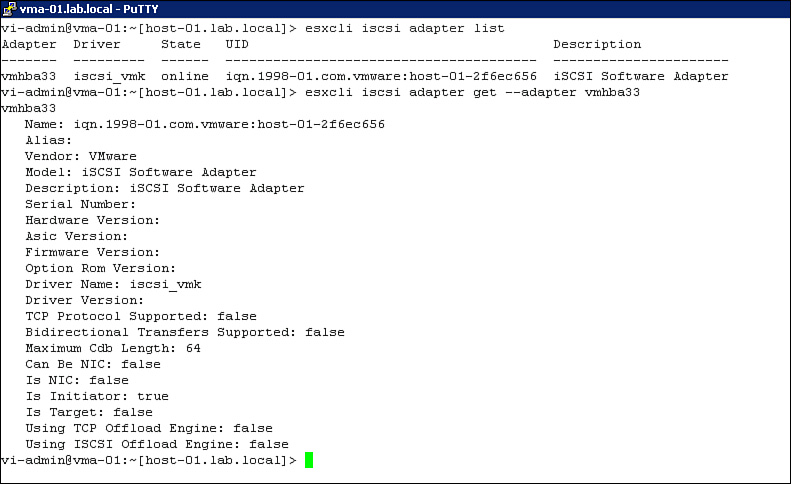
The esxcli iscsi adapter set command can be used to modify the iSCSI Qualified Name (IQN) and the Alias of the adapter. The esxcli iscsi adapter auth chap namespace can be used to view and configure CHAP settings, whereas the esxcli iscsi adapter discovery namespace can be used to manage targets. These commands could be useful modifying the adapter, its CHAP authentication, and its targets in an attempt to troubleshoot problems where the adapter is not properly discovering LUNs that have been presented to an ESXi host.
Troubleshoot NFS Mounting and Permission Issues
Troubleshooting NFS issues primarily involves examining the related settings in vSphere. For example, consider a case in which the vSphere Client is used to configure an ESXi host to connect to an NFS datastore presented by a storage device whose IP address is 192.168.1.6 using the folder /mnt/lun1, as shown in Figure 4-37.
Figure 4-37. An example of adding an NFS datastore to an ESXi host.
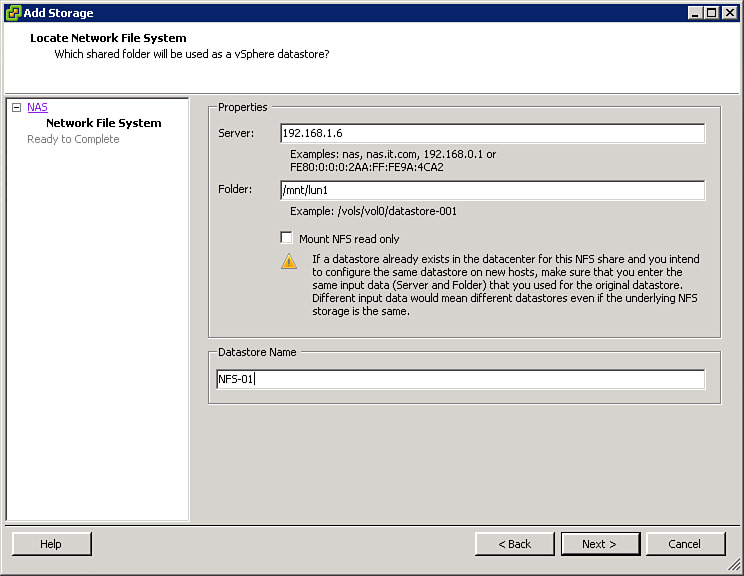
In this example, if the ESXi host has problems connecting to the datastore, you can begin troubleshooting by verifying that each of these settings is correct. Next, you can check the configuration of the VMkernel network port that is used. This port must be able to establish a network connection to the NFS server. You can test this by using the vmkping command as described earlier in this chapter.
Other potential issues can exist in the physical network infrastructure or on the NFS storage device. For example, you should work with your storage administrator to ensure that the NFS folder is properly exported to allow access by the ESXi host. The esxcli storage nfs namespace, which contains commands for adding, listing, and removing NFS datastores, can also be used for troubleshooting. For example, this namespace can be useful for creating scripts that can be quickly applied from the vMA to large groups of ESXi hosts to either retrieve data or make configuration changes that are needed to troubleshoot NFS issues. Figure 4-38 illustrates using the esxcli storage nfs add command to add an NFS datastore to an ESXi host, using the same configuration as in the last example.
Figure 4-38. Using ESXCLI commands to add an NFS datastore.
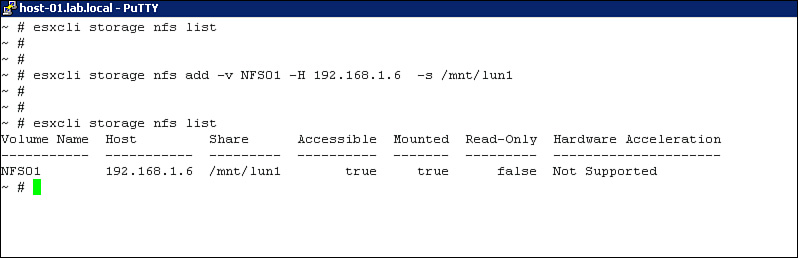
Use ESXTOP and vscsiStats to Identify Storage Performance Issues
The best set of performance statistics for identifying storage performance issues would consist of all statistics that report the latency of related objects, such as virtual disks, storage adapters, and LUNs. ESXTOP and RESXTOP can be used to examine these statistics. For example, to examine the latency for I/O that occurs on storage adapters, use ESXTOP, press the d key, and examine the GAVG/cmd column, as shown in Figure 4-39.
Figure 4-39. Using ESXTOP to examine storage adapter statistics.
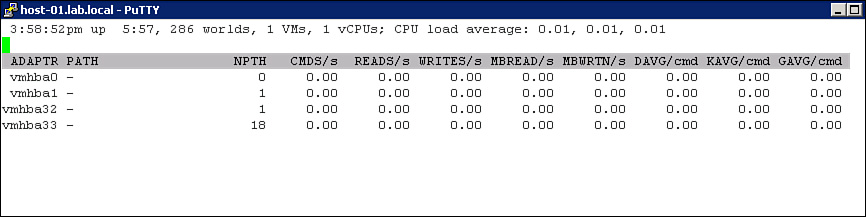
To examine the I/O latency for a particular LUN, press the u key and examine the GAVG/cmd column, as shown in Figure 4-40.
Figure 4-40. Using ESXTOP to examine LUN statistics.
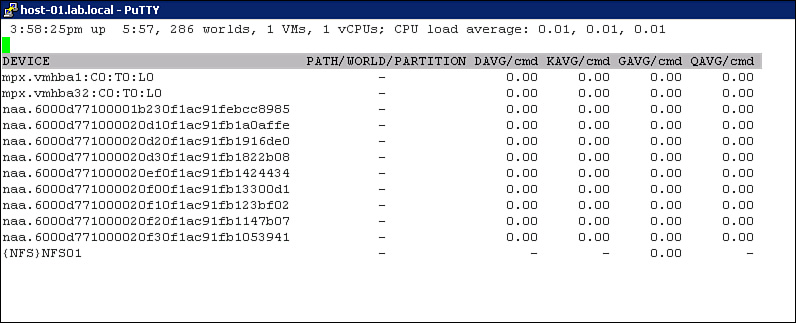
To examine the latency for I/O that occurs for a virtual disk, press the v key and examine the LAT/rd and LAT/wr columns, as shown in Figure 4-41.
Figure 4-41. Using ESXTOP to examine virtual disk statistics.

In most cases, these latency values should be less than 5 milliseconds. Whenever the GAVG/cmd value for a particular storage adapter or LUN is high, you should determine the root cause. GAVG/cmd is the metric that indicates the latency for each I/O from the guest operating system’s perspective. It includes VMkernel Latency (KAVG/cmd) and device Latency (DAVG/cmd). So, the next step is to examine the KAVG/cmd and DAVG/cmd values for the troubled adapter or LUN. High KAVG/cmd values indicate CPU contention within the VMkernel. High DAVG/cmd values indicate slowness in the physical storage infrastructure, including the storage adapters, storage network, and storage arrays.
As described previously in this chapter, the vscsiStats utility is useful for analyzing storage activity. It can be used to troubleshoot storage performance by producing histograms of latency, seek distance, I/O size, number of outstanding I/Os, and inter-arrival time whenever this data is useful. For example, if you determined that high device latency exists, you might want to learn details about the characteristics of the I/O of the VMs that are involved. This information might lead you to move some VMs to a datastore backed by a different RAID type.
To determine the seekDistance of the I/O for the second virtual disk used by vm-01, you can use vscsiStats to produce a histogram, as shown in Figure 4-42. In this example, 10,178 operations out of a sample of 14,068 had a seekDistance equal to or less than 1 LBN. This indicates the data is mostly sequential.
Figure 4-42. A seek distance histogram example.

Configure and Troubleshoot VMFS Datastores Issues Using VMKFSTOOLS
Chapter 1 of this guide contains instructions and examples of using vmkfstools to configure VMFS datastores. In this section, details are provided on using vmkfstools for troubleshooting VMFS datastores. Typically, the first step is to identify the properties of specific VMFS datastores, which can be done with this command:
vmkfstools -P /vmfs/volumes/Shared-30
In this example, the name of the VMFS datastore is Shared-30. The fully qualified path is /vmfs/volumes/Shared-30. Technically, this is the path to a file that is a symbolic link to the actual VMFS datastore. Each VMFS datastore is assigned a unique ID (UID), which in many cases should be used to reference the datastore. In this example, the /vmfs/volumes/Shared-30 symbolic link references a VMFS datastore whose UID is 5049c876-51d6f59e-a658-005056956fa9. You can use this command to learn the mapping between symbolic links and VMFS UIDs:
ls -la /vmfs/volumes
Figure 4-43 shows a sample execution of this command.
Figure 4-43. Mapping symbolic links to VMFS UIDs.

To retrieve the properties of this VMFS datastore, use the UID with this command:
vmkfstools -P /vmfs/volumes/ 5049c876-51d6f59e-a658-005056956fa9
The results of the command are identical to the results of the last command, as shown in Figure 4-44. The results contain details on VMFS UID, capacity, and spanned partitions.
Figure 4-44. VMFS properties of VMKFSTOOLS.

The vmkfstools utility can also be used to troubleshoot issues with creating and upgrading VMFS datastores. For example, if you experience issues trying to create a new VMFS volume using the vSphere Client, you could try to do so using vmkfstools –C, as explained in Chapter 1. Likewise, if you have issues using the vSphere Client to upgrade a VMFS-3 volume to VMFS-5, you could try using the vmkfstools –T command, as shown in Figure 4-45. In this example, the VMFS UID is 52d81f5d-6726097b-b2bb-005056954ce5, the VMFS name is VMFS-003, the original VMFS version is 3.58, and the updated VMFS version is 5.58.
Figure 4-45. Upgrading a VMFS datastore using VMKFSTOOLS.

Troubleshoot Storage Snapshot and Resignaturing Issues
Many storage systems allow the administrator to create replicas of LUNs, which might contain VMFS datastores. When an ESXi host accesses a LUN replica, it detects that the SCSI_DiskID information in the VMFS metadata does not match the SCSI_DiskID information stored in the Logical Volume Manager (LVM) header and classifies the LUN as a snapshot. This is done by design because corruption issues could occur if any ESXi host is presented with both the original LUN and the replica. An ESXi host cannot determine the difference between two VMFS volumes that contain the same VMFS UID in its metadata. The administrator should ensure that no ESXi host is ever permitted to mount two LUNs containing the same VMFS UID.
For this reason, if any ESXi host attempts to mount a VMFS datastore that it detects as a replica, it prompts the user to choose one of two options to complete the mount operation. One option is the Keep the existing signature, which maintains the VMFS UID but updates other VMFS metadata. This option can be used if the replica is not presented to any ESXi host that accesses the original LUN. This can be useful when SAN replication is used for disaster recovery (DR). The other option is to use Assign a new signature, which updates the UID in the VMFS metadata. This option must be selected if the replica will be presented to an ESXi host that accesses the original LUN.
When troubleshooting issues exist where an ESXi host has difficulty mounting a new VMFS datastore, you can check the VMkernel log. If it contains a message with a string similar to Device vmhba1:0:5:1 is a snapshot, the ESXi host is deliberately not mounting the VMFS datastore. If the vSphere Client is also not prompting you to keep the signature or assign a new signature, you might need to use an ESXCLI command to fix the issue. In this case, use this command to determine whether the ESXi host truly detects a snapshot:
esxcli storage vmfs snapshot list
If a snapshot is detected for a VMFS datastore, whose UID is 52d81f5d-6726097b-b2bb-005056954ce5, then you can use the following ESXCLI command to resignature the VMFS datastore.
esxcli storage vmfs snapshot resignature -u=52d81f5d-6726097b-b2bb-005056954ce5
Analyze Log Files to Identify Storage and Multipathing Problems
Troubleshooting storage and multipathing issues often requires the examination of VMkernel log files. The VMkernel log file can be viewed from the DCUI as described in a previous section. It can be examined from a vSphere Client that is connected directly to an ESXi host. It can also be examined from the ESXi Shell using traditional commands, like cat, less, more and grep. For example, you can use the grep command to search the VMkernel log file for any rows containing the string “error” using this command:
grep error /var/log/VMkernel.log
Here are a few examples of error messages that might appear in the log file.
The VMkernel log file might contain an entry similar to following sample, which indicates that a LUN, whose runtime name is vmhba33:C1:T0:L5, is detected to be a replica:
Jan 18 11:15:41 Host-01 VMkernel: 0:14:17:59.787 cpu13:1046)LVM:5670: Device vmhba33:1:0:5 is a snapshot
The VMkernel log file might contain an entry similar to the following sample, which indicates a SCSI error. In this example, the portion marked as bold (in this guide, not in the actual log file) is a Device Status number that identifies the issue. In this example, the Device Status is 0x8, which indicates the SCSI device was too busy to accept the SCSI command, which the VMkernel will automatically resend again. A number of these messages could indicate the LUN is overloaded.
VMkernel: 1:02:02:02.206 cpu3:4099)NMP: nmp_CompleteCommandForPath: Command 0x28
(0x410005078e00) to NMP device "naa.6001e4f000105e6b00001f14499bfead" failed on
physical path "vmhba1:C0:T0:L100" H:0x0 D:0x8 P:0x0 Possible sense data: 0x0 0x0
0x0.
The VMkernel might contain other entries with similar codes that indicate the meaning of the error. Table 4-6 shows a few examples of Device Status codes and a brief description of each. Each of these can indicate that the LUN is overworked. One possible solution is to migrate one or more VMs to other datastores.
Table 4-6. SCSI Device Status Codes Examples
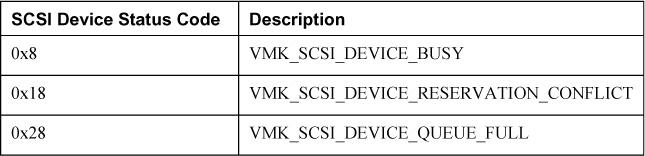
Troubleshoot vCenter Server and ESXi Host Management
This section describes how to troubleshoot vCenter Server and ESXi host management-related issues. It includes details on troubleshooting issues related to services and connections involving the vCenter Server, the vCenter Server database, and the ESXi host management network. These steps involve the use of the vSphere Client and the ESXi Shell. Although this section does not directly cover performance troubleshooting, it is placed in the same chapter mainly because issues that impact ESXi host management could impact the availability of tools that are useful for performance troubleshooting.
Troubleshoot vCenter Server Service and Database Connection Issues
Database connection issues will cause the vCenter Service to fail and prevent it from starting. A symptom of this is that the vCenter Service cannot be started or fails shortly after being started. Another symptom is that the vpxd.log file contains one or more “ODBC error” messages. When troubleshooting issues exist where the vCenter Server fails to start or immediately crashes after starting, you can begin by testing the database connection. Log on to Windows on the vCenter Server and select Administrator Tools > Data Source (ODBC) Connections. Locate and select the System DSN connection for the vCenter Server database. Click the Configuration button and then verify the settings such as database server name, database name, and user credentials. Click the Test Connection button.
Also from Windows on the vCenter Server, select Administrator Tools > Services to check the status of the VMware VirtualCenter Server service. If necessary, right-click the service and select Start, Stop, and/or Restart as needed to troubleshoot. If you suspect that a database connection issue involves improper user authentication or authorization, right-click the VMware VirtualCenter Server service and select the Properties > Logon tab to configure the user account used to run the service. Also from Windows on the vCenter Server, select Administrator Tools > Services to examine and manipulate other vCenter Server related services that might be installed, such as the VMware vCenter Inventory Service and the VMware VirutalCenter Management Webservices. Issues with these services might not always cause complete vCenter Server failure, but they will certainly have some impact. For example, if the VMware VirutalCenter Management Webservices fails, the symptom might be that although the vCenter Server is functioning, some features such as Overview Graphs, the Storage View tab, and Hardware Health might not be functional. To troubleshoot such issues, begin by restarting the VMware VirutalCenter Management Webservices service.
Troubleshoot ESXi Firewall Issues
You can use the Security Profile in the vSphere Client to examine and configure the ESXi firewall. To do so, select the ESXi host in the inventory, select the Configuration tab, and select Software > Security Profile. In the Firewall section, click Properties. Use the Firewall Properties page to enable (check) each required traffic type to permit through the firewall. For example, if NTP is not working correctly, ensure the NTP Client is checked, as shown in Figure 4-46.
Figure 4-46. Examine an ESXi host’s firewall properties.
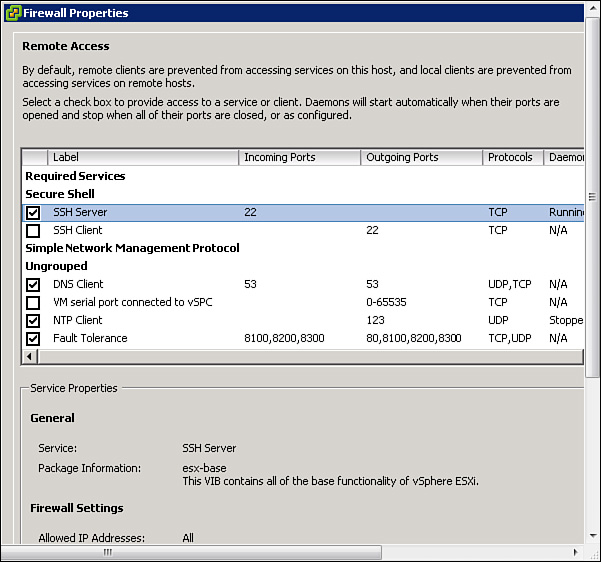
For more extensive troubleshooting needs, you can use the Firewall Properties page to examine and verify that the correct Incoming Ports and Outgoing Ports are identified for each service. You can use the Options button to start and stop the corresponding services manually and to configure the corresponding services to automatically start with the ESXi host or automatically start when the ports are enabled. For example, the NTP Client service can be configured to start manually, automatically start when the ESXi host restarts, and automatically start when the NTP Client is enabled in the firewall, as shown in Figure 4-47.
Figure 4-47. Modifying the NTP daemon options in the ESXi firewall.

The ESXi firewall provides the ability to restrict the networks that are permitted to connect per service type. For example, to restrict the networks that can connect to the VMware vCenter Agent, such that only the vCenter Server IP address is allowed, click the Firewall button and specify the vCenter Server IP address in the Only allow connections from the following networks box, as shown in Figure 4-48.
Figure 4-48. Restricting IP addresses in the firewall.
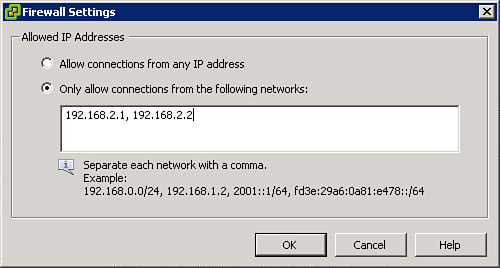
Troubleshoot ESXi Host Management and Connectivity Issues
The ESXi hosts have management agents named vpxa and hostd. The vpxa agent is responsible for communicating with the vCenter Server, whereas the hostd agent is responsible for most other management functions on the ESXi host. If vCenter Server reports that an ESXi host is Not Responding, the problem could be that one or both of the management services on the ESXi host needs to be restarted. To restart these agents using the DCUI, select Troubleshooting Options and then select Restart Management Agents. You can also use the ESXi Shell to restart the agents by using the following commands:
/etc/init.d/hostd restart
/etc/init.d/vpxa restart
Summary
You should now have the knowledge and skills to successfully perform administration tasks focused on monitoring, optimizing, and troubleshooting VM performance in a vSphere environment. You should also be able to successfully complete cluster configuration, troubleshooting, and management tasks that might be part of the VCAP5-DCA exam. Be sure to take time to practice the steps that are provided in this section until you are confident that you can perform such tasks quickly and without any assistance.
Exam Preparation Tasks
Review All the Key Topics
Table 4-7 provides a list of all Key Topics identified in this chapter along with a few notes intended to refresh the reader’s memory of some key details. This can be useful as a quick reference when performing vSphere administration.
Table 4-7. Key Topics for Chapter 4
