Chapter 7. Logging
This chapter covers the following subjects:
• vCenter Server log files and locations—This section will detail vCenter Server log files that are useful in troubleshooting.
• ESXi log files and locations—Log files for ESXi hosts are important when it comes to troubleshooting. A number of log files exist, and some of the more important ones will be detailed in this section.
• Tools used to view vSphere log files—Several different tools can be utilized by the system administrator to analyze vSphere log files. This section will discuss tools such as the Syslog Collector and Log Bundles.
The material in this chapter pertains to the VCAP-DCA Exam objectives 6.1.
When a computer’s operating system begins to have problems, analyzing log files can help to determine the underlying cause. In the early days of Unix, a program called Syslog was created by Eric Allman at the University of California-Berkley. It became a standard for logging errors in many Unix- and Linux-based operating systems. The ESXi hypervisor or vmkernel is proprietary code that uses device drivers written using Linux-like programming due to the engineers’ expertise with Linux. The original hypervisor, ESX, included a service console that was derived from Red Hat Linux, although it was not a true Linux host. ESXi eliminates the Service Console and utilizes BusyBox, a small executable that provides several Unix-style tools that allow for the same management tasks the Service Console was capable of. As a result, it stands to reason that ESXi would invoke Syslog as its tool of choice for logging. In previous versions of vSphere, the ESXi host primarily used standard Syslog for logging, and the vCenter Server—which was Windows-based—used its own logging method. So you had this Wild West of logging within vSphere 4.1 and earlier in which there was no standardization. In vSphere 5.0, changes were made by VMware in the way logging was implemented. There was a decision to begin standardizing logging using Syslog, although with some minor changes. In this module we look at some of the changes in logging with vSphere 5.x and how Syslog has been implemented.
One of the important topics that also is discussed in this module is how to create a log bundle. When a support issue exists within vSphere and you contact VMware support, you will most likely be asked to provide a log bundle. In this module, we show several methods you can use to accomplish this task. Of course, any of the choices will work.
Another topic that is discussed is listing the log files and where they are located for the vCenter Server and the ESXi hosts. A section is devoted to listing these log files and giving brief descriptions of their functions. Many system administrators perform their own diagnosis of problems, so we’ve included a section describing how to view log files and make implementation changes to them.
In addition, this chapter looks at tools built in to vSphere. The Syslog Collector is a tool you can use to gather log files from multiple ESXi hosts and collect them onto a single system. The idea is that by centralizing all the log files in one location, an administrator will have to sift through only one system for troubleshooting information.
“Do I Know This Already?” Quiz
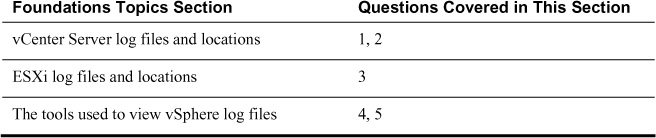
The “Do I Know This Already?” quiz enables you to assess whether you should read this entire chapter or simply jump to the “Exam Preparation Tasks” section for review. If you are in doubt, read the entire chapter. Table 7-1 outlines the major headings in this chapter and the corresponding “Do I Know This Already?” quiz questions. You can find the answers in Appendix A, “Answers to the ‘Do I Know This Already?’ Quizzes and Troubleshooting Scenarios.”
Table 7-1. “Do I Know This Already?” Foundation Topics Section-to-Question Mapping
1. Which file represents a default vCenter Server log file?
a. vpxd.log
b. shell.log
c. vCenter.log
d. syslog.log
2. Which tool will not allow you to create a vCenter Server log bundle?
a. PowerCLI
b. vSphere Client
c. vm-support
d. vSphere Dump Collector
3. Which log file will contain a history list of all commands run from the command line of an ESXi host?
a. hostd.log
b. syslog.log
c. auth.log
d. vCenter.log
4. Which two locations do not require installation of the Syslog Collector to provide log centralization? (Select two.)
a. A Windows-based vCenter Server
b. The vCenter Server Appliance
c. A Windows virtual machine
d. The vSphere Management Appliance
5. The vSphere ESXi Dump Collector can be configured on which two locations? (Select two.)
a. The vCenter Server Appliance
b. An Auto-Deployed ESXi host
c. A manually deployed ESXi host
d. A Windows virtual machine
Generate vCenter Server and ESXi Log Bundles
Support for software companies has changed over the years. When you call VMware support, they typically request that you send them diagnostic information.

This diagnostic information can be in the form of a log bundle or a diagnostic bundle such as that produced by vCenter Server or a diagnostic bundle containing log files, configuration files, and a capture using esxtop such as that generated by the vm-support utility on an ESXi host. The bundle generated will be either a Zip file or in a tar format gzip depending on the source system. You can unzip or gunzip and extract the log files if you want to inspect the files yourself. Export System Logs is a built-in vSphere Client tool that compresses and gzips configuration and log files into one file that can then be sent to VMware support, or it can be used by the system administrator to troubleshoot an issue.
Generate a Log Bundle on the ESXi Host Using vSphere Client
So depending on the method, individual logs can be bundled together or bundled along with configuration files and additional diagnostic information. The primary method many system administrators use to create a log bundle is through the vSphere Client. If you were to call VMware support and they needed to look at log files, this would be the format they would want to receive to diagnose a support issue.
To generate a diagnostic log bundle for an ESXi host using the vSphere Client, first log in to the ESXi host from the vSphere Client. Then from the Home view, select Administration, System Logs. Figure 7-1 shows an example of using the vSphere Client to view an individual log file, as well as the location of the Export System Logs tool.
Figure 7-1. The Server log file is being displayed, as well as the Export System Log tool.
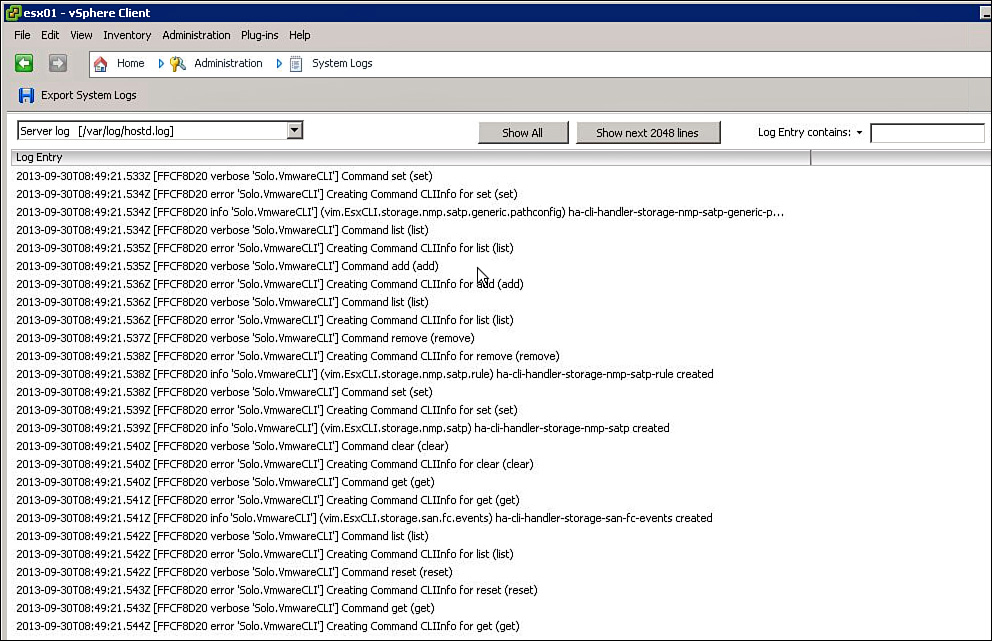
The current log file being displayed in Figure 7-1 is the /var/log/hostd.log file, which is the log file for the ESXi host management agent. The other two log files that can be viewed in the windows by selecting them from the drop-down box are the /var/log/vmkernel.log file, which contains messages specific to the ESXi hypervisor, and the /var/log/vpxa.log file, which contains messages specific to the vCenter Server agent. To create a log bundle, click the Export System Logs button. The window that appears allows you to select the system logs that will be placed into the bundle, as shown in Figure 7-2. Place a check mark next to all the log files you want to incorporate into the log bundle; then decide on whether performance data should be included with the log files as well. Selecting Next prompts you to supply the directory location where you want the output file to be created.
Figure 7-2. Select System Log files to be included in the log bundle.

Generate a Diagnostic Log Bundle on the ESXi Host/vCenter Server Using vm-support
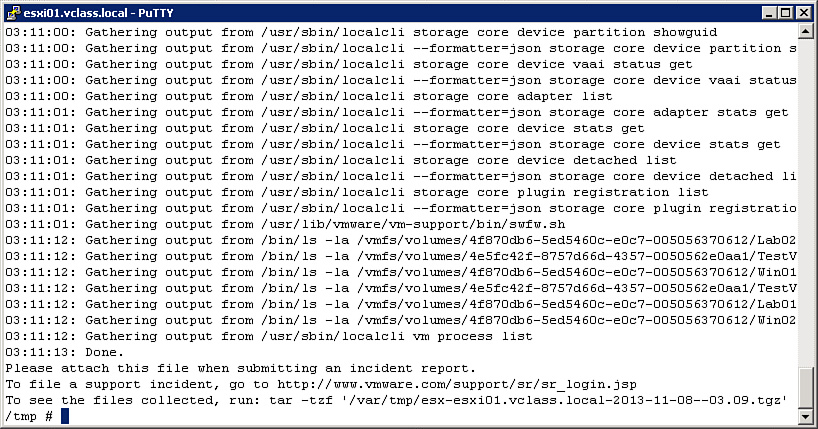
The traditional command-line method of creating the diagnostic bundle can still be accomplished using a Secure Shell (SSH) tool such as PuTTY. After logging in to the ESXi host, from the command line you can run vm-support from any directory because /sbin is in the path. The script /sbin/vm-support is an ASCII file, and you can view the file to learn more about the bundling process. When you run vm-support it creates a single Zip file containing log files, configuration files, and a capture of performance data using esxtop. In Figure 7-3 you can see the command-line command vm-support being executed and creating the diagnostic bundle.
Figure 7-3. Creating a diagnostic bundle using the vm-support utility.
After you create the diagnostic bundle, you can FTP it or upload it to VMware support. A knowledge base document on how to upload diagnostic information is available; the kb.vmware.com document number is 1008525.
Note
To see additional options to create the support log bundle, use the command vm-support –h for a list of additional options.
Generate a Diagnostic Log Bundle on the ESXi Host or vCenter Server Using PowerCLI
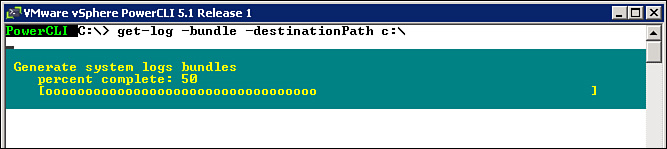
After logging in to the vCenter Server or an ESXi host using the Connect-viserver PowerCLI cmdlet, you can use the Get-Log cmdlet to generate a diagnostic bundle. As shown in Figure 7-4, a progress bar will display the completion status of the diagnostic bundle created using the Get-Log cmdlet.
Figure 7-4. The progress bar running during the Get-log PowerCLI cmdlet.
As shown in Figure 7-5, upon completion the PowerCLI console window displays the name of the output file. This Zip file can now be uploaded to VMware support or stored for later use.
Figure 7-5. A completed log bundle using PowerCLI.

Generate a Diagnostic Log Bundle Directly on the vCenter Server
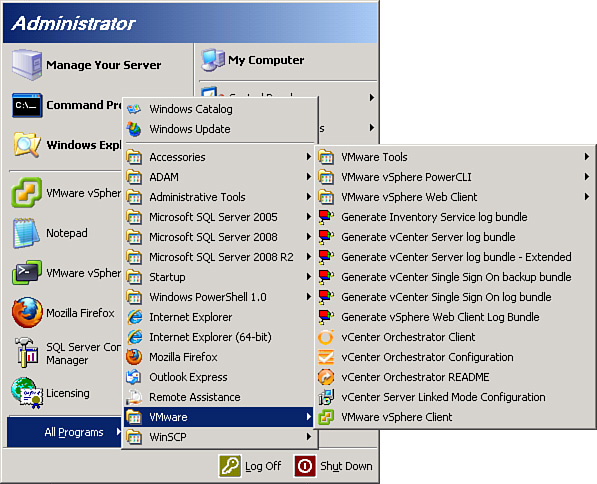
The Windows vCenter Server machine contains a built-in method to generate diagnostic bundles. Open a menu by clicking the Start button located on the vCenter Server desktop. Next, select All Programs > and find and select the VMware folder. Figure 7-6 displays the available VMware programs. Two of the programs displayed include Generate vCenter Server log bundle and Generate vCenter Server log bundle - Extended. The extended option adds msinfo.txt and netstat active connection information.
Figure 7-6. VMware programs available, which include the log bundle creator.
Generate a Diagnostic Log Bundle on the vCenter Server Using vSphere Client
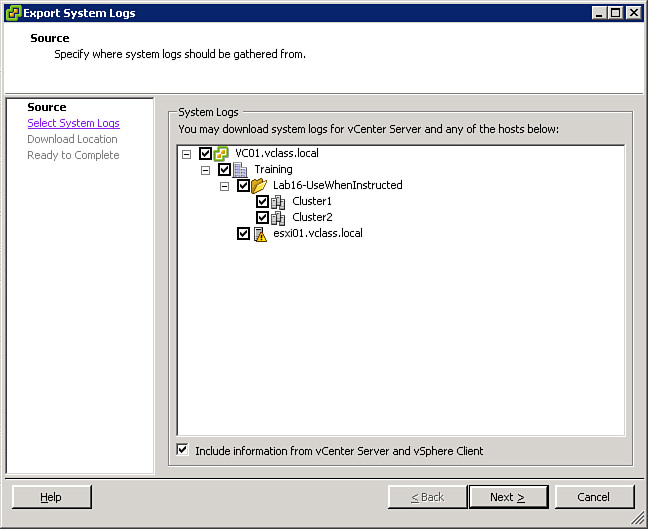
The process and the steps performed to generate a diagnostic bundle on the vCenter Server using the vSphere Client are almost identical to the steps used to generate a diagnostic bundle on an ESXi host. However, the main difference when generating diagnostic information using a vSphere Client pointed to the vCenter Server is that information can be collected from any of the managed ESXi hosts and also from the vCenter Server. This can be especially useful when troubleshooting more complex issues not isolated to a single host.
Add a check mark to the vCenter Server and all the ESXi hosts you want included in the log bundle. In Figure 7-7 you can decide which hosts will be included in the log bundle, and you can choose to add the vCenter Server into the log bundle as well. The screenshot shows the objects vc01.vclass.local, which is the vCenter Server, and esxi01.vclass.local, which is an ESXi host, being included into a log bundle created using Export System Logs.
Figure 7-7. Decide which hosts and vCenter Server to include in the diagnostic bundle.
In the Export System Logs window in Figure 7-8, you can choose which system log files you want included in the diagnostic bundle. If you decide to add performance data to the Support Bundle, you will need to specify how long to run the script that gathers the data. The maximum gathering period is up to one day, and the interval used to collect data can be up to a maximum of one hour. After determining the appropriate settings, click Next.
Figure 7-8. Specifying which System Logs and performance information in log bundle to include.

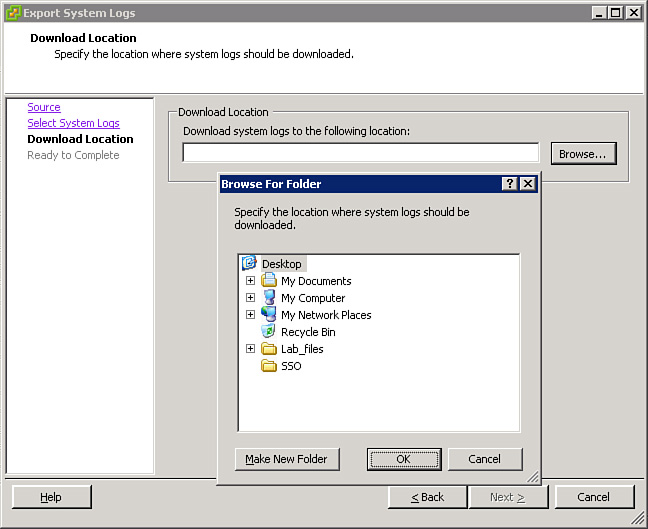
In the Download Location pane in Figure 7-9, you can select Browse to choose a location on the client’s disk where you want to save the diagnostic bundle. This will be the location where the log bundle file will be saved to on the vCenter Server.
Figure 7-9. Download location for the diagnostic bundle.
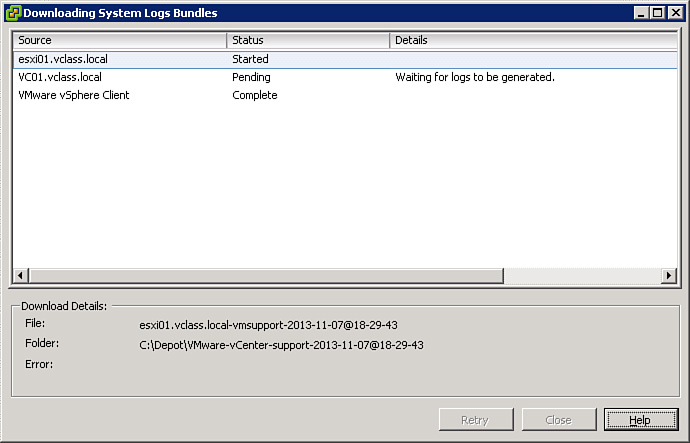
After you have selected the download location, click Next and the system will begin to bundle all the log files into a single file that is in tar format and is gzipped. Figure 7-10 shows the diagnostic bundle being built. The download location where the diagnostic bundle is going to be placed is listed in the Download Details. After the process is completed, you can inspect the compressed tar ball by uncompressing it and extracting the tar ball. Or you can FTP the gzipped tarball to VMware support.
Figure 7-10. Building the log bundle.
Configure Logging Level for the vCenter Server
Adjust the logging level for the vCenter Server affects the amount of detail the vCenter Server collects in the log files. The logging level options are listed in Table 7-2.
Table 7-2. Logging Levels for vCenter Server

To modify vCenter Server logging options using the vSphere Client, select the drop-down menu Administration and select the vCenter Server Settings option. From vCenter Server Settings, select Logging Options. The dialog box shown in Figure 7-11 appears, and you can set the vCenter Server logging level to the desired option. The default option is Information; if you need a more verbose option, you can select the Trivia option. This gives you the most logging information, which can be beneficial in troubleshooting.
Figure 7-11. Select logging options.

Log Files
The log files for the ESXi host and vCenter Server can be useful in troubleshooting problems with vSphere. Log file entries contain configuration and operational errors as well as performance information. There are many log files on the ESXi host and the vCenter Server. Some of the more important ESXi log files that can be used for troubleshooting are listed in the following section.
ESXi Host Log Files
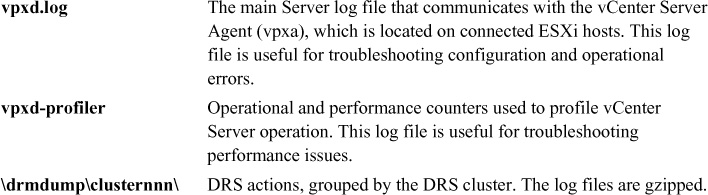
The vCenter Server log files have different directories depending on the Windows Server version on which the vCenter Server has been installed. The most recent versions of vCenter Server were supported to run on Windows 2003 and Windows 2008. Both versions of Windows have different directories where the vCenter Server log files are located. On the Windows Server 2008, the files are found in the following directory:
%ALLUSERSPROFILE%VMwareVMware VirtualCenterLogs
vCenter Server Log Files
Viewing Log Files
ESXi log files can be viewed using the command line by logging in to the ESXi Shell and running commands such as cat, tail, more, less, or any command that allows you to view a file. The tail –f <filename> is a commonly used command-line command that enables you to see changes being added to the log file as they happen. You run this command in the background, which keeps the log file open. The other option for viewing log files is using the vSphere Client to log directly in to the ESXi host.
The vCenter Server log files can be viewed directly on the Windows host system or by using the vSphere Client, as shown in Figure 7-12.
Figure 7-12. Viewing logs using the vSphere Client.

Use ESXCLI System Syslog to Configure Centralized Logging on ESXi Hosts
One of the changes in vSphere 5 is that VMware began to standardize how logging was done by using Syslog for all logging. The Syslog process is designed to handle log messages from the VMkernel, daemons, logger program, and other programs and processes. For remote logging, log messages can be sent to a centralized logging system and system panics can be sent to a remote dump collector. Therefore, troubleshooting log files after a reboot can be performed on the remote Syslog server. Due to the local log files now being stored on a RAM disk in memory, if the ESXi host reboots or crashes, the local log files on the ESXi host are lost. So in vSphere 5, Syslog can now be used to send log entries to a centralized remote log server, instead of storing the log files on the vCenter Server.
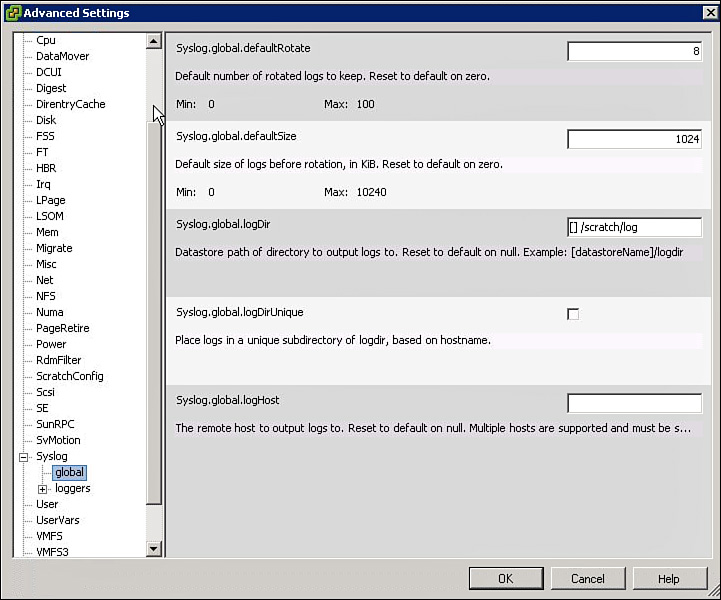
System logging using syslogd has been a traditional method for performing Unix and Linux logging for a long time. In vSphere 5, VMware modifies Syslog changing the name of the daemon to vmsyslogd. Another change is the filename of the socket for incoming logging, which is now /dev/klog. So the VMkernel, daemons, and programs will send their initial log messages to the /dev/klog socket. The vmsyslogd daemon queries /dev/klog for incoming logs. When vmsyslogd grabs a new log, it then has to figure out what to do with the log information. The configuration of how Syslog is handled is done using the vSphere Client or by using command-line commands. Figure 7-13 shows how Syslog configuration is handled using the vSphere Client. You can see several of the configuration changes that can be made. To configure Syslog in the vSphere Client, highlight the ESXi host, click the Configuration tab, and then select Advanced Settings under the Software section.
Figure 7-13. Configuring Syslog using Advanced Settings.
To configure Syslog using the esxcli command line, you first need to authenticate to the ESXi host using an SSH client such as PuTTY. After logging in to the ESXi host, you can execute commands using the vSphere command-line interface. The options that are configurable in the command line in many cases have a similar functionality when using the vSphere client.
An example of using the esxcli system syslog namespace is shown in Figure 7-14. The first command shows the esxcli get option, which can be used to display several Syslog settings. An example of one of the syslog settings is log file retention for the ESXi host, which defaults to eight log files to retain. These Syslog settings can be modified using the esxcli set option. The example in Figure 7-14 shows using the esxcli set option to change the current number of log files, which is eight for the ESXi host, and set the new retention value to five.
Figure 7-14. Using ESXCLI to get and set the Syslog settings for the ESXi host.
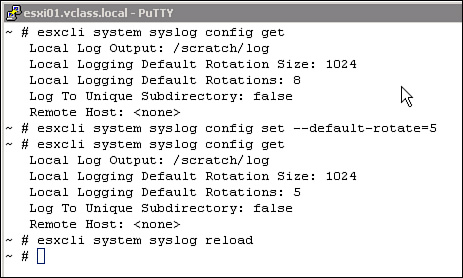
The modifications that are being made in Figure 7-14 are to system variables for the ESXi host. The command esxcli system syslog config get shows the current values for Syslog options. In the example, the esxcli system syslog config get command is shown before and after the change is made to show the effect of the change. A Syslog change is made by running the command line:
esxcli system syslog config set --<options>
An example of the set option is shown in Figure 7-14 modifying the syslog.global.defaultRotate Syslog option. Other changes to Syslog options can also be made using esxcli. Table 7-3 shows the Syslog configuration options that can be modified for the ESXi host. After making configuration changes, you need to restart vmsyslogd and load the changes into live memory, which is accomplished using the reload option, as shown in Figure 7-14:
esxcli system syslog reload
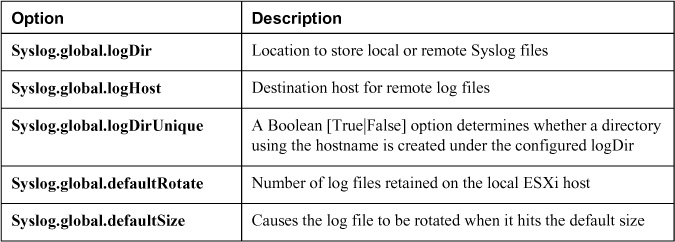
The configuration options for Syslog are detailed in Table 7-3. These options can be changed using either the vSphere Client or the command line. An example of making changes to Syslog using the command line is shown in Figure 7-14. Another example of making a change to Syslog, but using the vSphere Client, is shown in Figure 7-13.
Table 7-3. Syslog Configuration Options
Install and Configure VMware Syslog Collector
All ESXi hosts run a Syslog service (vmsyslogd), which logs messages from the VMkernel to a log file. In vSphere 5 the log files are stored in the /var/log directory, which is a soft link to the /scratch/log directory. The /scratch/log directory is a scratch partition located in memory. Because the scratch partition is located in memory, updates to the file have a better chance of not being dropped than if the file was located on a hard drive. This benefit, though, is offset by the issue of an ESXi host reboot, which causes all the changes in the in-memory log files to be erased. However, locating logs to a local disk is not always possible because some ESXi hosts do not have hard disks, such as an Auto Deployed ESXi host. Therefore, to set up a location for longer-term storage of log files that can survive a reboot, you need to set up a centralized Syslog Collector. The centralized Syslog server will be advantageous for not only surviving a reboot, but also for providing one place to go to easily access and manage log files that will be collected from all the ESXi hosts in a vSphere implementation.
vCenter Server Appliance and Syslog Collector
The Syslog Collector is bundled into the vCenter Server Appliance. The VCSA server acts as a Syslog server receiving log files from ESXi hosts forwarding their log files, including those provisioned with Auto Deploy. Because the Syslog Collector is installed and built in to the vCenter Server Appliance, no extra setup is required. By default, the log files managed by Syslog will be located in the /var/log/remote/<hostname>/ directory.
Windows vCenter Server and Syslog Collector
When using vCenter Server on a Windows virtual machine, the vSphere Syslog Collector needs to be installed from the vCenter Server Installer, which is shown in Figure 7-15. You will be given the option during the install process to install the Syslog Collector on the same machine as the associated vCenter Server or on a different machine that has network connectivity to the vCenter Server. You can select a few options during the install process such as the maximum number of Syslog Collector log rotations to maintain. Following the wizard prompts during the installation enables the Syslog Collector to be functional after the install.
Figure 7-15. Windows vCenter Server Installer choosing Syslog Collector.

Analyze and Test Logging Configuration Information
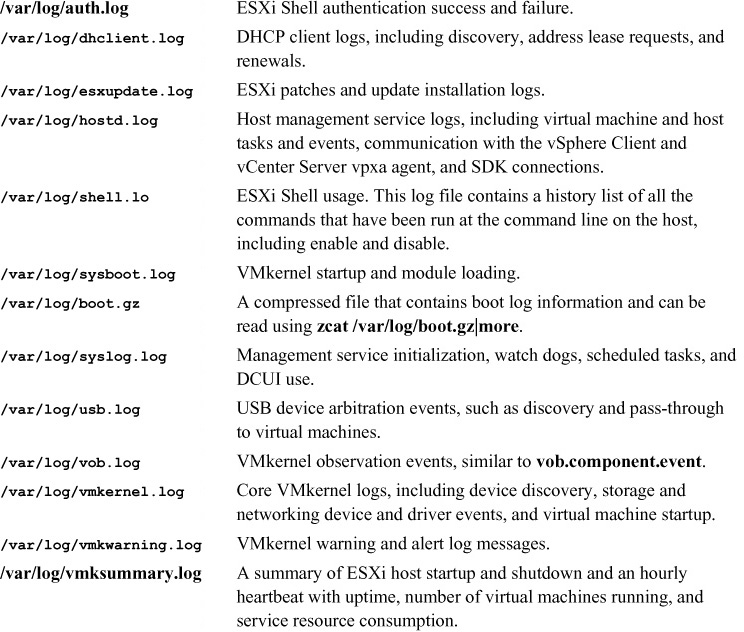
One of the changes that was made in vSphere 5 logging was separating all the log files to help identify more patterns, which will lead to solving more issues. As an example, say a system-wide outage occurred. In this case, the vmkwarning.log and vmksummary.log log files would be the best source for log messages to diagnose the problem. The separation of logging to multiple log files helps to categorize log data into specific files to make it easier to locate the information necessary and help solve problems.
In the previous section, we learned how to modify the Syslog configuration options. The system administrator can utilize either the vSphere Client or the esxcli command-line options to make changes to the logging configuration. The esxcli system Syslog has options to display logging information and modify the log file sizes, log rotation, and a few other options as well.
Analyze Log Files to Resolve Issues
In the /var/log directory a couple of the important files to view are the vmkernel.log file and the vmksummary.log file. These log files contain configuration information and tend to be common files to view when troubleshooting problems on the ESXi host. The vmkernel.log file contains the main vmkernel log messages as well as events that happen with networking and storage. The other log file is the vmksummary.log file. This file contains the logging of the ESXi host when it powers on and powers off, as well as other important events on the ESXi host.
Figure 7-16 shows the vmkernel.log file. When you initially observe the file, figuring out how to read it can be confusing. One change that has been implemented in all the major log files is a new date and time stamp at the start of each line. In Figure 7-16, the last two lines in the vmkernel log file were created by running the esxcli command-line command twice:
esxcli system syslog mark -–message="Test Message!"
Figure 7-16. vmkernel.log file.

Note
Hexadecimal numbers in T10 documentation use the NNNh notation, whereas SCSI status codes logged to the ESXi host use the equivalent 0xNNN notation—for example, 0x2 == 02h.
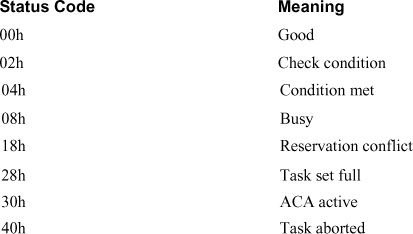
In Figure 7-16, the log file vmkernel.log is displayed. The log file shows VMkernel messages related to storage and contain SCSI Sense codes. The SCSI Sense codes are an industry standard maintained by an independent organization called Technical Committee T10. The ESXi host and all storage arrays conform to this standard. The Sense codes are sent during the status phase, which occurs prior to the Command Complete Message and indicates success or failure. Any time a SCSI command is sent to a target, the initiator expects a completion status. The various status codes and descriptions are shown in Table 7-4.
Table 7-4. Lockdown Mode Behavior
For more information, see http://www.t10.org/lists/2status.htm.
Here is an example of a vmkernel.log file entry:
vmkernel:77:17:30:20.109 cpu7:2050)NMP: nmp_CompleteCommandForPath: Command 0x28 (0x41000b10f000) to NMP device "naa.600601608c121200f80d33192b62de11" failed on physical path "vmhba2:C0:T0:L5" H:0x0 D:0x2 P:0x0 Valid sense data: 0x2 0x4 0x3
This vmkernel.log entry is an example of an error occurring between ESXi and a storage device, which is noted by the Device Status 0x2. When the ESXi host receives the Check Condition status, it sends out a SCSI command 0x3 that equates to REQUEST SENSE to get the SCSI sense data from the device. The sense data is listed after “Valid sense data” and contains (Sense Key, Additional Sense Code, ASC Qualifier).
Isolate the SCSI event in the log file, and focus on the hexadecimal values to evaluate the error message:
Host Status = 0x0 = OK H:0x0
Device Status = 0x2 = Check Condition D:0x2
Plugin Status = 0x0 = No error P:0x0
Sense Key = 0x2 = NOT READY 0x2
Additional Sense Code/ASC Qualifier = 0x4/0x3 = LOGICAL UNIT NOT READY – MANUAL INTERVENTION REQUIRED 0x4 0x3
For more information on the Sense Keys, visit http://www.t10.org/lists/2sensekey.htm.
For more information on Additional Sense Code/ASC Qualifier pairings, see http://www.t10.org/lists/asc-num.txt.
Install and Configure vSphere ESXi Dump Collector
In addition to the Syslog Collector, another new service that was added in vSphere 5.0 is the ESXi Dump Collector. The vSphere Network Dump Collector service is a tool that can be used to collect diagnostic information from an ESXi host that experiences a system panic and generates a purple diagnostic screen. When the VMkernel crashes, the system goes into a fail-safe mode. You could think of it as driving your car at a high rate of speed and hitting a brick wall. Hopefully, your airbag will inflate and your seat belt will lock and save you from bodily injury. Unfortunately, the front of the car will not be saved, but the airbag and seat belt will at least save your life. When the VMkernel panic function begins, it is trying to save the rest of the kernel because something bad just happened on the system. It could be a bad kernel device driver, a bad system call, or an unexpected kernel setting or modification. The system panic is like a seat belt in a car—there is not much you can do about the front of the car or whatever system action started the panic process, but an attempt will be made to save as much of the kernel as possible from the kernel malfunction.
When the system panic starts, it takes the kernel pages of memory and dumps them to disk. When the ESXi host has a local hard drive, the panic routine utilizes it. If the ESXi host does not have an internal hard drive or is an auto-deployed ESXi host, it needs to send the diagnostic information to a Dump Collector. The Network Dump Collector can be configured in addition to or instead of the local hard disk being used to store the dump files. Thus, you need to install the vSphere Network Dump Collector to collect system panics over the network.
During a critical failure on an ESXi host, the panic routine begins and attempts to write a core dump using either or both the DiskDump (local disk) or NetDump (Dump Collector) mechanisms. The panic routine has a magic number at the beginning and end of the core dump and compresses the dump in case there is not enough space on the destination disk. If NetDump has been configured, the host opens a connection from a VMkernel network to the remote IP on UDP port 6500, and transmits a compressed core dump. By default, the NetDump protocol service is registered to the UDP port 6500. The Network Dump Collector service receives the System Dump and checks the magic numbers at the beginning and end to ensure it has all the necessary core dump information. Then the Dump Collector saves the compressed core dump to a file on its own disk in a zdump format. On the Dump Collector host, the zdump files are organized by the sending ESXi host’s IP address in a directory format and using the date and time of the Dump Collector Server. If the sending host’s IP address was 192.168.33.44, then the directory and file structure would be as follows:
C:ProgramDataVMwareVMware ESXi Dump CollectorData1921683344
zdump_192.168.33.44-yyyy-mm-dd-hh_mm-N
You can either install the ESXi Dump Collector on a Windows Server using the vCenter Server Installation media or configure the Dump Collector that is included with the vCenter Server Appliance.
vCenter Server Appliance and Dump Collector
The ESXi Dump Collector is bundled with the vCenter Server Appliance. As the VCSA server becomes the preferred choice for vCenter Server, it will be nice to have many of the tools already installed and just requiring configuration. Just like the Syslog Collector, the Dump Collector needs to be configured for it to function using the vCenter Server Appliance.
Note
The ESXi Dump Collector is installed and enabled by default on the vCenter Server Appliance. Thus, it just needs configuring on vCenter Server Appliance.
Here are the steps to configure Dump Collector on VCSA:
1. Log in to the vCenter Server Appliance.
2. Find the Services tab and click NetDump.
3. Type the port number in the Network Coredump Server Port text box.
4. Type the max size in MB in the Network Coredump Repository.
5. Click Test Settings to verify that the settings are valid.
6. Click Save Settings.
7. Restart ESXi Services.
Windows-based vCenter Server and the ESXi Dump Collector
If a Windows-based vCenter Server is used, the ESXi Dump Collector needs to be installed from the vCenter Server Installer, which is shown in Figure 7-15, just above the Syslog Collector option. After the central Network Dump Collector is installed, you will need to direct the ESXi hosts to use the Dump Collector for their system core dumps when a ESXi host encounters a critical failure.
Configure ESXi Dump Collector with esxcli
Use the esxcli command to set up an ESXi host to use the Network Dump Collector for their core dumps. You must specify the VMkernel NIC, IP address, and UDP port for the NetDump service on the Network Dump Collector host, like so:
esxcli system coredump network set –interface-name vmk0 –server-ipv4 192.1.2.3 –serverport 6500
Then, you enable ESXi Dump Collector:
esxcli system coredump network set –enable true
Summary
This module describes logging in vSphere. Although how logging works and is used in vSphere 5 has changed from previous vSphere versions, behind the scenes Syslog is still used and in general works in a similar fashion. There are a variety of methods to bundle the log files that can be sent to VMware support or used by the local system administrator for analysis. Of course, knowing where and what the log files are is helpful to the system administrator. After learning where to find the log files, the module discussed how to view the log files as well as how to change the settings for how Syslog is implemented in vSphere 5.x. Finally, the module finished with how to install and configure Syslog Collector and ESXi Dump Collector. Both tools can be used to help when issues arise in the vSphere environment.
Exam Preparation Tasks
Review All the Key Topics
Table 7-5 provides a list of all Key Topics identified in this chapter along with a few notes intended to refresh the reader’s memory of some key details. This can be useful as a quick reference when performing vSphere administration.
Table 7-5. Key Topics for Chapter 7
