
3. Reference Model
The ability of a service-oriented architecture solution to readily handle and support data based on a transient-only model of data is innate. The juxtaposition to supporting data in a transient mode is to support and manage data for persistence. Commercial businesses and government agencies continue to rely heavily on some form of persistence mechanism. Ultimately, any service-oriented solution must accommodate all forms of data, regardless of how the data is sustained in an information technology environment.
Despite the availability of both memory-resident databases and database compression engines, the need to persist data is driven by a number of factors, including an ever-increasing volume of business data, managing mixed formats of data (in terms of structured, semistructured, and unstructured data), dealing with spotty data access patterns, general perceptions of data volatility, and a basic desire for business continuity.
Although the use of data compression can reduce the overall data footprint—the amount of nonvolatile storage required to persist and manage raw data, indexes, and free space—the degree of spent energy to compress and decompress data can translate into undesirable latencies. Of course, any additional latency can sometimes be offset by a database management system processing larger blocks of data with each physical I/O. Also, using a technology that can process data in a compressed state obviously offers a distinct advantage over compression engines that must first decompress data before its use in an application program.
Compression ratios are often higher on character-based data, while financial-based data, being heavily numeric, may not compress as well. Depending on the characteristics of the business information to be processed, the degree of compression will vary. Some compression algorithms, such as JPEG, “involve some loss of information.”1 This means that during the decompression process some of the original data cannot be restored. Obviously, the vast majority of business data used in an enterprise cannot afford to apply techniques known to lose information.
Memory-resident databases offer a reasonable model of reuse and consistency when compared to traditional disk-based databases, but can have drawbacks in terms of data partitioning, footprint sizes, and potential recovery issues for actively changing data—especially, in a high-availability (failover) environment. Memory-resident databases as part of a transient layer may be best suited in conjunction with an overall data architecture that is backboned by a persistence layer to mitigate potential volatility or at least set up in a high-availability configuration where memory can be replicated based on completed units of work in a real-time manner.
While overall volumes of data are increasing, techniques such as asynchronous Web services, change data capture, message-oriented middleware, and enterprise architecture integration can be leveraged to help minimize needs for processing data in bulk (i.e., batched). Using change data capture mechanisms in conjunction with persisted data stores and service-enabled programs can afford the appearance of moving less data by moving data more frequently.
The burden on network traffic to move pseudo real-time2 data is often greater than data moved collectively as a single batch—although, depending on the speed of the network pipe, batch processes, and whether single threaded or processed in parallel, are more apt to cause some types of network bottlenecks. In a pseudo real-time environment, auxiliary services that perform consistency or integrity checks, along with subsequent business processing such as aggregation, may be required and can further add to the demands placed on the network’s bandwidth.
2. Pseudo real time involves movement latencies. Pseudo real time and near real time are comparable terms. Movement latencies are addressed later in this chapter.
Further consuming available bandwidth is the header and trailer information from the control information that surrounds the payload (business data). In the context of the network traffic and the business data, the control information is another type of metadata. In addition to the network metadata, other metadata may sometimes accompany the business data (adding to the consumption of network bandwidth). Metatags, found in Extensible Markup Language (XML) documents, provide a good example of metadata that is needed to accompany business data. Whereas a parsed XML document typically contains structured or semistructured information, the XML document represents unstructured data.
A fundamental difference between structured, semistructured, and unstructured data is in the application of metadata and the readiness of access to that metadata in reference to the potential values. To further understand the application of metadata across these forms of data (structured, semistructured, and unstructured data), each can be viewed in one of two ways for their harvested values:
• Structured data: Atomic or composite
• Semistructured data: Simple or complex
• Unstructured data: Deprived or rich
The collective metadata associated with structured data annotates a field, column, or a metatag. For example:
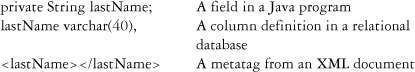
In all three of the preceding situations, the term lastName represents a single piece of metadata. This metadata, along with any additional descriptive metadata (such as a data type, a length, nullability options, a formal description, and so on) might all be associated with a given value, such as Joyce.
Whereas the term lastName, by itself, can be construed as being meaningful, supplementary metadata can prove extremely valuable to gain requisite insight into the meaning of this or any other term and can assist with interpreting each associated data value (i.e., distinguishing or affirming Joyce as a last name versus that of a first name).
In the case of structured data, the metadata for the term associated with the value Joyce is regarded as atomic; here, Joyce cannot be further decomposed without losing business meaning.3 Conversely, a date such as May 4, 1939,4 if stored in a structured field called publicationDate, is regarded as composite.
3. Joyce can be decomposed into each syllable or each letter, but having each syllable or letter as a separate fact may be perceived as having little business value.
4. May 4, 1939, is the publication date of the James Joyce novel Finnegans Wake. See Spielberg (1962).
In the case of publicationDate, the date contains at least three separate facts: a month, a day, and a year; the actual day of the week could be an additional fact. In addition, the fact that publicationDate is based on the Gregorian would have to be known. (Other date types could be ordinal date, Julian date, Hebrew date, or Holocene date. Furthermore, the Gregorian date could be expressed in a multitude of formats in additional to month-day-year, such as day-month-year and year-month-day.) Another example of a composite field is the U.S. Social Security Number, for which the first three digits represent the state of issuance.
Semistructured data is typically composite in nature, but does not have to be. Examples of semistructured fields include personName, mailingAddress, and manufacturedPart. A value associated with the term personName might be James Joyce. Here, the personName includes, presumably in this order, a first name and a last name. personName is considered simple because the value directly correlates to the term in a business and information technology sense.
A mailing address, such as 41 Brighton Square West, Rathgar, Dublin,5 lies between simple and complex. This particular address consists of a street number, a street name, a street type, a post-directional street name direction, a suburb, and a city name. Other facts such as a predirectional street name direction, a postal code, a county name, and a country name could also exist in some cases.
5. James Joyce was born at 41 Brighton Square West, Rathgar, Dublin, Ireland. See Joyce (2000).
In the following example, the term manufacturedPart is considered complex. The following distinct values for the term manufacturedPart are intended to be semantically equivalent:
• WING ASSY DRILL 5 HOLE USE 5J161A HEXBOLT 1/4 INCH
• WING ASSEMBY, USE 5J161-A HEX BOLT .25″ – DRILL FIVE HOLES
• USE 5 5J161A BOLTS (HEX .25) – DRILL HOLES FOR EA ON WING ASSEM
Here, the semistructured data reveals four separate and unordered types of facts that constitute the primary reason for this semistructured example being classified as complex. The four separate types of facts include an instruction, a part number, a part type, and a part size:
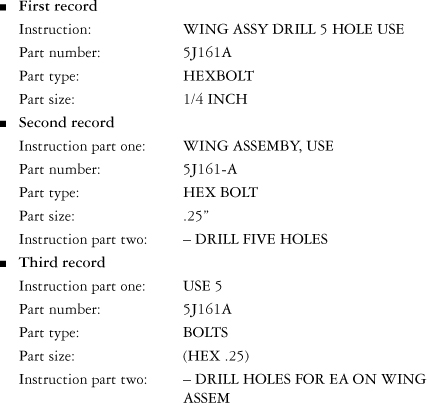
In addition to the four fact types, the instruction is split (a noncontiguous instruction) in the second and third records. Across each of the three examples, the instructions include abbreviations and typographical errors. Nevertheless, the need for five bolts is implicit in records one and two. Also noticeable is the fact that the part numbers are expressed inconsistently and, likewise, the part sizes too. Again, this type of semistructured data is deemed complex because of the convolution in identifying the embedded atomic components and deciphering what facts are explicit and what other facts may be implicit.
The third form, unstructured data, is governed by the richness and accessibility of metadata associated with its unstructured content. A movie in MPEG format would be regarded as unstructured data, and yet the richness of its metadata enables any player that can interpret the metadata to ultimately show the movie. However, the richness of that metadata falls short in providing other capabilities (e.g., provisioning the metadata to find a certain scene from a library of different movies). With the existing metadata, for example, it may be impossible to identify a scene in which a marionette-style puppet hears Big Ben strike 13 times.6
6. Such as episode three, Big Ben Strikes Again, from the British television series Captain Scarlet and the Mysterons. Captain Scarlet—The Complete Series (1967), DVD.
Conversely, in a text-oriented unstructured document, determining whether the content is about the author James Joyce or was written by James Joyce can also present a challenge. Ascertaining context and the ability to extract pertinent facts is made all the more easy if the document is shrouded throughout with useful and accessible metadata—rich metadata. As previously mentioned, XML documents tend to be rich in metadata.
The capacity by which business data can be harnessed from each of these forms (structured, semistructured, and unstructured) is a direct corollary to the types, degrees, and accessibility of metadata associated with the values. An absence of metadata or even the lack of upkeep in the quality of the metadata can easily and immediately disable any service or solution—or to use a term coined by Joyce (1882–1941) in his novel Finnegans Wake that happened to indicate a sudden demise, “bababadalgharaghtakamminarronnkonnbronntonnerronntuonnthunntrovarrhounawnskawntoohoohoordenenthurnuk.”
Structured, semistructured, and unstructured data are all potentially subject to spotty data access. Spotty data access infers the use of disparate subsets of values within a data store, conceivably caused by the varying degrees of usefulness applied to the life span of each type of data.
Sometimes, the useful life span of a piece of data can be measured in seconds, but if that data is persisted, the value can linger beyond its usefulness. The life span of other data could have intermittent, but necessary usage. For example, during an accounting period, some data can possess qualities for considerable longevity and can be consistently used year after year. Spotty data access results in less-used data intermingled with frequently accessed data.
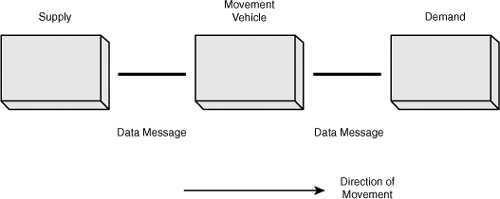
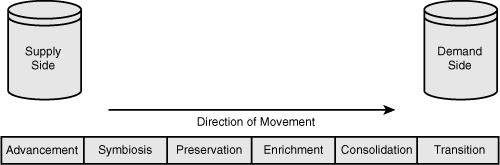
Inevitably, a service-oriented architecture has to support the movement of transient and persistent data across different forms with different worth (perceived or real business value) and different life spans. Data movement may be for controlled duplicity, enrichment following the lines of the corporate value chain, or controlled consolidation. Movement can occur for a number of other reasons, too, such as ensuring business continuity, but in all cases a primitive pattern emerges that includes a supply side, a demand side, and a vehicle by which movement can be controlled (see Figure 3-1).
Figure 3-1 Basic pattern of data movement using a supply and demand paradigm.
The model shown in Figure 3-1 is a basic pattern of data movement that follows the Shannon-Weaver communication model, which was originally published in 1948 by Claude Shannon (1916–2001) and Warren Weaver (1894–1978); see Figure 3-2. Their communication model sought to address issues of communication on three levels:7
• From a technical aspect: The model is concerned about the accuracy in which the symbols of communication are transmitted.
• From a semantic aspect: The model is concerned about the precision to which the transmitted symbols convey the desired meaning.
• From an effectiveness aspect: The model is concerned about the success by which the received meaning affects conduct in a desirable way.
Figure 3-2 Shannon-Weaver communication model.
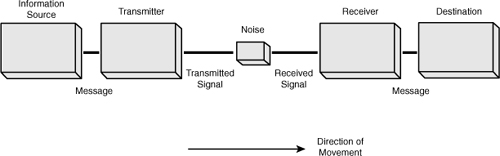
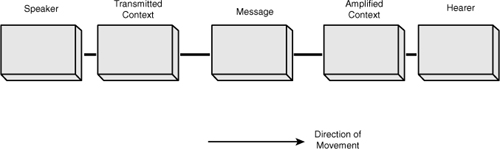
In the model, the presence of noise is to accommodate any environmental effects that may impede and distort the message being communicated. If the model is reorganized to reflect two people in conversation (see Figure 3-3), the success of the communication is based on eradicating any noise that may undermine a common understanding and a shared semantic of the message.
Figure 3-3 Generalized person-to-person communication model.
Referring back to the illustration shown in Figure 3-1: Misunder-standings in data movement can occur when insufficient effort is expended on correlating the contexts of what can be transmitted with the contexts of what is expected to be received. Thus, any simple misunderstanding can lead to the creation, transmittal, and ultimately the persistence of viral data. This problem could be attributable to the business data or the metadata associated with the business data or both.
At the end of the day, there is a line between trustworthy information and viral data, and that line is very fine. Analogically, performance artist Laurie Anderson (b. 1947) has recited in her concerts that while nobody wants to be a zero and everybody wants to be number one, these numbers are so close that it leaves little room for anything else.8
In a conversation between the speaker and the hearer, the speaker often has an opportunity to test whether the message has been received and understood—that the communication has been isomorphic. This also applies to the hearer, who in a like manner may have the opportunity to test for comprehension before any action is taken.
When introducing some form of a feedback or confirmation mechanism, the model shown in Figure 3-3 takes on a circular pattern rather than a linear pattern. With data movement, the vast majority of all communication tends to be synchronous. Unfortunately, the closest many applications get to participating asynchronously is in terms of receipt (including two-phase commits and logical units of work) and not in terms of understanding.
The pattern that emerges from these models is that they share an active interconnection to process the message. In a service-oriented solution, inherent environmental considerations such as network latency, quantity of data, and type of data (structured, semistructured, and unstructured) can fundamentally drive important architectural subtleties—especially in terms of how given payloads (business data) are transported or landed to the demand-side or target layer.
Even though these patterns may appear relatively simple, any software architecture absent of even a primitive a priori for applying a paint-by-number approach to cutting code is apt to be troublesome and is therefore a likely candidate to contribute to the systemic nature of viral data. Characteristically, successful software architectures result from design principles embodied in a pattern and the judicious weighing of alternatives to determine a pragmatic direction based on current and forward-looking endeavors.
The traditional approach to building an application has been to craft a given solution to accommodate a current need, focusing on an alignment with the business. However, an appropriate dogma is one that reviews current needs in light of prior needs, but that is coupled with the anticipation or (in the best case scenario) insight about potential future proclivity and directions.
In the context of moving data between persistent data stores in a service-oriented architecture—regardless of how long any message may exist in a transient state—the rationale for moving data forms a clear aspect. Here, ASPECT becomes an acronym to assist in understanding the process in which data moves (see Figure 3-4). Identifying the core need to move data can help ascertain any augmentation to the models that have been previously discussed in this chapter.
Figure 3-4 ASPECT reasons for data movement.
The acronym ASPECT stands for:

When used in the context of a supply and demand paradigm, ASPECT helps practitioners orientate lower-level design patterns within the reference model:
• Advancement: Used for moving data as part of a changing information technology landscape, such as an application migration. Solutions for advancement may be used just once and then discarded. Therefore, the use of this pattern may result in solutions being hard-coded or tightly aligned with the current need. Advancement solutions are typically perceived in terms of a temporary or limited-use (in terms of time) solution.
• Symbiosis: Used for moving data across the data architecture, often in support of secondary or tertiary solutions within a value chain. Whereas some solutions strive to achieve a single view of data, most organizations require data to be duplicated for one reason or another.
Duplication or sharing can be done in a controlled or haphazard manner. Controlled sharing is when duplicity is by intent (by design), and uncontrolled is often manifested by arbitrary decision making. Paradoxically, uncontrolled replication often results because a manager wants control (exclusive control) of the data values.
• Preservation: Used in moving data to protect or safeguard the state of the data for purposes such as privacy, audit, financial reporting, legal retention, and history. Preserved data is less likely to be involved in any further manipulation of data value. Any change to a data value should be controlled through some type of adjustment so that data augmentation can be appropriately managed—whereby the data provenance supports a full change history.
• Enrichment: Used in moving data to add other qualities such as derived and aggregated values. Enrichment is dissimilar to preservation in that the intent is to modify data values. Enrichment is also dissimilar to sharing in that enrichment often keeps an association with its source, whereas sharing does not.
• Consolidation: Used in pulling data from two or more disparate sources to establish a consistent or preferred reference point as the result of movement. Consolidation can help craft a single view of data or possibly a single version of the truth. Consolidation is often seen as a way to mitigate viral data and produce a trusted reference point.
• Transition: Used in moving data as part of an orchestration, especially in support of a subsequent part of a value chain. Transitions are helpful patterns for composite services that interchange messages while incrementally shaping a final record that requires an action or persistence.
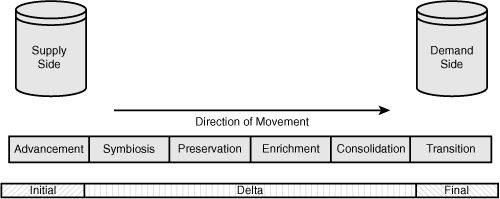
Each ASPECT can be further exercised in the context of an initial seeding, a delta move, or a final move. These types can be very important if there is a need to understand any aspect of the nature of data that may already exist in the demand-side portion of the reference model.
An initial seeding implies that the demand side is empty. A delta move presupposes that something already exists on the demand side and that that data should be taken into account if any frequency, matching, or survivorship rules need to be actioned. Final moves may require additional reconciliation rules or synchronous acknowledgment with the supply side.
Because moving data obviously involves transporting and landing data in the target, the term landing can be used to help create a mental model of the flight. Applying a flight analogy to the supply and demand movement paradigm, we can express opportunities to deal with viral data in terms preflight, in-flight, and post flight activities. These flight activities can be aligned to the pattern in Figure 3-5 and form a flight path:
• Preflight maps to the source (supply side).
• In-flight maps to the movement vehicle.
• Post flight maps to the target (demand side).
Figure 3-5 Seeding the demand side.
In the context of stemming viral data and actively trying to create and preserve trusted information, the following questions can be asked regarding the flight path:
• What can be done to prepare the data prior to any movement?
• What can be done to ensure the transformation of data during movement?
• What can be done to sustain the condition the data after movement has concluded?
Early flight patterns went by the acronym ETL (extract, transform, and load). In the flight path just described, the pattern becomes one of TETLT (transform, extract, transform, load, and transform). The model in Figure 3-6 can be applied to persistent and transient data in a service in batch or in real time.
Figure 3-6 The flight-path model.
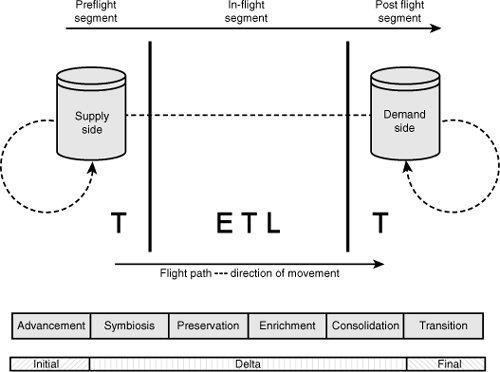
In a traditional ETL approach to moving data, the data is first extracted from the supply side, then transformed, and finally placed in the demand-side target. If the flight-path approach is followed, data is likely to be transformed throughout the flight path. This pragmatic approach recognizes that during the flight path, performing certain transformations on the source prior to the ETL can be beneficial and so, too, some transformations on the target after the ETL is complete (resulting in a TETLT pattern).
TETLT supports the notion that data can be transformed as part of a set of preflight activities and as part of a set of post flight activities. In addition, the application of upper and lowercase Ts can indicate minor or major transformation work over the flight path. For example:
• tEtLt
This pattern indicates that a given solution performs minor transformations at each segment of the flight path.
This pattern indicates that a given solution performs major transformations during the preflight and post flight segments, and minor transformations are performed on in-flight data.
• tEtLtT
This pattern indicates that a given solution performs only minor transformations until the post flight segments, when a major set of transformations takes place.
If a solution does not require a set of transformations on the data during one or more segments of the flight path, a lowercase T with a strikethrough (t) can be used to indicate no action is being taken to remediate the data in any form. Although T could be used, the connotation implied by using T would not make sense.
• tEtLt
This pattern indicates that a given solution does not perform any transformations until the post flight segment, when only minor transformations are performed.
As a downside, the distinction between a minor and a major transformation may be subjective, but whatever the watermark, the same standard should apply from solution to solution. As a starting point for classifying transformations, a minor transformation can be one that deals with changing data types, filtering, standardization, aggregation, and derivation (of interpolated values). A major transformation would be one that involves error correction, match/merge, and derivation (for handling extrapolated values).
In complex situations, the in-flight segment may require more than one in-flight segment. In such cases, the flight-path pattern is used recursively. For this reason, the overall pattern is scalable and accommodates varying degrees of flight-path complexities. Modeling or designing scalability for the in-flight segment can done by leveraging techniques similar to those used when performing process decomposition (see Figure 3-7).
Figure 3-7 In-flight pattern recursion.
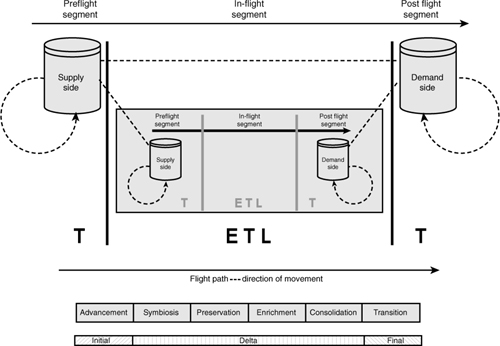
To assist in determining the types of transformation activities that need to be accommodated throughout the flight path, notions of a data quality assessment (DQA) can also be exercised. Across the flight path, these assessments are expressed as a DQA3 Within the acronym, each A takes on a specific meaning when mapped to a specific portion of the flight path (see Figure 3-8).
Figure 3-8 DQA3—analysis, accuracy, and appraisal.
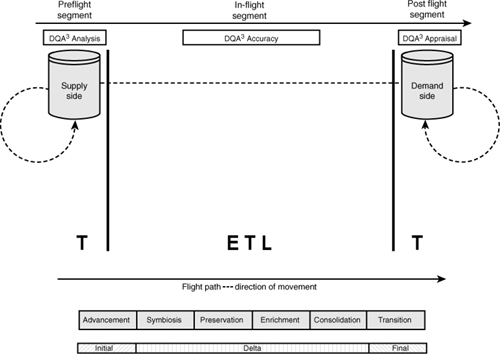
Assessments establish a basis for understanding and in turn enable the communication of a condition. The activities for assessing data in a preflight state can be viewed in terms of wanting or needing to understand and are therefore collectively termed data quality analysis—the A in DQA3 is replaced by the word analysis. Activities for assessing data in an in-flight state can be viewed in terms of mastery and are known collectively as data quality accuracy. Likewise, activities for assessing data in a post flight state can be viewed in terms of valuation and are known collectively as data quality appraisal.
Analysis, accuracy, and appraisal form a comprehensive focus for each of the primary segments in the flight path when performing a DQA or data quality assessment. Evaluating the condition and the type of conditioning the data might need in terms of the data’s location against the flight path can be used to form a primary vantage for treating viral data within a service-oriented architecture.
Analysis helps quantify what exists and contributes to establishing the universe of discourse in terms of what an enterprise can know. In general, whereas values for a target can be derived or aggregated during movement, new facts cannot be materialized without some basis of fact from the source—viral data aside. When compared to the person-to-person communication model, data quality analysis can equate to the phrase think before you speak.
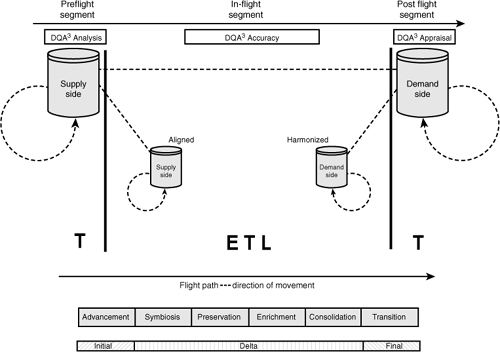
Accuracy is used to gauge the condition of data during transference from the preflight supply-side source before the data lands in the post flight demand-side target. During the in-flight segment, data is potentially aligned and harmonized9 as it is prepared to be accepted into the target (see Figure 3-9). In-flight is the mediation to help ensure isometric transference. Data quality accuracy equates to demonstrated learning.
9. Within the context of moving data across the flight path, aligned means that data is consistent in terms of the representations and meanings from the aspect of the supply (the preflight segment), and harmonized means that data is consistent in terms of the representations and meanings from the aspect of the demand side (the post-flight segment).
For example, if gender values within a preflight supply were a mixture of lowercase and uppercase Ms and Fs, alignment would mean that in the in-flight segment, the data values were transformed to a single case of Ms and Fs. Harmonization would mean that the data was transformed to the values consistent with those desired in the post-flight demand-side target. In the case of gender, that might be zero and one.
Figure 3-9 In-flight alignment and harmonization.
Appraisal forms a foundation for valuing and evaluating the truthfulness in data—which leads to objectivity and not subjectivity, proving the data’s trustworthiness. Over time, trusted information can turn viral through the propensity for certain types of information to decay or in how services are augmented as business needs change. A data quality appraisal equates to the protection and certification of a tangible asset.
With respect to the flight-path paradigm, a physical data store can participate as both a source and a target at the same time. Therefore, data may be required to simultaneously participate in all parts of flight path at the same time: preflight, in-flight, and post flight segments. From takeoff to landing, data needs to available for evaluation and managed so that exchanges are always in context.
Motivation for performing an assessment is based on the CIDER model, an important part of the DQA3 process. CIDER is used in combination with the DQA3 to help provide context for data conditioning. Therefore, any analysis of data is not performed for the sake of analysis, but for a given and understood purpose (much in the same way that data is moved with the understanding of the ASPECT).
Just as certain data has higher intrinsic worth to an enterprise, so too does the type of work that one conducts involving data quality. That is, some work efforts involving data quality should be performed with more diligence or frequency than others.
CIDER is an acronym for:

The meaning of each letter of the acronym is as follows:
• Construction
DQA3 output is organized to assist with the requirements, analysis, and design of a brand new system. The new system could require a one-time feed or an ongoing feed. The new system could be custom built or off the shelf.
• Improvement
DQA3 output is organized to assist in the changing of data for purposes of standardization and cleansing. The changes may be applied through a system or a formal data steward and so on.
DQA3 output is organized to assist in the understanding of what data values, structures, and metadata are present. Discovery processes might be used for such activities as inventorying data assets, identifying a gold source, or uncovering a system of record.
• Enlightenment
DQA3 output is organized to assist in the reporting, scorecarding, or trending of quality levels.
• Remediation
DQA3 output is organized to assist in the requirements, analysis, and design of an existing system. Generally, the remediation will be in the form of refining business rules or other constraint mechanisms that assist in better control on data captured and manipulated.
Any approach that is used toward the improvement of an organization’s data quality must include an understanding of which CIDER aspects can be leveraged to help state the goals and objectives for a particular data quality initiative. Multiple aspects of CIDER can be used as a driving influence behind a data quality assessment.
The principles for performing an assessment under CIDER follow a common workflow. The workflow is known as SÉANCE and contains the following elements:
Each step of the workflow is done in accordance with the DQA3 and CIDER. The workflow applies to manual work on data quality as well as automated work on data quality—which means that the workflow can be incorporated into each ASPECT.
The initial step of the workflow is scope. The purpose of scope is to formally define the purpose of the data quality work effort and to publish the goals and objectives for the initiative. A formalized scope implies that any data quality management initiative is planned, not arbitrary or random. By necessity, many DQA3 efforts are time-boxed and the duration, number of resources, and breadth of reach need to be clearly identified as part of the scope.
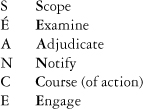
In the milieu of discovery—the D part of CIDER—the actual data stores (whether persistent or transient in nature) requiring observation may not be known during the scope definition process. However, DQA3 can be used iteratively to ascertain a proper set of useful data stores. Determining usefulness can be an expedited means to examine, adjudicate, notify, dictate a course of action, and engage:
• Examine: This is what we can see.
• Adjudicate: This is what we have determined or concluded.
• Notify: This is what we have communicated.
• Course: This is what we will do.
• Engage: This is what we have done: Yes, the data store is appropriate; no, the data store is inappropriate.
The examination step is used to gather data and metrics that can be readily observed about data in the data store. Observations can be performed in context and out of context. The inference of in context means that data is prepared in a manner that allows for a series of observations to be taken and, later on, judgments to be formed around a specific scenario. Although observations and judgments can equally be formed on out-of-context data, the observed and judged data is not specially prepared. Out-of-context data can be all the rows in a table, an arbitrary subset (i.e., the first 10,000 records), or a random sample.
As an example, if a persistent data store named PARTY were to be examined, the observations would certainly be in the context of the data store, but from the standpoint of analysis, the examination is out of context because PARTY can contain new data, old data, clean data, dirty data, complete transactions, incomplete transactions, and so on.
The reason to perform an analysis in context is to help define a set of judgments based on a given scenario. Accordingly, creating a context of data that contains data from only the last three months may readily allow for a series of judgments on the current level of data quality.
Using a scenario-based analysis while establishing a context helps place a story around the contextual preparation of data. A story (a metaphor, allegory, or business situation) is a descriptive means by which a starting point can be effortlessly communicated. An example of a story might be to examine and judge all active data (separating out all inactive data). Even this type of a simple scenario can be time-consuming to prepare (see Figures 3-10 through 3-16).
The following figures represent a snapshot of data taken from a system in which the data starts out in a centralized system. Therefore, the data is distributed through a series of enrichment services to a set of geographically based post fight demand-side targets. At each post flight location, additional data is appended and then independently managed. In this case, the rationale for analyzing the disparate data is the first step to re-collecting the geographic nuances into a centrally managed master data environment.
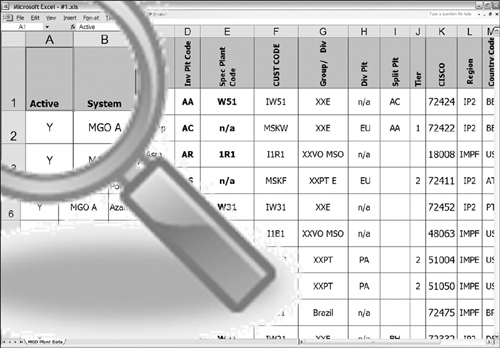
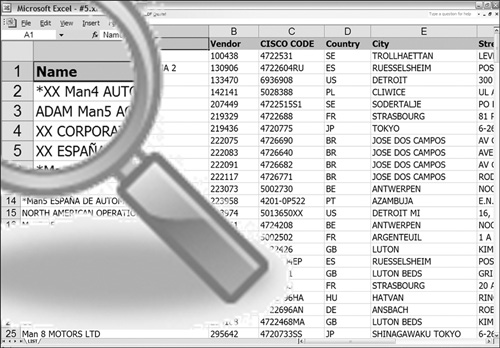
In Figure 3-10, active data appears in the ACTIVE column. Each active row contains a Y. Inactive rows are denoted by N.
Figure 3-10 Active scenario 1.
In Figure 3-11, active data appears in the INACTIVE column. Each active row contains an N, and inactive rows are denoted by Y. A potential point of confusion lies between the snapshots shown in these two figures (Figures 3-10 and 3-11). The column names, ACTIVE and INACTIVE, are antonyms for illustrating a common business concept. Further confusing is the fact that the antonyms share domain values—Y and N.
Figure 3-11 Active scenario 2.
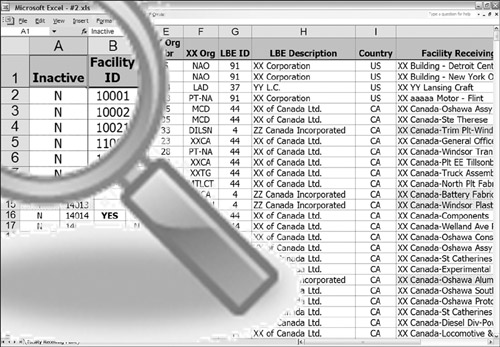
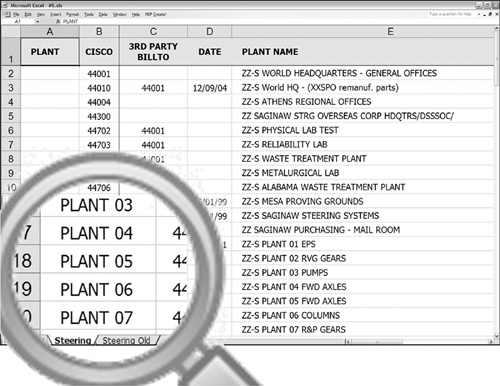
Figure 3-12 is similar in nature to Figure 3-11. However, this time, the column name is a synonym. CISCO_INACTIVE_IND is identical in meaning to INACTIVE and contains the same domain values.
Figure 3-12 Active scenario 3.
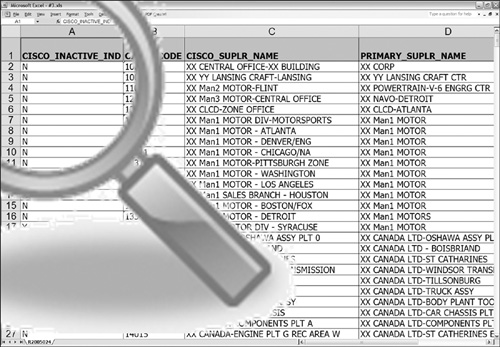
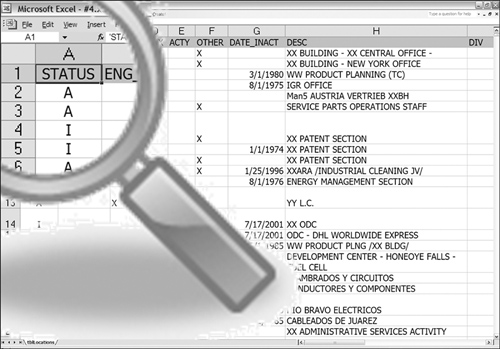
Figure 3-13 illustrates a homonym. In this case, the column STATUS is equivalent to both columns ACTIVE and INACTIVE. This type of situation can sometimes prove confusing as the homonym is against two terms that are antonyms to each other. In the case of STATUS, A implies that a row is active, and I implies a row is inactive.
Figure 3-13 Active scenario 4.
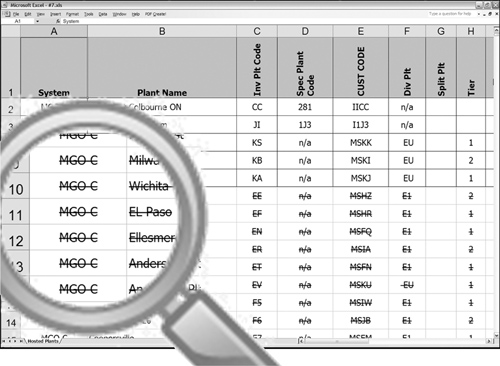
Active rows in Figure 3-14 are conveyed by overloading an existing column. In this figure, when the NAME column is prefixed with an asterisk, the row is deemed to be inactive. An absence of an asterisk implies active data. When the absence of data is used to convey meaning, a window is opened as a way to introduce viral data. When overloading data, semistructured data is typically the result. Therefore, additional metadata should be prepared to explain how to interpret the data value.
Figure 3-14 Active scenario 5.
Each of these geographically disperse data stores are managed in Microsoft Excel®. In the case of Figure 3-15, active data and inactive data are maintained in two separate worksheets. This means that in addition to the metadata for each column, each worksheet and the workbook should have representative metadata.
Figure 3-15 Active scenario 6.
In Figure 3-16, inactive data is shown by metadata on the font. A strikethrough on each character signifies inactive data, and an absence of a strikethrough denotes active data. Depending on the method used to consume the worksheet data in this figure, the metadata can be lost, resulting in misinterpreting each row. For example, if the data is subsequently saved in a comma-separated value format, any metadata attached to each character (font type, font size, font style, font effect, and so on) would be dropped.
Figure 3-16 Active scenario 7.
When choosing to perform a scenario-based analysis, staging data can prove a useful first step in performing an assessment. The staging area can be used to create a stable environment to view data over time. In addition, a staging area can be used as a means to avoid complex joins by creating a single view or can be used to precalculate some data values. The model demonstrates how the staging area becomes part of the supply-side data.
The staging area can be further complemented by the use of an SQL view or a service to provide a contextual perspective (a use case scenario). The scenario can be used to provide a business context by leveraging the equivalents to an inner or outer join, a union, a subselect, or by manifesting a subset of rows, aggregating data, or deriving a set of data values.
Whether using a data store in a staging area or in its native environment, examinations can be performed on different levels of aggregation—from summary through to the atomic details with the appropriate measures (counts).
Within the scope and what can be gleaned from the examination, the observed results can be adjudicated. Judgments can be made as to what is perceived suitable and what is perceived to be unacceptable—as well as what is definitely suitable and definitely unacceptable. Judgments can be performed as part of a manual or automated effort.
Judgment may require additional input from multiple communities or individuals within the organization, such as subject matter experts and data stewards within the phylarchies, heterarchies, panarchies, and autarchies that exist within the organization. The findings of the judgment should be organized in a report. Typically, the report is a formal document, but the judgment could as easily be manifested as another data store or even verbally.
The method used to communicate a judgment can often be based on the business value associated with the data. The greater the worth, the more likely the means of communication should be formal and the message reproduced. As previously stated, not all data is of equal worth, and therefore, the formality of documentation can vary too.
A formal report can be organized to convey, or notify, to others what was examined and the outcomes of any judgments as well indicate those who participated in the adjudicating. In addition, any other supporting documentation that complements the judgments should be elicited so that the communication is holistic. An outcome from the report is a planned course of action. Obviously, the size of the plan may vary from recommending a quick tweak to instantiating a larger project initiative.
After the judgment report has been communicated, an appropriate course of action can be formulated. Documenting the course of action may be brief or detailed depending on the type of next steps that are deemed as necessary. The spectrum of work defined in a course of action can span from a negligible amount of work effort to a full-blown project or program.
A defined course of action, depending on the scope, may need further approval before any action can be taken. Once go ahead for a course is given—whether formally or informally—the next step is to engage the plan and carry out the prescribed actions. The duration and complexity involved in the engagement can vary depending on need. The engagement follows the recommendations outlined within the defined course and can involve data conditioning on data, metadata, data structures, and services.
In many cases, a SÉANCE can be used as part of a closed-loop process whereby the engagement becomes the genesis for invoking a new scoping exercise that in turn leads to a new examination and so on. Closed-loop processes can complement any type of data governance program and are an important way to preempt viral data and to preserve trusted information.
A data quality assessment is most successful when performed in association with CIDER. As stated, CIDER furnishes the context of why the assessment is being performed and can help focus the data quality effort. The assessment may involve several different areas, such as the data model, the business data, all the different types of metadata, and on one or more segments of the flight path.
With CIDER, judging data in terms of its preflight segment or in terms of its post flight segment can contribute with in-flight preparations in terms of data or metadata being aligned and harmonized. Alignment and harmonization address consistency and presentation and, like most of the elements in the reference model, are scalable concepts that can be applied in different situations.
As an example of scale, alignment may be applied to a column, a row, a table, a subject area, a database, or any area of the data landscape. Harmonization may apply to multiple columns, multiple rows, multiple tables, multiple subject areas, multiple databases, or multiple areas of the data landscape. Therefore, alignment typically applies to a collective single of something, whereas harmonization applies to the collective multiple of something.
In the case of Figures 3-10 through 3-16, alignment would be used to make sure:
• Each single worksheet consistently portrays active or inactive in a single way, or
• The single concept of active and inactive, across each worksheet, is portrayed in a consistent manner.
Harmonization would be used to make sure:
• The methods for portraying active and inactive data across the multiple worksheets are readied in a consistent manner for incorporation into a demand-side data store.
In addition, alignment can be used in the context of correctness from the viewpoint of a data source (data in a preflight segment), and harmonization can be used in the context of correctness from the viewpoint of a data target (data in a post flight segment).
To illustrate these concepts, a column named STATUS_CD can be used. CD is an abbreviation for the word code. For STATUS_CD to be considered aligned, each of the following criteria must be considered true:
• All the data values in this one column across all the rows are known.
• All the data values contain a common representation.
• All the data values are without overlap or ambiguity.
Harmonization can be viewed by introducing a second table that also contains a column to accommodate status codes. If the status codes in this second table are also considered to be aligned, the data values from the two columns from two different tables can be considered to be harmonized if each of the following criteria is recognized to be true:
• The data values from the two columns are semantic equivalents.
• The data values from the two columns contain valid values.
• The data values from the two columns share common representations.
• The data values from the two columns are without overlap or ambiguity.
• The data values from the two columns are in a form suitable for a postflight10 environment.
10. Preflight and postflight data stores can refer to different data stores or even the same data store.
When addressing scalability, a database (all the values in each table and each column) can be aligned and subsequently, in a comparison to another database that is also in alignment, can be deemed harmonized if the superset of all values are obsequious.
Aligned data is data that has been conditioned (understood, standardized, and cleansed) in the context of a singularity. Harmonized data is conditioned data that is consistent across multiple singularities and is within the context of the demand-side post flight segment. As part of the data conditioning process, applying some form of matching, merging, and survivorship into the process can assist with the improvement or sustainment of the data’s quality.
Matching typically involves a deterministic comparison of two or more data values, such as A=B. However, when appropriate, matching can be enhanced when used in conjunction with a probabilistic comparison such that A=B. When applying similar or approximate forms for purposes of comparison, the challenge is to limit the number of false positives and the number of false negatives.
False positives represent successful outcomes of probabilistic matching that with hindsight or other due diligence are found to have been falsely or inadvertently matched. False negatives represent the inverse situation—matches that have failed to find a partner record that with hindsight or other due diligence should have been successfully matched to another record. Between affirming a match or a mismatch lies a potential area of uncertainty (see Figure 3-17).
Figure 3-17 Area of uncertainty: The gray area of matching.
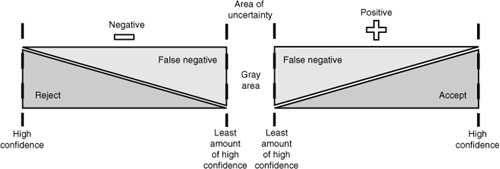
To effectively manage the spectrum of decisioning and the gray area, thresholds should be established to:
• Minimize the area of uncertainty
• Minimize the potential for realizing false positive matches
• Minimize the potential for realizing false negative matches
• Accentuate the certainty of positive matches
• Accentuate the certainty of negative matches
Establishing rules for cutoff points in matching typically requires performing a data quality assessment on historical data followed by continual assessment cycles on current data in order to apply any fine-tuning that may prove necessary.
More often than not, an area of uncertainty is encountered with probabilistic matching techniques. Probabilistic matching normally involves some type of scoring—although some types of deterministic matching can also be associated with scoring. The uncertainty is caused by an inability to assert with confidence a match or a mismatch based on the scored result.
Any data falling into the area of uncertainty typically requires some form of manual intervention to promote a final match determination (either to confirm or disaffirm the match). As a result, minimizing or even eliminating the area of uncertainty is very important from the aspect of productivity to the organization. An organization cannot expect to be successful if hundreds, thousands, or millions of records fall into a manual reconciliation area.
An activity in the reference model that may follow the activity of matching is a merging data activity. Merging is the pulling together of complementary or incongruent information. Merging accumulates a superset of contextual data either in terms of columns or rows (but the topic of survivorship can be a lot more complex). In the flow of matching, merging, and surviving, survivorship represents a definitive set of business values. What is survived can be the superset from merging, but the survived data can also be the result of a whittling process to derive a subset from a merged superset.
Considerations for surviving data include the following:
• Surviving in the context of time: Incorporating matched, merged, and survived data frequencies from previous data conditioning efforts.
• Establishing priorities for truth in data: Failure to consider common data values from different sources with the same degree of representative truthfulness. For example, if you get two different consumer addresses from two different sources and you need to survive just one, which one do you consume?
• Providing sufficient auditable information for traceability: Survived facts can be composed of data originating from multiple records. Each survived fact should be traceable back to its origin.
Using the reference model along with elements of data governance a process can begin whereby an assessment of damage caused by viral data can begin.
Figure 3-18 represents the complete reference model.
Figure 3-18 Complete reference model.
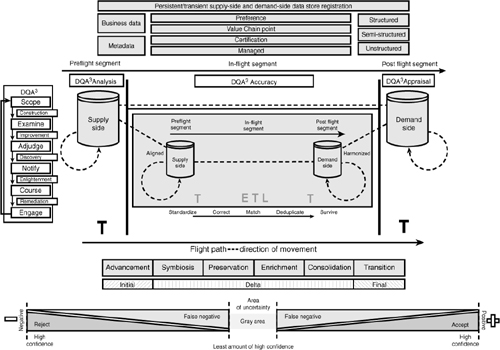
As in the case of the Shannon-Weaver communication model, this reference model also illustrates the transmission (movement) of information from three aspects:
• From a technical aspect: The model highlights the need for concern about the accuracy to which the values of data are moved.
• From a semantic aspect: The model highlights the need for concern about the precision to which the moved data conveys the desired meaning.
• From an effectiveness aspect: The model highlights the need for concern about the success by which the received data affects conduct in a desirable way.
An understanding of the reference model serves as the basic foundation to start fully assessing the transient and persistent business data of an organization.