
Chapter 8
System mechanisms
The Windows operating system provides several base mechanisms that kernel-mode components such as the executive, the kernel, and device drivers use. This chapter explains the following system mechanisms and describes how they are used:
■ Processor execution model, including ring levels, segmentation, task states, trap dispatching, including interrupts, deferred procedure calls (DPCs), asynchronous procedure calls (APCs), timers, system worker threads, exception dispatching, and system service dispatching
■ Speculative execution barriers and other software-side channel mitigations
■ The executive Object Manager
■ Synchronization, including spinlocks, kernel dispatcher objects, wait dispatching, and user-mode-specific synchronization primitives such as address-based waits, conditional variables, and slim reader-writer (SRW) locks
■ Advanced Local Procedure Call (ALPC) subsystem
■ Windows Notification Facility (WNF)
■ WoW64
■ User-mode debugging framework
Additionally, this chapter also includes detailed information on the Universal Windows Platform (UWP) and the set of user-mode and kernel-mode services that power it, such as the following:
■ Packaged Applications and the AppX Deployment Service
■ Centennial Applications and the Windows Desktop Bridge
■ Process State Management (PSM) and the Process Lifetime Manager (PLM)
■ Host Activity Moderator (HAM) and Background Activity Moderator (BAM)
Processor execution model
This section takes a deep look at the internal mechanics of Intel i386–based processor architecture and its extension, the AMD64-based architecture used on modern systems. Although the two respective companies first came up with these designs, it’s worth noting that both vendors now implement each other’s designs, so although you may still see these suffixes attached to Windows files and registry keys, the terms x86 (32-bit) and x64 (64-bit) are more common in today’s usage.
We discuss concepts such as segmentation, tasks, and ring levels, which are critical mechanisms, and we discuss the concept of traps, interrupts, and system calls.
Segmentation
High-level programming languages such as C/C++ and Rust are compiled down to machine-level code, often called assembler or assembly code. In this low-level language, processor registers are accessed directly, and there are often three primary types of registers that programs access (which are visible when debugging code):
■ The Program Counter (PC), which in x86/x64 architecture is called the Instruction Pointer (IP) and is represented by the EIP (x86) and RIP (x64) register. This register always points to the line of assembly code that is executing (except for certain 32-bit ARM architectures).
■ The Stack Pointer (SP), which is represented by the ESP (x86) and RSP (x64) register. This register points to the location in memory that is holding the current stack location.
■ Other General Purpose Registers (GPRs) include registers such as EAX/RAX, ECX/RCX, EDX/RDX, ESI/RSI and R8, R14, just to name a few examples.
Although these registers can contain address values that point to memory, additional registers are involved when accessing these memory locations as part of a mechanism called protected mode segmentation. This works by checking against various segment registers, also called selectors:
■ All accesses to the program counter are first verified by checking against the code segment (CS) register.
■ All accesses to the stack pointer are first verified by checking against the stack segment (SS) register.
■ Accesses to other registers are determined by a segment override, which encoding can be used to force checking against a specific register such as the data segment (DS), extended segment (ES), or F segment (FS).
These selectors live in 16-bit segment registers and are looked up in a data structure called the Global Descriptor Table (GDT). To locate the GDT, the processor uses yet another CPU register, the GDT Register, or GDTR. The format of these selectors is as shown in Figure 8-1.

Figure 8-1 Format of an x86 segment selector.
The offset located in the segment selector is thus looked up in the GDT, unless the TI bit is set, in which case a different structure, the Local Descriptor Table is used, which is identified by the LDTR register instead and is not used anymore in the modern Windows OS. The result is in a segment entry being discovered—or alternatively, an invalid entry, which will issue a General Protection Fault (#GP) or Segment Fault (#SF) exception.
This entry, called segment descriptor in modern operating systems, serves two critical purposes:
■ For a code segment, it indicates the ring level, also called the Code Privilege Level (CPL) at which code running with this segment selector loaded will execute. This ring level, which can be from 0 to 3, is then cached in the bottom two bits of the actual selector, as was shown in Figure 8-1. Operating systems such as Windows use Ring 0 to run kernel mode components and drivers, and Ring 3 to run applications and services.
Furthermore, on x64 systems, the code segment also indicates whether this is a Long Mode or Compatibility Mode segment. The former is used to allow the native execution of x64 code, whereas the latter activates legacy compatibility with x86. A similar mechanism exists on x86 systems, where a segment can be marked as a 16-bit segment or a 32-bit segment.
■ For other segments, it indicates the ring level, also called the Descriptor Privilege Level (DPL), that is required to access this segment. Although largely an anachronistic check in today’s modern systems, the processor still enforces (and applications still expect) this to be set up correctly.
Finally, on x86 systems, segment entries can also have a 32-bit base address, which will add that value to any value already loaded in a register that is referencing this segment with an override. A corresponding segment limit is then used to check if the underlying register value is beyond a fixed cap. Because this base address was set to 0 (and limit to 0xFFFFFFFF) on most operating systems, the x64 architecture does away with this concept, apart from the FS and GS selectors, which operate a little bit differently:
■ If the Code Segment is a Long Mode code segment, then get the base address for the FS segment from the FS_BASE Model Specific Register (MSR)—0C0000100h. For the GS segment, look at the current swap state, which can be modified with the swapgs instruction, and load either the GS_BASE MSR—0C0000101h or the GS_SWAP MSR—0C0000102h.
If the TI bit is set in the FS or GS segment selector register, then get its value from the LDT entry at the appropriate offset, which is limited to a 32-bit base address only. This is done for compatibility reasons with certain operating systems, and the limit is ignored.
■ If the Code Segment is a Compatibility Mode segment, then read the base address as normal from the appropriate GDT entry (or LDT entry if the TI bit is set). The limit is enforced and validated against the offset in the register following the segment override.
This interesting behavior of the FS and GS segments is used by operating systems such as Windows to achieve a sort of thread-local register effect, where specific data structures can be pointed to by the segment base address, allowing simple access to specific offsets/fields within it.
For example, Windows stores the address of the Thread Environment Block (TEB), which was described in Part 1, Chapter 3, “Processes and jobs,” in the FS segment on x86 and in the GS (swapped) segment on x64. Then, while executing kernel-mode code on x86 systems, the FS segment is manually modified to a different segment entry that contains the address of the Kernel Processor Control Region (KPCR) instead, whereas on x64, the GS (non-swapped) segment stores this address.
Therefore, segmentation is used to achieve these two effects on Windows—encode and enforce the level of privilege that a piece of code can execute with at the processor level and provide direct access to the TEB and KPCR data structures from user-mode and/or kernel-mode code, as appropriate. Note that since the GDT is pointed to by a CPU register—the GDTR—each CPU can have its own GDT. In fact, this is exactly what Windows uses to make sure the appropriate per-processor KPCR is loaded for each GDT, and that the TEB of the currently executing thread on the current processor is equally present in its segment.
Lazy segment loading
Based on the description and values of the segments described earlier, it may be surprising to investigate the values of DS and ES on an x86 and/or x64 system and find that they do not necessarily match the defined values for their respective ring levels. For example, an x86 user-mode thread would have the following segments:
CS = 1Bh (18h | 3)
ES, DS = 23 (20h | 3)
FS = 3Bh (38h | 3)
Yet, during a system call in Ring 0, the following segments would be found:
CS = 08h (08h | 0)
ES, DS = 23 (20h | 3)
FS = 30h (30h | 0)
Similarly, an x64 thread executing in kernel mode would also have its ES and DS segments set to 2Bh (28h | 3). This discrepancy is due to a feature known as lazy segment loading and reflects the meaninglessness of the Descriptor Privilege Level (DPL) of a data segment when the current Code Privilege Level (CPL) is 0 combined with a system operating under a flat memory model. Since a higher CPL can always access data of a lower DPL—but not the contrary—setting DS and/or ES to their “proper” values upon entering the kernel would also require restoring them when returning to user mode.
Although the MOV DS, 10h instruction seems trivial, the processor’s microcode needs to perform a number of selector correctness checks when encountering it, which would add significant processing costs to system call and interrupt handling. As such, Windows always uses the Ring 3 data segment values, avoiding these associated costs.
Task state segments
Other than the code and data segment registers, there is an additional special register on both x86 and x64 architectures: the Task Register (TR), which is also another 16-bit selector that acts as an offset in the GDT. In this case, however, the segment entry is not associated with code or data, but rather with a task. This represents, to the processor’s internal state, the current executing piece of code, which is called the Task State—in the case of Windows, the current thread. These task states, represented by segments (Task State Segment, or TSS), are used in modern x86 operating systems to construct a variety of tasks that can be associated with critical processor traps (which we’ll see in the upcoming section). At minimum, a TSS represents a page directory (through the CR3 register), such as a PML4 on x64 systems (see Part 1, Chapter 5, “Memory management,” for more information on paging), a Code Segment, a Stack Segment, an Instruction Pointer, and up to four Stack Pointers (one for each ring level). Such TSSs are used in the following scenarios:
■ To represent the current execution state when there is no specific trap occurring. This is then used by the processor to correctly handle interrupts and exceptions by loading the Ring 0 stack from the TSS if the processor was currently running in Ring 3.
■ To work around an architectural race condition when dealing with Debug Faults (#DB), which requires a dedicated TSS with a custom debug fault handler and kernel stack.
■ To represent the execution state that should be loaded when a Double Fault (#DF) trap occurs. This is used to switch to the Double Fault handler on a safe (backup) kernel stack instead of the current thread’s kernel stack, which may be the reason why a fault has happened.
■ To represent the execution state that should be loaded when a Non Maskable Interrupt (#NMI) occurs. Similarly, this is used to load the NMI handler on a safe kernel stack.
■ Finally, to a similar task that is also used during Machine Check Exceptions (#MCE), which, for the same reasons, can run on a dedicated, safe, kernel stack.
On x86 systems, you’ll find the main (current) TSS at selector 028h in the GDT, which explains why the TR register will be 028h during normal Windows execution. Additionally, the #DF TSS is at 58h, the NMI TSS is at 50h, and the #MCE TSS is at 0A0h. Finally, the #DB TSS is at 0A8h.
On x64 systems, the ability to have multiple TSSs was removed because the functionality had been relegated to mostly this one need of executing trap handlers that run on a dedicated kernel stack. As such, only a single TSS is now used (in the case of Windows, at 040h), which now has an array of eight possible stack pointers, called the Interrupt Stack Table (IST). Each of the preceding traps is now associated with an IST Index instead of a custom TSS. In the next section, as we dump a few IDT entries, you will see the difference between x86 and x64 systems and their handling of these traps.
Now that the relationship between ring level, code execution, and some of the key segments in the GDT has been clarified, we’ll take a look at the actual transitions that can occur between different code segments (and their ring level) in the upcoming section on trap dispatching. Before discussing trap dispatching, however, let’s analyze how the TSS configuration changes in systems that are vulnerable to the Meltdown hardware side-channels attack.
Hardware side-channel vulnerabilities
Modern CPUs can compute and move data between their internal registers very quickly (in the order of pico-seconds). A processor’s registers are a scarce resource. So, the OS and applications’ code always instruct the CPU to move data from the CPU registers into the main memory and vice versa. There are different kinds of memory that are accessible from the main CPU. Memory located inside the CPU package and accessible directly from the CPU execution engine is called cache and has the characteristic of being fast and expensive. Memory that is accessible from the CPU through an external bus is usually the RAM (Random Access Memory) and has the characteristic of being slower, cheaper, and big in size. The locality of the memory in respect to the CPU defines a so-called memory hierarchy based on memories of different speeds and sizes (the more memory is closer to the CPU, the more memory is faster and smaller in size). As shown in Figure 8-2, CPUs of modern computers usually include three different levels of fast cache memory, which is directly accessible by the execution engine of each physical core: L1, L2, and L3 cache. L1 and L2 caches are the closest to a CPU’s core and are private per each core. L3 cache is the farthest one and is always shared between all CPU’s cores (note that on embedded processors, the L3 cache usually does not exist).
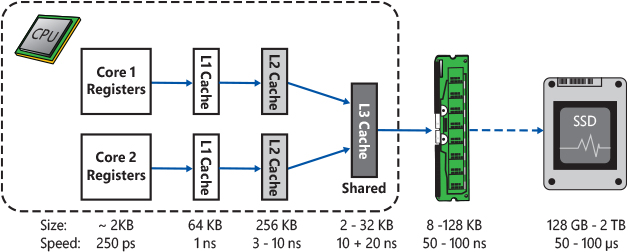
Figure 8-2 Caches and storage memory of modern CPUs and their average size and access time.
One of main characteristics of cache is its access time, which is comparable to CPU’s registers (even though it is still slower). Access time to the main memory is instead a hundred times slower. This means that in case the CPU executes all the instructions in order, many times there would be huge slowdowns due to instructions accessing data located in the main memory. To overcome this problem, modern CPUs implement various strategies. Historically, those strategies have led to the discovery of side-channel attacks (also known as speculative attacks), which have been proven to be very effective against the overall security of the end-user systems.
To correctly describe side-channel hardware attacks and how Windows mitigates them, we should discuss some basic concepts regarding how the CPU works internally.
Out-of-order execution
A modern microprocessor executes machine instructions thanks to its pipeline. The pipeline contains many stages, including instruction fetch, decoding, register allocation and renaming, instructions reordering, execution, and retirement. A common strategy used by the CPUs to bypass the memory slowdown problem is the capability of their execution engine to execute instructions out of order as soon as the required resources are available. This means that the CPU does not execute the instructions in a strictly sequential order, maximizing the utilization of all the execution units of the CPU core as exhaustive as possible. A modern processor can execute hundreds of instructions speculatively before it is certain that those instructions will be needed and committed (retired).
One problem of the described out-of-order execution regards branch instructions. A conditional branch instruction defines two possible paths in the machine code. The correct path to be taken depends on the previously executed instructions. When calculating the condition depends on previous instructions that access slow RAM memory, there can be slowdowns. In that case, the execution engine waits for the retirement of the instructions defining the conditions (which means waiting for the memory bus to complete the memory access) before being able to continue in the out-of-order execution of the following instructions belonging to the correct path. A similar problem happens in the case of indirect branches. In this case, the execution engine of the CPU does not know the target of a branch (usually a jump or a call) because the address must be fetched from the main memory. In this context, the term speculative execution means that the CPU’s pipeline decodes and executes multiple instructions in parallel or in an out-of-order way, but the results are not retired into permanent registers, and memory writes remain pending until the branch instruction is finally resolved.
The CPU branch predictor
How does the CPU know which branch (path) should be executed before the branch condition has been completely evaluated? (The issue is similar with indirect branches, where the target address is not known). The answer lies in two components located in the CPU package: the branch predictor and the branch target predictor.
The branch predictor is a complex digital circuit of a CPU that tries to guess which path a branch will go before it is known definitively. In a similar way, the branch target predictor is the part of the CPU that tries to predict the target of indirect branches before it is known. While the actual hardware implementation heavily depends on the CPU manufacturer, the two components both use an internal cache called Branch Target Buffer (BTB), which records the target address of branches (or information about what the conditional branch has previously done in the past) using an address tag generated through an indexing function, similar to how the cache generates the tag, as explained in the next section. The target address is stored in the BTB the first time a branch instruction is executed. Usually, at the first time, the execution pipeline is stalled, forcing the CPU to wait for the condition or target address to be fetched from the main memory. The second time the same branch is executed, the target address in the BTB is used for fetching the predicted target into the pipeline. Figure 8-3 shows a simple scheme of an example branch target predictor.
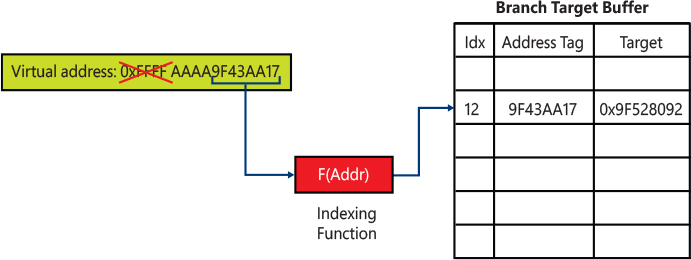
Figure 8-3 The scheme of a sample CPU branch predictor.
In case the prediction was wrong, and the wrong path was executed speculatively, then the instruction pipeline is flushed, and the results of the speculative execution are discarded. The other path is fed into the CPU pipeline and the execution restarts from the correct branch. This case is called branch misprediction. The total number of wasted CPU cycles is not worse than an in-order execution waiting for the result of a branch condition or indirect address evaluation. However, different side effects of the speculative execution can still happen in the CPU, like the pollution of the CPU cache lines. Unfortunately, some of these side effects can be measured and exploited by attackers, compromising the overall security of the system.
The CPU cache(s)
As introduced in the previous section, the CPU cache is a fast memory that reduces the time needed for data or instructions fetch and store. Data is transferred between memory and cache in blocks of fixed sizes (usually 64 or 128 bytes) called lines or cache blocks. When a cache line is copied from memory into the cache, a cache entry is created. The cache entry will include the copied data as well as a tag identifying the requested memory location. Unlike the branch target predictor, the cache is always indexed through physical addresses (otherwise, it would be complex to deal with multiple mappings and changes of address spaces). From the cache perspective, a physical address is split in different parts. Whereas the higher bits usually represent the tag, the lower bits represent the cache line and the offset into the line. A tag is used to uniquely identify which memory address the cache block belongs to, as shown in Figure 8-4.
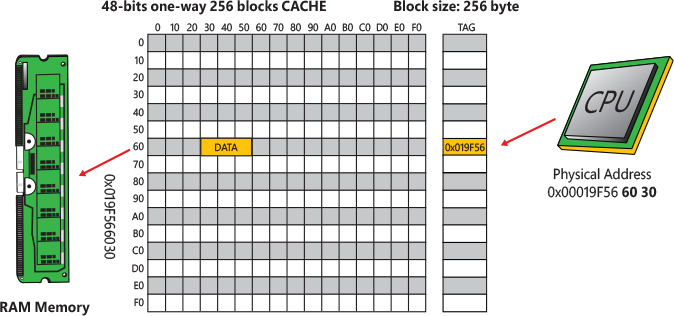
Figure 8-4 A sample 48-bit one-way CPU cache.
When the CPU reads or writes a location in memory, it first checks for a corresponding entry in the cache (in any cache lines that might contain data from that address. Some caches have different ways indeed, as explained later in this section). If the processor finds that the memory content from that location is in the cache, a cache hit has occurred, and the processor immediately reads or writes the data from/in the cache line. Otherwise, a cache miss has occurred. In this case, the CPU allocates a new entry in the cache and copies data from main memory before accessing it.
In Figure 8-4, a one-way CPU cache is shown, and it’s capable of addressing a maximum 48-bits of virtual address space. In the sample, the CPU is reading 48 bytes of data located at virtual address 0x19F566030. The memory content is initially read from the main memory into the cache block 0x60. The block is entirely filled, but the requested data is located at offset 0x30. The sample cache has just 256 blocks of 256 bytes, so multiple physical addresses can fill block number 0x60. The tag (0x19F56) uniquely identifies the physical address where data is stored in the main memory.
In a similar way, when the CPU is instructed to write some new content to a memory address, it first updates the cache line(s) that the memory address belongs to. At some point, the CPU writes the data back to the physical RAM as well, depending on the caching type (write-back, write-through, uncached, and so on) applied to the memory page. (Note that this has an important implication in multiprocessor systems: A cache coherency protocol must be designed to prevent situations in which another CPU will operate on stale data after the main CPU has updated a cache block. (Multiple CPU cache coherency algorithms exist and are not covered in this book.)
To make room for new entries on cache misses, the CPU sometime should evict one of the existing cache blocks. The algorithm the cache uses to choose which entry to evict (which means which block will host the new data) is called the placement policy. If the placement policy can replace only one block for a particular virtual address, the cache is called direct mapped (the cache in Figure 8-4 has only one way and is direct mapped). Otherwise, if the cache is free to choose any entry (with the same block number) to hold the new data, the cache is called fully associative. Many caches implement a compromise in which each entry in main memory can go to any one of N places in the cache and are described as N-ways set associative. A way is thus a subdivision of a cache, with each way being of equal size and indexed in the same fashion. Figure 8-5 shows a four-way set associative cache. The cache in the figure can store data belonging to four different physical addresses indexing the same cache block (with different tags) in four different cache sets.
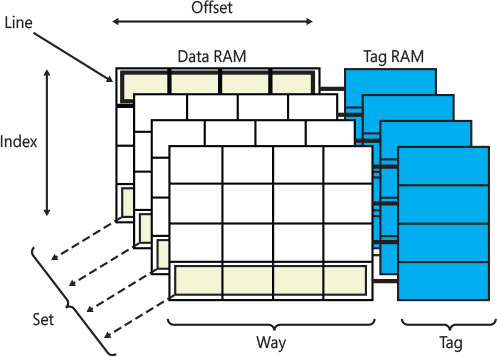
Figure 8-5 A four-way set associative cache.
Side-channel attacks
As discussed in the previous sections, the execution engine of modern CPUs does not write the result of the computation until the instructions are actually retired. This means that, although multiple instructions are executed out of order and do not have any visible architectural effects on CPU registers and memory, they have microarchitectural side effects, especially on the CPU cache. At the end of the year 2017, novel attacks were demonstrated against the CPU out-of-order engines and their branch predictors. These attacks relied on the fact that microarchitectural side effects can be measured, even though they are not directly accessible by any software code.
The two most destructive and effective hardware side-channel attacks were named Meltdown and Spectre.
Meltdown
Meltdown (which has been later called Rogue Data Cache load, or RDCL) allowed a malicious user-mode process to read all memory, even kernel memory, when it was not authorized to do so. The attack exploited the out-of-order execution engine of the processor and an inner race condition between the memory access and privilege check during a memory access instruction processing.
In the Meltdown attack, a malicious user-mode process starts by flushing the entire cache (instructions that do so are callable from user mode). The process then executes an illegal kernel memory access followed by instructions that fill the cache in a controlled way (using a probe array). The process cannot access the kernel memory, so an exception is generated by the processor. The exception is caught by the application. Otherwise, it would result in the termination of the process. However, due to the out-of-order execution, the CPU has already executed (but not retired, meaning that no architectural effects are observable in any CPU registers or RAM) the instructions following the illegal memory access that have filled the cache with the illegally requested kernel memory content.
The malicious application then probes the entire cache by measuring the time needed to access each page of the array used for filling the CPU cache’s block. If the access time is behind a certain threshold, the data is in the cache line, so the attacker can infer the exact byte read from the kernel memory. Figure 8-6, which is taken from the original Meltdown research paper (available at the https://meltdownattack.com/ web page), shows the access time of a 1 MB probe array (composed of 256 4KB pages):
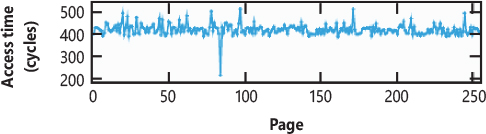
Figure 8-6 CPU time employed for accessing a 1 MB probe array.
Figure 8-6 shows that the access time is similar for each page, except for one. Assuming that secret data can be read one byte per time and one byte can have only 256 values, knowing the exact page in the array that led to a cache hit allows the attacker to know which byte is stored in the kernel memory.
Spectre
The Spectre attack is similar to Meltdown, meaning that it still relies on the out-of-order execution flaw explained in the previous section, but the main CPU components exploited by Spectre are the branch predictor and branch target predictor. Two variants of the Spectre attack were initially presented. Both are summarized by three phases:
In the setup phase, from a low-privileged process (which is attacker-controlled), the attacker performs multiple repetitive operations that mistrain the CPU branch predictor. The goal is to train the CPU to execute a (legit) path of a conditional branch or a well-defined target of an indirect branch.
In the second phase, the attacker forces a victim high-privileged application (or the same process) to speculatively execute instructions that are part of a mispredicted branch. Those instructions usually transfer confidential information from the victim context into a microarchitectural channel (usually the CPU cache).
In the final phase, from the low-privileged process, the attacker recovers the sensitive information stored in the CPU cache (microarchitectural channel) by probing the entire cache (the same methods employed in the Meltdown attack). This reveals secrets that should be secured in the victim high-privileged address space.
The first variant of the Spectre attack can recover secrets stored in a victim process’s address space (which can be the same or different than the address space that the attacker controls), by forcing the CPU branch predictor to execute the wrong branch of a conditional branch speculatively. The branch is usually part of a function that performs a bound check before accessing some nonsecret data contained in a memory buffer. If the buffer is located adjacent to some secret data, and if the attacker controls the offset supplied to the branch condition, she can repetitively train the branch predictor supplying legal offset values, which satisfies the bound check and allows the CPU to execute the correct path.
The attacker then prepares in a well-defined way the CPU cache (such that the size of the memory buffer used for the bound check wouldn’t be in the cache) and supplies an illegal offset to the function that implements the bound check branch. The CPU branch predictor is trained to always follow the initial legit path. However, this time, the path would be wrong (the other should be taken). The instructions accessing the memory buffer are thus speculatively executed and result in a read outside the boundaries, which targets the secret data. The attacker can thus read back the secrets by probing the entire cache (similar to the Meltdown attack).
The second variant of Spectre exploits the CPU branch target predictor; indirect branches can be poisoned by an attacker. The mispredicted path of an indirect branch can be used to read arbitrary memory of a victim process (or the OS kernel) from an attacker-controlled context. As shown in Figure 8-7, for variant 2, the attacker mistrains the branch predictor with malicious destinations, allowing the CPU to build enough information in the BTB to speculatively execute instructions located at an address chosen by the attacker. In the victim address space, that address should point to a gadget. A gadget is a group of instructions that access a secret and store it in a buffer that is cached in a controlled way (the attacker needs to indirectly control the content of one or more CPU registers in the victim, which is a common case when an API accepts untrusted input data).
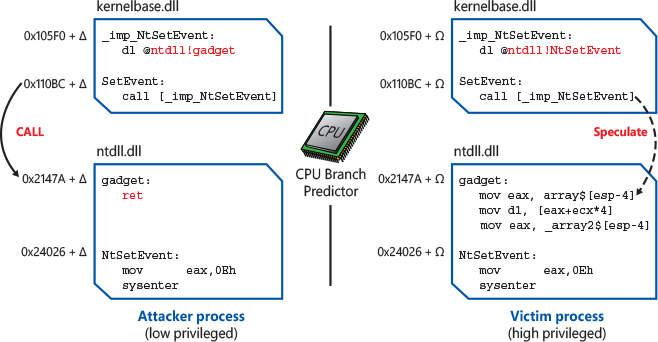
Figure 8-7 A scheme of Spectre attack Variant 2.
After the attacker has trained the branch target predictor, she flushes the CPU cache and invokes a service provided by the target higher-privileged entity (a process or the OS kernel). The code that implements the service must implement similar indirect branches as the attacker-controlled process. The CPU branch target predictor in this case speculatively executes the gadget located at the wrong target address. This, as for Variant 1 and Meltdown, creates microarchitectural side effects in the CPU cache, which can be read from the low-privileged context.
Other side-channel attacks
After Spectre and Meltdown attacks were originally publicly released, multiple similar side-channel hardware attacks were discovered. Even though they were less destructive and effective compared to Meltdown and Spectre, it is important to at least understand the overall methodology of those new side-channel attacks.
Speculative store bypass (SSB) arises due to a CPU optimization that can allow a load instruction, which the CPU evaluated not to be dependent on a previous store, to be speculatively executed before the results of the store are retired. If the prediction is not correct, this can result in the load operation reading stale data, which can potentially store secrets. The data can be forwarded to other operations executed during speculation. Those operations can access memory and generate microarchitectural side effects (usually in the CPU cache). An attacker can thus measure the side effects and recover the secret value.
The Foreshadow (also known as L1TF) is a more severe attack that was originally designed for stealing secrets from a hardware enclave (SGX) and then generalized also for normal user-mode software executing in a non-privileged context. Foreshadow exploited two hardware flaws of the speculative execution engine of modern CPUs. In particular:
■ Speculation on inaccessible virtual memory. In this scenario, when the CPU accesses some data stored at a virtual address described by a Page table entry (PTE) that does not include the present bit (meaning that the address is is not valid) an exception is correctly generated. However, if the entry contains a valid address translation, the CPU can speculatively execute the instructions that depend on the read data. As for all the other side-channel attacks, those instructions are not retired by the processor, but they produce measurable side effects. In this scenario, a user-mode application would be able to read secret data stored in kernel memory. More seriously, the application, under certain circumstances, would also be able to read data belonging to another virtual machine: when the CPU encounters a nonpresent entry in the Second Level Address Translation table (SLAT) while translating a guest physical address (GPA), the same side effects can happen. (More information on the SLAT, GPAs, and translation mechanisms are present in Chapter 5 of Part 1 and in Chapter 9, “Virtualization technologies”).
■ Speculation on the logical (hyper-threaded) processors of a CPU’s core. Modern CPUs can have more than one execution pipeline per physical core, which can execute in an out-of-order way multiple instruction streams using a single shared execution engine (this is Symmetric multithreading, or SMT, as explained later in Chapter 9.) In those processors, two logical processors (LPs) share a single cache. Thus, while an LP is executing some code in a high-privileged context, the other sibling LP can read the side effects produced by the high-privileged code executed by the other LP. This has very severe effects on the global security posture of a system. Similar to the first Foreshadow variant, an LP executing the attacker code on a low-privileged context can even spoil secrets stored in another high-security virtual-machine just by waiting for the virtual machine code that will be scheduled for execution by the sibling LP. This variant of Foreshadow is part of the Group 4 vulnerabilities.
Microarchitectural side effects are not always targeting the CPU cache. Intel CPUs use other intermediate high-speed buffers with the goal to better access cached and noncached memory and reorder micro-instructions. (Describing all those buffers is outside the scope of this book.) The Microarchitectural Data Sampling (MDS) group of attacks exposes secrets data located in the following microarchitectural structures:
■ Store buffers While performing store operations, processors write data into an internal temporary microarchitectural structure called store buffer, enabling the CPU to continue to execute instructions before the data is actually written in the cache or main memory (for noncached memory access). When a load operation reads data from the same memory address as an earlier store, the processor may be able to forward data directly from the store buffer.
■ Fill buffers A fill buffer is an internal processor structure used to gather (or write) data on a first level data cache miss (and on I/O or special registers operations). Fill buffers are the intermediary between the CPU cache and the CPU out-of-order execution engine. They may retain data from prior memory requests, which may be speculatively forwarded to a load operation.
■ Load ports Load ports are temporary internal CPU structures used to perform load operations from memory or I/O ports.
Microarchitectural buffers usually belong to a single CPU core and are shared between SMT threads. This implies that, even if attacks on those structures are hard to achieve in a reliable way, the speculative extraction of secret data stored into them is also potentially possible across SMT threads (under specific conditions).
In general, the outcome of all the hardware side-channel vulnerabilities is the same: secrets will be spoiled from the victim address space. Windows implements various mitigations for protecting against Spectre, Meltdown, and almost all the described side-channel attacks.
Side-channel mitigations in Windows
This section takes a peek at how Windows implements various mitigations for defending against side-channel attacks. In general, some side-channel mitigations are implemented by CPU manufacturers through microcode updates. Not all of them are always available, though; some mitigations need to be enabled by the software (Windows kernel).
KVA Shadow
Kernel virtual address shadowing, also known as KVA shadow (or KPTI in the Linux world, which stands for Kernel Page Table Isolation) mitigates the Meltdown attack by creating a distinct separation between the kernel and user page tables. Speculative execution allows the CPU to spoil kernel data when the processor is not at the correct privilege level to access it, but it requires that a valid page frame number be present in the page table translating the target kernel page. The kernel memory targeted by the Meltdown attack is generally translated by a valid leaf entry in the system page table, which indicates only supervisor privilege level is allowed. (Page tables and virtual address translation are covered in Chapter 5 of Part 1.) When KVA shadow is enabled, the system allocates and uses two top-level page tables for each process:
■ The kernel page tables map the entire process address space, including kernel and user pages. In Windows, user pages are mapped as nonexecutable to prevent kernel code to execute memory allocated in user mode (an effect similar to the one brought by the hardware SMEP feature).
■ The User page tables (also called shadow page tables) map only user pages and a minimal set of kernel pages, which do not contain any sort of secrets and are used to provide a minimal functionality for switching page tables, kernel stacks, and to handle interrupts, system calls, and other transitions and traps. This set of kernel pages is called transition address space.
In the transition address space, the NT kernel usually maps a data structure included in the processor’s PRCB, called KPROCESSOR_DESCRIPTOR_AREA, which includes data that needs to be shared between the user (or shadow) and kernel page tables, like the processor’s TSS, GDT, and a copy of the kernel mode GS segment base address. Furthermore, the transition address space includes all the shadow trap handlers located in the “.KVASCODE” section of the NT Kernel image.
A system with KVA shadow enabled runs unprivileged user-mode threads (i.e., running without Administrator-level privileges) in processes that do not have mapped any kernel page that may contain secrets. The Meltdown attack is not effective anymore; kernel pages are not mapped as valid in the process’s page table, and any sort of speculation in the CPU targeting those pages simply cannot happen. When the user process invokes a system call, or when an interrupt happens while the CPU is executing code in the user-mode process, the CPU builds a trap frame on a transition stack, which, as specified before, is mapped in both the user and kernel page tables. The CPU then executes the code of the shadow trap handler that handles the interrupt or system call. The latter normally switches to the kernel page tables, copies the trap frame on the kernel stack, and then jumps to the original trap handler (this implies that a well-defined algorithm for flushing stale entries in the TLB must be properly implemented. The TLB flushing algorithm is described later in this section.) The original trap handler is executed with the entire address space mapped.
Initialization
The NT kernel determines whether the CPU is susceptible to Meltdown attack early in phase -1 of its initialization, after the processor feature bits are calculated, using the internal KiDetectKvaLeakage routine. The latter obtains processor’s information and sets the internal KiKvaLeakage variable to 1 for all Intel processors except Atoms (which are in-order processors).
In case the internal KiKvaLeakage variable is set, KVA shadowing is enabled by the system via the KiEnableKvaShadowing routine, which prepares the processor’s TSS (Task State Segment) and transition stacks. The RSP0 (kernel) and IST stacks of the processor’s TSS are set to point to the proper transition stacks. Transition stacks (which are 512 bytes in size) are prepared by writing a small data structure, called KIST_BASE_FRAME on the base of the stack. The data structure allows the transition stack to be linked against its nontransition kernel stack (accessible only after the page tables have been switched), as illustrated by Figure 8-8. Note that the data structure is not needed for the regular non-IST kernel stacks. The OS obtains all the needed data for the user-to-kernel switch from the CPU’s PRCB. Each thread has a proper kernel stack. The scheduler set a kernel stack as active by linking it in the processor PRCB when a new thread is selected to be executed. This is a key difference compared to the IST stacks, which exist as one per processor.
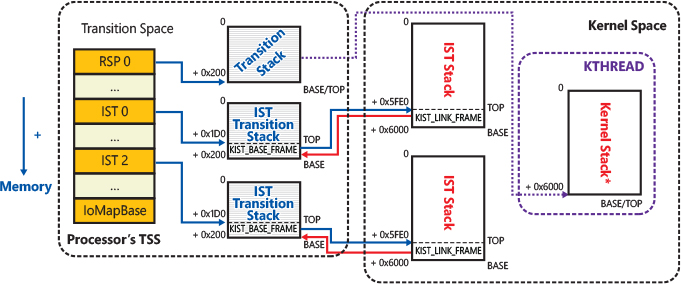
Figure 8-8 Configuration of the CPU’s Task State Segment (TSS) when KVA shadowing is active.
The KiEnableKvaShadowing routine also has the important duty of determining the proper TLB flush algorithm (explained later in this section). The result of the determination (global entries or PCIDs) is stored in the global KiKvaShadowMode variable. Finally, for non-boot processors, the routine invokes KiShadowProcessorAllocation, which maps the per-processor shared data structures in the shadow page tables. For the BSP processor, the mapping is performed later in phase 1, after the SYSTEM process and its shadow page tables are created (and the IRQL is dropped to passive level). The shadow trap handlers are mapped in the user page tables only in this case (they are global and not per-processor specific).
Shadow page tables
Shadow (or user) page tables are allocated by the memory manager using the internal MiAllocateProcessShadow routine only when a process’s address space is being created. The shadow page tables for the new process are initially created empty. The memory manager then copies all the kernel shadow top-level page table entries of the SYSTEM process in the new process shadow page table. This allows the OS to quickly map the entire transition address space (which lives in kernel and is shared between all user-mode processes) in the new process. For the SYSTEM process, the shadow page tables remain empty. As introduced in the previous section, they will be filled thanks to the KiShadowProcessorAllocation routine, which uses memory manager services to map individual chunks of memory in the shadow page tables and to rebuild the entire page hierarchy.
The shadow page tables are updated by the memory manager only in specific cases. Only the kernel can write in the process page tables to map or unmap chunks of memory. When a request to allocate or map new memory into a user process address space, it may happen that the top-level page table entry for a particular address would be missing. In this case, the memory manager allocates all the pages for the entire page-table hierarchy and stores the new top-level PTE in the kernel page tables. However, in case KVA shadow is enabled, this is not enough; the memory manager must also write the top-level PTE on the shadow page table. Otherwise, the address will be not present in the user-mapping after the trap handler correctly switches the page tables before returning to user mode.
Kernel addresses are mapped in a different way in the transition address space compared to the kernel page tables. To prevent false sharing of addresses close to the chunk of memory being mapped in the transition address space, the memory manager always recreates the page table hierarchy mapping for the PTE(s) being shared. This implies that every time the kernel needs to map some new pages in the transition address space of a process, it must replicate the mapping in all the processes’ shadow page tables (the internal MiCopyTopLevelMappings routine performs exactly this operation).
TLB flushing algorithm
In the x86 architecture, switching page tables usually results in the flushing of the current processor’s TLB (translation look-aside buffer). The TLB is a cache used by the processor to quickly translate the virtual addresses that are used while executing code or accessing data. A valid entry in the TLB allows the processor to avoid consulting the page tables chain, making execution faster. In systems without KVA shadow, the entries in the TLB that translate kernel addresses do not need to be explicitly flushed: in Windows, the kernel address space is mostly unique and shared between all processes. Intel and AMD introduced different techniques to avoid flushing kernel entries on every page table switching, like the global/non-global bit and the Process-Context Identifiers (PCIDs). The TLB and its flushing methodologies are described in detail in the Intel and AMD architecture manuals and are not further discussed in this book.
Using the new CPU features, the operating system is able to only flush user entries and keep performance fast. This is clearly not acceptable in KVA shadow scenarios where a thread is obligated to switch page tables even when entering or exiting the kernel. In systems with KVA enabled, Windows employs an algorithm able to explicitly flush kernel and user TLB entries only when needed, achieving the following two goals:
■ No valid kernel entries will be ever maintained in the TLB when executing a thread user-code. Otherwise, this could be leveraged by an attacker with the same speculation techniques used in Meltdown, which could lead her to read secret kernel data.
■ Only the minimum amount of TLB entries will be flushed when switching page tables. This will keep the performance degradation introduced by KVA shadowing acceptable.
The TLB flushing algorithm is implemented in mainly three scenarios: context switch, trap entry, and trap exit. It can run on a system that either supports only the global/non-global bit or also PCIDs. In the former case, differently from the non-KVA shadow configurations, all the kernel pages are labeled as non-global, whereas the transition and user pages are labeled as global. Global pages are not flushed while a page table switch happens (the system changes the value of the CR3 register). Systems with PCID support labels kernel pages with PCID 2, whereas user pages are labelled with PCID 1. The global and non-global bits are ignored in this case.
When the current-executing thread ends its quantum, a context switch is initialized. When the kernel schedules execution for a thread belonging to another process address space, the TLB algorithm assures that all the user pages are removed from the TLB (which means that in systems with global/non-global bit a full TLB flush is needed. User pages are indeed marked as global). On kernel trap exits (when the kernel finishes code execution and returns to user mode) the algorithm assures that all the kernel entries are removed (or invalidated) from the TLB. This is easily achievable: on processors with global/non-global bit support, just a reload of the page tables forces the processor to invalidate all the non-global pages, whereas on systems with PCID support, the user-page tables are reloaded using the User PCID, which automatically invalidates all the stale kernel TLB entries.
The strategy allows kernel trap entries, which can happen when an interrupt is generated while the system was executing user code or when a thread invokes a system call, not to invalidate anything in the TLB. A scheme of the described TLB flushing algorithm is represented in Table 8-1.
Table 8-1 KVA shadowing TLB flushing strategies
Configuration Type |
User Pages |
Kernel Pages |
Transition Pages |
|---|---|---|---|
KVA shadowing disabled |
Non-global |
Global |
N / D |
KVA shadowing enabled, PCID strategy |
PCID 1, non-global |
PCID 2, non-global |
PCID 1, non-global |
KVA shadowing enabled, global/non-global strategy |
Global |
Non-global |
Global |
Hardware indirect branch controls (IBRS, IBPB, STIBP, SSBD)
Processor manufacturers have designed hardware mitigations for various side-channel attacks. Those mitigations have been designed to be used with the software ones. The hardware mitigations for side-channel attacks are mainly implemented in the following indirect branch controls mechanisms, which are usually exposed through a bit in CPU model-specific registers (MSR):
■ Indirect Branch Restricted Speculation (IBRS) completely disables the branch predictor (and clears the branch predictor buffer) on switches to a different security context (user vs kernel mode or VM root vs VM non-root). If the OS sets IBRS after a transition to a more privileged mode, predicted targets of indirect branches cannot be controlled by software that was executed in a less privileged mode. Additionally, when IBRS is on, the predicted targets of indirect branches cannot be controlled by another logical processor. The OS usually sets IBRS to 1 and keeps it on until it returns to a less privileged security context.
The implementation of IBRS depends on the CPU manufacturer: some CPUs completely disable branch predictors buffers when IBRS is set to on (describing an inhibit behavior), while some others just flush the predictor’s buffers (describing a flush behavior). In those CPUs the IBRS mitigation control works in a very similar way to IBPB, so usually the CPU implement only IBRS.
■ Indirect Branch Predictor Barrier (IBPB) flushes the content of the branch predictors when it is set to 1, creating a barrier that prevents software that executed previously from controlling the predicted targets of indirect branches on the same logical processor.
■ Single Thread Indirect Branch Predictors (STIBP) restricts the sharing of branch prediction between logical processors on a physical CPU core. Setting STIBP to 1 on a logical processor prevents the predicted targets of indirect branches on a current executing logical processor from being controlled by software that executes (or executed previously) on another logical processor of the same core.
■ Speculative Store Bypass Disable (SSBD) instructs the processor to not speculatively execute loads until the addresses of all older stores are known. This ensures that a load operation does not speculatively consume stale data values due to bypassing an older store on the same logical processor, thus protecting against Speculative Store Bypass attack (described earlier in the “Other side-channel attacks” section).
The NT kernel employs a complex algorithm to determine the value of the described indirect branch controls, which usually changes in the same scenarios described for KVA shadowing: context switches, trap entries, and trap exits. On compatible systems, the system runs kernel code with IBRS always on (except when Retpoline is enabled). When no IBRS is available (but IBPB and STIBP are supported), the kernel runs with STIBP on, flushing the branch predictor buffers (with an IBPB) on every trap entry (in that way the branch predictor can’t be influenced by code running in user mode or by a sibling thread running in another security context). SSBD, when supported by the CPU, is always enabled in kernel mode.
For performance reasons, user-mode threads are generally executed with no hardware speculation mitigations enabled or just with STIBP on (depending on STIBP pairing being enabled, as explained in the next section). The protection against Speculative Store Bypass must be manually enabled if needed through the global or per-process Speculation feature. Indeed, all the speculation mitigations can be fine-tuned through the global HKLMSystemCurrentControlSetControlSession ManagerMemory ManagementFeatureSettings registry value. The value is a 32-bit bitmask, where each bit corresponds to an individual setting. Table 8-2 describes individual feature settings and their meaning.
Table 8-2 Feature settings and their values
Name |
Value |
Meaning |
|---|---|---|
FEATURE_SETTINGS_DISABLE_IBRS_EXCEPT_ HVROOT |
0x1 |
Disable IBRS except for non-nested root partition (default setting for Server SKUs) |
FEATURE_SETTINGS_DISABLE_KVA_SHADOW |
0x2 |
Force KVA shadowing to be disabled |
FEATURE_SETTINGS_DISABLE_IBRS |
0x4 |
Disable IBRS, regardless of machine configuration |
FEATURE_SETTINGS_SET_SSBD_ALWAYS |
0x8 |
Always set SSBD in kernel and user |
FEATURE_SETTINGS_SET_SSBD_IN_KERNEL |
0x10 |
Set SSBD only in kernel mode (leaving user-mode code to be vulnerable to SSB attacks) |
FEATURE_SETTINGS_USER_STIBP_ALWAYS |
0x20 |
Always keep STIBP on for user-threads, regardless of STIBP pairing |
FEATURE_SETTINGS_DISABLE_USER_TO_USER |
0x40 |
Disables the default speculation mitigation strategy (for AMD systems only) and enables the user-to-user only mitigation. When this flag is set, no speculation controls are set when running in kernel mode. |
FEATURE_SETTINGS_DISABLE_STIBP_PAIRING |
0x80 |
Always disable STIBP pairing |
FEATURE_SETTINGS_DISABLE_RETPOLINE |
0x100 |
Always disable Retpoline |
FEATURE_SETTINGS_FORCE_ENABLE_RETPOLINE |
0x200 |
Enable Retpoline regardless of the CPU support of IBPB or IBRS (Retpoline needs at least IBPB to properly protect against Spectre v2) |
FEATURE_SETTINGS_DISABLE_IMPORT_LINKING |
0x20000 |
Disable Import Optimization regardless of Retpoline |
Retpoline and import optimization
Keeping hardware mitigations enabled has strong performance penalties for the system, simply because the CPU’s branch predictor is limited or disabled when the mitigations are enabled. This was not acceptable for games and mission-critical applications, which were running with a lot of performance degradation. The mitigation that was bringing most of the performance degradation was IBRS (or IBPB), while used for protecting against Spectre. Protecting against the first variant of Spectre was possible without using any hardware mitigations thanks to the memory fence instructions. A good example is the LFENCE, available in the x86 architecture. Those instructions force the processor not to execute any new operations speculatively before the fence itself completes. Only when the fence completes (and all the instructions located before it have been retired) will the processor’s pipeline restart to execute (and to speculate) new opcodes. The second variant of Spectre was still requiring hardware mitigations, though, which implies all the performance problems brought by IBRS and IBPB.
To overcome the problem, Google engineers designed a novel binary-modification technique called Retpoline. The Retpoline sequence, shown in Figure 8-9, allows indirect branches to be isolated from speculative execution. Instead of performing a vulnerable indirect call, the processor jumps to a safe control sequence, which dynamically modifies the stack, captures eventual speculation, and lands to the new target thanks to a “return” operation.

Figure 8-9 Retpoline code sequence of x86 CPUs.
In Windows, Retpoline is implemented in the NT kernel, which can apply the Retpoline code sequence to itself and to external driver images dynamically through the Dynamic Value Relocation Table (DVRT). When a kernel image is compiled with Retpoline enabled (through a compatible compiler), the compiler inserts an entry in the image’s DVRT for each indirect branch that exists in the code, describing its address and type. The opcode that performs the indirect branch is kept as it is in the final code but augmented with a variable size padding. The entry in the DVRT includes all the information that the NT kernel needs to modify the indirect branch’s opcode dynamically. This architecture ensures that external drivers compiled with Retpoline support can run also on older OS versions, which will simply skip parsing the entries in the DVRT table.
![]() Note
Note
The DVRT was originally developed for supporting kernel ASLR (Address Space Layout Randomization, discussed in Chapter 5 of Part 1). The table was later extended to include Retpoline descriptors. The system can identify which version of the table an image includes.
In phase -1 of its initialization, the kernel detects whether the processor is vulnerable to Spectre, and, in case the system is compatible and enough hardware mitigations are available, it enables Retpoline and applies it to the NT kernel image and the HAL. The RtlPerformRetpolineRelocationsOnImage routine scans the DVRT and replaces each indirect branch described by an entry in the table with a direct branch, which is not vulnerable to speculative attacks, targeting the Retpoline code sequence. The original target address of the indirect branch is saved in a CPU register (R10 in AMD and Intel processors), with a single instruction that overwrites the padding generated by the compiler. The Retpoline code sequence is stored in the RETPOL section of the NT kernel’s image. The page backing the section is mapped in the end of each driver’s image.
Before being started, boot drivers are physically relocated by the internal MiReloadBootLoadedDrivers routine, which also applies the needed fixups to each driver’s image, including Retpoline. All the boot drivers, the NT kernel, and HAL images are allocated in a contiguous virtual address space by the Windows Loader and do not have an associated control area, rendering them not pageable. This means that all the memory backing the images is always resident, and the NT kernel can use the same RtlPerformRetpolineRelocationsOnImage function to modify each indirect branch in the code directly. If HVCI is enabled, the system must call the Secure Kernel to apply Retpoline (through the PERFORM_RETPOLINE_RELOCATIONS secure call). Indeed, in that scenario, the drivers’ executable memory is protected against any modification, following the W^X principle described in Chapter 9. Only the Secure Kernel is allowed to perform the modification.
![]() Note
Note
Retpoline and Import Optimization fixups are applied by the kernel to boot drivers before Patchguard (also known as Kernel Patch Protection; see Part 1, Chapter 7, “Security,” for further details) initializes and protects some of them. It is illegal for drivers and the NT kernel itself to modify code sections of protected drivers.
Runtime drivers, as explained in Chapter 5 of Part 1, are loaded by the NT memory manager, which creates a section object backed by the driver’s image file. This implies that a control area, including a prototype PTEs array, is created to track the pages of the memory section. For driver sections, some of the physical pages are initially brought in memory just for code integrity verification and then moved in the standby list. When the section is later mapped and the driver’s pages are accessed for the first time, physical pages from the standby list (or from the backing file) are materialized on-demand by the page fault handler. Windows applies Retpoline on the shared pages pointed by the prototype PTEs. If the same section is also mapped by a user-mode application, the memory manager creates new private pages and copies the content of the shared pages in the private ones, reverting Retpoline (and Import Optimization) fixups.
![]() Note
Note
Some newer Intel processors also speculate on “return” instructions. For those CPUs, Retpoline cannot be enabled because it would not be able to protect against Spectre v2. In this situation, only hardware mitigations can be applied. Enhanced IBRS (a new hardware mitigation) solves the performance problems of IBRS.
The Retpoline bitmap
One of the original design goals (restraints) of the Retpoline implementation in Windows was to support a mixed environment composed of drivers compatible with Retpoline and drivers not compatible with it, while maintaining the overall system protection against Spectre v2. This implies that drivers that do not support Retpoline should be executed with IBRS on (or STIBP followed by an IBPB on kernel entry, as discussed previously in the “Hardware indirect branch controls” section), whereas others can run without any hardware speculation mitigations enabled (the protection is brought by the Retpoline code sequences and memory fences).
To dynamically achieve compatibility with older drivers, in the phase 0 of its initialization, the NT kernel allocates and initializes a dynamic bitmap that keeps track of each 64 KB chunk that compose the entire kernel address space. In this model, a bit set to 1 indicates that the 64-KB chunk of address space contains Retpoline compatible code; a 0 means the opposite. The NT kernel then sets to 1 the bits referring to the address spaces of the HAL and NT images (which are always Retpoline compatible). Every time a new kernel image is loaded, the system tries to apply Retpoline to it. If the application succeeds, the respective bits in the Retpoline bitmap are set to 1.
The Retpoline code sequence is augmented to include a bitmap check: Every time an indirect branch is performed, the system checks whether the original call target resides in a Retpoline-compatible module. In case the check succeeds (and the relative bit is 1), the system executes the Retpoline code sequence (shown in Figure 8-9) and lands in the target address securely. Otherwise (when the bit in the Retpoline bitmap is 0), a Retpoline exit sequence is initialized. The RUNNING_NON_RETPOLINE_CODE flag is set in the current CPU’s PRCB (needed for context switches), IBRS is enabled (or STIBP, depending on the hardware configuration), an IBPB and LFENCE are emitted if needed, and the SPEC_CONTROL kernel event is generated. Finally, the processor lands on the target address, still in a secure way (hardware mitigations provide the needed protection).
When the thread quantum ends, and the scheduler selects a new thread, it saves the Retpoline status (represented by the presence of the RUNNING_NON_RETPOLINE_CODE flag) of the current processors in the KTHREAD data structure of the old thread. In this way, when the old thread is selected again for execution (or a kernel trap entry happens), the system knows that it needs to re-enable the needed hardware speculation mitigations with the goal of keeping the system always protected.
Import optimization
Retpoline entries in the DVRT also describe indirect branches targeting imported functions. An imported control transfer entry in the DVRT describes this kind of branch by using an index referring to the correct entry in the IAT. (The IAT is the Image Import Address Table, an array of imported functions’ pointers compiled by the loader.) After the Windows loader has compiled the IAT, it is unlikely that its content would have changed (excluding some rare scenarios). As shown in Figure 8-10, it turns out that it is not needed to transform an indirect branch targeting an imported function to a Retpoline one because the NT kernel can ensure that the virtual addresses of the two images (caller and callee) are close enough to directly invoke the target (less than 2 GB).
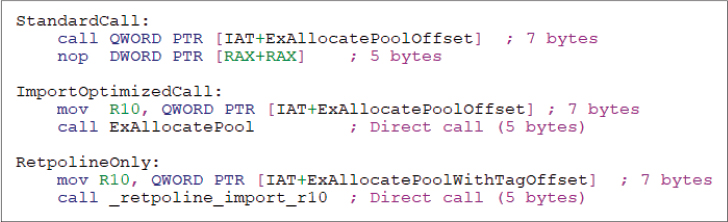
Figure 8-10 Different indirect branches on the ExAllocatePool function.
Import optimization (internally also known as “import linking”) is the feature that uses Retpoline dynamic relocations to transform indirect calls targeting imported functions into direct branches. If a direct branch is used to divert code execution to an imported function, there is no need to apply Retpoline because direct branches are not vulnerable to speculation attacks. The NT kernel applies Import Optimization at the same time it applies Retpoline, and even though the two features can be configured independently, they use the same DVRT entries to work correctly. With Import Optimization, Windows has been able to gain a performance boost even on systems that are not vulnerable to Spectre v2. (A direct branch does not require any additional memory access.)
STIBP pairing
In hyperthreaded systems, for protecting user-mode code against Spectre v2, the system should run user threads with at least STIBP on. On nonhyperthreaded systems, this is not needed: protection against a previous user-mode thread speculation is already achieved thanks to the IBRS being enabled while previously executing kernel-mode code. In case Retpoline is enabled, the needed IBPB is emitted in the first kernel trap return executed after a cross-process thread switch. This ensures that the CPU branch prediction buffer is empty before executing the code of the user thread.
Leaving STIBP enabled in a hyper-threaded system has a performance penalty, so by default it is disabled for user-mode threads, leaving a thread to be potentially vulnerable by speculation from a sibling SMT thread. The end-user can manually enable STIBP for user threads through the USER_STIBP_ALWAYS feature setting (see the “Hardware Indirect Branch Controls” section previously in this chapter for more details) or through the RESTRICT_INDIRECT_BRANCH_PREDICTION process mitigation option.
The described scenario is not ideal. A better solution is implemented in the STIBP pairing mechanism. STIBP pairing is enabled by the I/O manager in phase 1 of the NT kernel initialization (using the KeOptimizeSpecCtrlSettings function) only under certain conditions. The system should have hyperthreading enabled, and the CPU should support IBRS and STIBP. Furthermore, STIBP pairing is compatible only on non-nested virtualized environments or when Hyper-V is disabled (refer to Chapter 9 for further details.)
In an STIBP pairing scenario, the system assigns to each process a security domain identifier (stored in the EPROCESS data structure), which is represented by a 64-bit number. The system security domain identifier (which equals 0) is assigned only to processes running under the System or a fully administrative token. Nonsystem security domains are assigned at process creation time (by the internal PspInitializeProcessSecurity function) following these rules:
■ If the new process is created without a new primary token explicitly assigned to it, it obtains the same security domain of the parent process that creates it.
■ In case a new primary token is explicitly specified for the new process (by using the CreateProcessAsUser or CreateProcessWithLogon APIs, for example), a new user security domain ID is generated for the new process, starting from the internal PsNextSecurityDomain symbol. The latter is incremented every time a new domain ID is generated (this ensures that during the system lifetime, no security domains can collide).
■ Note that a new primary token can be also assigned using the NtSetInformationProcess API (with the ProcessAccessToken information class) after the process has been initially created. For the API to succeed, the process should have been created as suspended (no threads run in it). At this stage, the process still has its original token in an unfrozen state. A new security domain is assigned following the same rules described earlier.
Security domains can also be assigned manually to different processes belonging to the same group. An application can replace the security domain of a process with another one of a process belonging to the same group using the NtSetInformationProcess API with the ProcessCombineSecurityDomainsInformation class. The API accepts two process handles and replaces the security domain of the first process only if the two tokens are frozen, and the two processes can open each other with the PROCESS_VM_WRITE and PROCESS_VM_OPERATION access rights.
Security domains allow the STIBP pairing mechanism to work. STIBP pairing links a logical processor (LP) with its sibling (both share the same physical core. In this section, we use the term LP and CPU interchangeably). Two LPs are paired by the STIBP pairing algorithm (implemented in the internal KiUpdateStibpPairing function) only when the security domain of the local CPU is the same as the one of the remote CPU, or one of the two LPs is Idle. In these cases, both the LPs can run without STIBP being set and still be implicitly protected against speculation (there is no advantage in attacking a sibling CPU running in the same security context).
The STIBP pairing algorithm is implemented in the KiUpdateStibpPairing function and includes a full state machine. The routine is invoked by the trap exit handler (invoked when the system exits the kernel for executing a user-mode thread) only in case the pairing state stored in the CPU’s PRCB is stale. The pairing state of an LP can become stale mainly for two reasons:
■ The NT scheduler has selected a new thread to be executed in the current CPU. If the new thread security domain is different than the previous one, the CPU’s PRCB pairing state is marked as stale. This allows the STIBP pairing algorithm to re-evaluate the pairing state of the two.
■ When the sibling CPU exits from its idle state, it requests the remote CPU to re-evaluate its STIBP pairing state.
Note that when an LP is running code with STIBP enabled, it is protected from the sibling CPU speculation. STIBP pairing has been developed based also on the opposite notion: when an LP executes with STIBP enabled, it is guaranteed that its sibling CPU is protected against itself. This implies that when a context switches to a different security domain, there is no need to interrupt the sibling CPU even though it is running user-mode code with STIBP disabled.
The described scenario is not true only when the scheduler selects a VP-dispatch thread (backing a virtual processor of a VM in case the Root scheduler is enabled; see Chapter 9 for further details) belonging to the VMMEM process. In this case, the system immediately sends an IPI to the sibling thread for updating its STIBP pairing state. Indeed, a VP-dispatch thread runs guest-VM code, which can always decide to disable STIBP, moving the sibling thread in an unprotected state (both runs with STIBP disabled).
Trap dispatching
Interrupts and exceptions are operating system conditions that divert the processor to code outside the normal flow of control. Either hardware or software can generate them. The term trap refers to a processor’s mechanism for capturing an executing thread when an exception or an interrupt occurs and transferring control to a fixed location in the operating system. In Windows, the processor transfers control to a trap handler, which is a function specific to a particular interrupt or exception. Figure 8-11 illustrates some of the conditions that activate trap handlers.
The kernel distinguishes between interrupts and exceptions in the following way. An interrupt is an asynchronous event (one that can occur at any time) that is typically unrelated to what the processor is executing. Interrupts are generated primarily by I/O devices, processor clocks, or timers, and they can be enabled (turned on) or disabled (turned off). An exception, in contrast, is a synchronous condition that usually results from the execution of a specific instruction. (Aborts, such as machine checks, are a type of processor exception that’s typically not associated with instruction execution.) Both exceptions and aborts are sometimes called faults, such as when talking about a page fault or a double fault. Running a program for a second time with the same data under the same conditions can reproduce exceptions. Examples of exceptions include memory-access violations, certain debugger instructions, and divide-by-zero errors. The kernel also regards system service calls as exceptions (although technically they’re system traps).
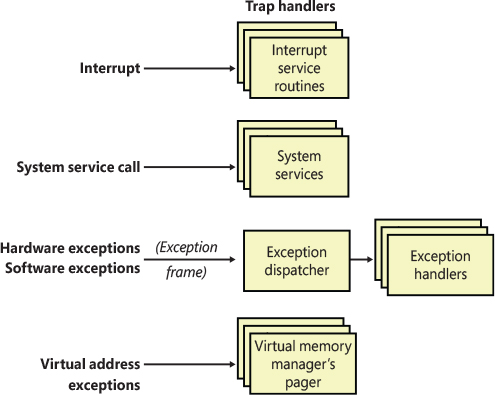
Figure 8-11 Trap dispatching.
Either hardware or software can generate exceptions and interrupts. For example, a bus error exception is caused by a hardware problem, whereas a divide-by-zero exception is the result of a software bug. Likewise, an I/O device can generate an interrupt, or the kernel itself can issue a software interrupt (such as an APC or DPC, both of which are described later in this chapter).
When a hardware exception or interrupt is generated, x86 and x64 processors first check whether the current Code Segment (CS) is in CPL 0 or below (i.e., if the current thread was running in kernel mode or user mode). In the case where the thread was already running in Ring 0, the processor saves (or pushes) on the current stack the following information, which represents a kernel-to-kernel transition.
■ The current processor flags (EFLAGS/RFLAGS)
■ The current code segment (CS)
■ The current program counter (EIP/RIP)
■ Optionally, for certain kind of exceptions, an error code
In situations where the processor was actually running user-mode code in Ring 3, the processor first looks up the current TSS based on the Task Register (TR) and switches to the SS0/ESP0 on x86 or simply RSP0 on x64, as described in the “Task state segments” section earlier in this chapter. Now that the processor is executing on the kernel stack, it saves the previous SS (the user-mode value) and the previous ESP (the user-mode stack) first and then saves the same data as during kernel-to-kernel transitions.
Saving this data has a twofold benefit. First, it records enough machine state on the kernel stack to return to the original point in the current thread’s control flow and continue execution as if nothing had happened. Second, it allows the operating system to know (based on the saved CS value) where the trap came from—for example, to know if an exception came from user-mode code or from a kernel system call.
Because the processor saves only enough information to restore control flow, the rest of the machine state—including registers such as EAX, EBX, ECX, EDI, and so on is saved in a trap frame, a data structure allocated by Windows in the thread’s kernel stack. The trap frame stores the execution state of the thread, and is a superset of a thread’s complete context, with additional state information. You can view its definition by using the dt nt!_KTRAP_FRAME command in the kernel debugger, or, alternatively, by downloading the Windows Driver Kit (WDK) and examining the NTDDK.H header file, which contains the definition with additional commentary. (Thread context is described in Chapter 5 of Part 1.) The kernel handles software interrupts either as part of hardware interrupt handling or synchronously when a thread invokes kernel functions related to the software interrupt.
In most cases, the kernel installs front-end, trap-handling functions that perform general trap-handling tasks before and after transferring control to other functions that field the trap. For example, if the condition was a device interrupt, a kernel hardware interrupt trap handler transfers control to the interrupt service routine (ISR) that the device driver provided for the interrupting device. If the condition was caused by a call to a system service, the general system service trap handler transfers control to the specified system service function in the executive.
In unusual situations, the kernel can also receive traps or interrupts that it doesn’t expect to see or handle. These are sometimes called spurious or unexpected traps. The trap handlers typically execute the system function KeBugCheckEx, which halts the computer when the kernel detects problematic or incorrect behavior that, if left unchecked, could result in data corruption. The following sections describe interrupt, exception, and system service dispatching in greater detail.
Interrupt dispatching
Hardware-generated interrupts typically originate from I/O devices that must notify the processor when they need service. Interrupt-driven devices allow the operating system to get the maximum use out of the processor by overlapping central processing with I/O operations. A thread starts an I/O transfer to or from a device and then can execute other useful work while the device completes the transfer. When the device is finished, it interrupts the processor for service. Pointing devices, printers, keyboards, disk drives, and network cards are generally interrupt driven.
System software can also generate interrupts. For example, the kernel can issue a software interrupt to initiate thread dispatching and to break into the execution of a thread asynchronously. The kernel can also disable interrupts so that the processor isn’t interrupted, but it does so only infrequently—at critical moments while it’s programming an interrupt controller or dispatching an exception, for example.
The kernel installs interrupt trap handlers to respond to device interrupts. Interrupt trap handlers transfer control either to an external routine (the ISR) that handles the interrupt or to an internal kernel routine that responds to the interrupt. Device drivers supply ISRs to service device interrupts, and the kernel provides interrupt-handling routines for other types of interrupts.
In the following subsections, you’ll find out how the hardware notifies the processor of device interrupts, the types of interrupts the kernel supports, how device drivers interact with the kernel (as a part of interrupt processing), and the software interrupts the kernel recognizes (plus the kernel objects that are used to implement them).
Hardware interrupt processing
On the hardware platforms supported by Windows, external I/O interrupts come into one of the inputs on an interrupt controller, for example an I/O Advanced Programmable Interrupt Controller (IOAPIC). The controller, in turn, interrupts one or more processors’ Local Advanced Programmable Interrupt Controllers (LAPIC), which ultimately interrupt the processor on a single input line.
Once the processor is interrupted, it queries the controller to get the global system interrupt vector (GSIV), which is sometimes represented as an interrupt request (IRQ) number. The interrupt controller translates the GSIV to a processor interrupt vector, which is then used as an index into a data structure called the interrupt dispatch table (IDT) that is stored in the CPU’s IDT Register, or IDTR, which returns the matching IDT entry for the interrupt vector.
Based on the information in the IDT entry, the processor can transfer control to an appropriate interrupt dispatch routine running in Ring 0 (following the process described at the start of this section), or it can even load a new TSS and update the Task Register (TR), using a process called an interrupt gate.
In the case of Windows, at system boot time, the kernel fills in the IDT with pointers to both dedicated kernel and HAL routines for each exception and internally handled interrupt, as well as with pointers to thunk kernel routines called KiIsrThunk, that handle external interrupts that third-party device drivers can register for. On x86 and x64-based processor architectures, the first 32 IDT entries, associated with interrupt vectors 0–31 are marked as reserved for processor traps, which are described in Table 8-3.
Table 8-3 Processor traps
Vector (Mnemonic) |
Meaning |
|---|---|
0 (#DE) |
Divide error |
1 (#DB) |
Debug trap |
2 (NMI) |
Nonmaskable interrupt |
3 (#BP) |
Breakpoint trap |
4 (#OF) |
Overflow fault |
5 (#BR) |
Bound fault |
6 (#UD) |
Undefined opcode fault |
7 (#NM) |
FPU error |
8 (#DF) |
Double fault |
9 (#MF) |
Coprocessor fault (no longer used) |
10 (#TS) |
TSS fault |
11 (#NP) |
Segment fault |
12 (#SS) |
Stack fault |
13 (#GP) |
General protection fault |
14 (#PF) |
Page fault |
15 |
Reserved |
16 (#MF) |
Floating point fault |
17 (#AC) |
Alignment check fault |
18 (#MC) |
Machine check abort |
19 (#XM) |
SIMD fault |
20 (#VE) |
Virtualization exception |
21 (#CP) |
Control protection exception |
22-31 |
Reserved |
The remainder of the IDT entries are based on a combination of hardcoded values (for example, vectors 30 to 34 are always used for Hyper-V-related VMBus interrupts) as well as negotiated values between the device drivers, hardware, interrupt controller(s), and platform software such as ACPI. For example, a keyboard controller might send interrupt vector 82 on one particular Windows system and 67 on a different one.
Each processor has a separate IDT (pointed to by their own IDTR) so that different processors can run different ISRs, if appropriate. For example, in a multiprocessor system, each processor receives the clock interrupt, but only one processor updates the system clock in response to this interrupt. All the processors, however, use the interrupt to measure thread quantum and to initiate rescheduling when a thread’s quantum ends. Similarly, some system configurations might require that a particular processor handle certain device interrupts.
Programmable interrupt controller architecture
Traditional x86 systems relied on the i8259A Programmable Interrupt Controller (PIC), a standard that originated with the original IBM PC. The i8259A PIC worked only with uniprocessor systems and had only eight interrupt lines. However, the IBM PC architecture defined the addition of a second PIC, called the secondary, whose interrupts are multiplexed into one of the primary PIC’s interrupt lines. This provided 15 total interrupts (7 on the primary and 8 on the secondary, multiplexed through the master’s eighth interrupt line). Because PICs had such a quirky way of handling more than 8 devices, and because even 15 became a bottleneck, as well as due to various electrical issues (they were prone to spurious interrupts) and the limitations of uniprocessor support, modern systems eventually phased out this type of interrupt controller, replacing it with a variant called the i82489 Advanced Programmable Interrupt Controller (APIC).
Because APICs work with multiprocessor systems, Intel and other companies defined the Multiprocessor Specification (MPS), a design standard for x86 multiprocessor systems that centered on the use of APIC and the integration of both an I/O APIC (IOAPIC) connected to external hardware devices to a Local APIC (LAPIC), connected to the processor core. With time, the MPS standard was folded into the Advanced Configuration and Power Interface (ACPI)—a similar acronym to APIC by chance. To provide compatibility with uniprocessor operating systems and boot code that starts a multiprocessor system in uniprocessor mode, APICs support a PIC compatibility mode with 15 interrupts and delivery of interrupts to only the primary processor. Figure 8-12 depicts the APIC architecture.

Figure 8-12 APIC architecture.
As mentioned, the APIC consists of several components: an I/O APIC that receives interrupts from devices, local APICs that receive interrupts from the I/O APIC on the bus and that interrupt the CPU they are associated with, and an i8259A-compatible interrupt controller that translates APIC input into PIC-equivalent signals. Because there can be multiple I/O APICs on the system, motherboards typically have a piece of core logic that sits between them and the processors. This logic is responsible for implementing interrupt routing algorithms that both balance the device interrupt load across processors and attempt to take advantage of locality, delivering device interrupts to the same processor that has just fielded a previous interrupt of the same type. Software programs can reprogram the I/O APICs with a fixed routing algorithm that bypasses this piece of chipset logic. In most cases, Windows will reprogram the I/O APIC with its own routing logic to support various features such as interrupt steering, but device drivers and firmware also have a say.
Because the x64 architecture is compatible with x86 operating systems, x64 systems must provide the same interrupt controllers as the x86. A significant difference, however, is that the x64 versions of Windows refused to run on systems that did not have an APIC because they use the APIC for interrupt control, whereas x86 versions of Windows supported both PIC and APIC hardware. This changed with Windows 8 and later versions, which only run on APIC hardware regardless of CPU architecture. Another difference on x64 systems is that the APIC’s Task Priority Register, or TPR, is now directly tied to the processor’s Control Register 8 (CR8). Modern operating systems, including Windows, now use this register to store the current software interrupt priority level (in the case of Windows, called the IRQL) and to inform the IOAPIC when it makes routing decisions. More information on IRQL handling will follow shortly.
Software interrupt request levels (IRQLs)
Although interrupt controllers perform interrupt prioritization, Windows imposes its own interrupt priority scheme known as interrupt request levels (IRQLs). The kernel represents IRQLs internally as a number from 0 through 31 on x86 and from 0 to 15 on x64 (and ARM/ARM64), with higher numbers representing higher-priority interrupts. Although the kernel defines the standard set of IRQLs for software interrupts, the HAL maps hardware-interrupt numbers to the IRQLs. Figure 8-13 shows IRQLs defined for the x86 architecture and for the x64 (and ARM/ARM64) architecture.
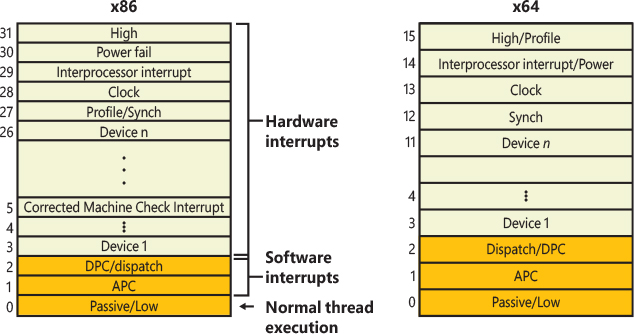
Figure 8-13 x86 and x64 interrupt request levels (IRQLs).
Interrupts are serviced in priority order, and a higher-priority interrupt preempts the servicing of a lower-priority interrupt. When a high-priority interrupt occurs, the processor saves the interrupted thread’s state and invokes the trap dispatchers associated with the interrupt. The trap dispatcher raises the IRQL and calls the interrupt’s service routine. After the service routine executes, the interrupt dispatcher lowers the processor’s IRQL to where it was before the interrupt occurred and then loads the saved machine state. The interrupted thread resumes executing where it left off. When the kernel lowers the IRQL, lower-priority interrupts that were masked might materialize. If this happens, the kernel repeats the process to handle the new interrupts.
IRQL priority levels have a completely different meaning than thread-scheduling priorities (which are described in Chapter 5 of Part 1). A scheduling priority is an attribute of a thread, whereas an IRQL is an attribute of an interrupt source, such as a keyboard or a mouse. In addition, each processor has an IRQL setting that changes as operating system code executes. As mentioned earlier, on x64 systems, the IRQL is stored in the CR8 register that maps back to the TPR on the APIC.
Each processor’s IRQL setting determines which interrupts that processor can receive. IRQLs are also used to synchronize access to kernel-mode data structures. (You’ll find out more about synchronization later in this chapter.) As a kernel-mode thread runs, it raises or lowers the processor’s IRQL directly by calling KeRaiseIrql and KeLowerIrql or, more commonly, indirectly via calls to functions that acquire kernel synchronization objects. As Figure 8-14 illustrates, interrupts from a source with an IRQL above the current level interrupt the processor, whereas interrupts from sources with IRQLs equal to or below the current level are masked until an executing thread lowers the IRQL.
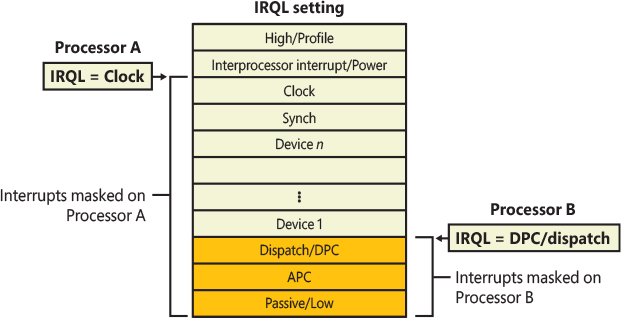
Figure 8-14 Masking interrupts.
A kernel-mode thread raises and lowers the IRQL of the processor on which it’s running, depending on what it’s trying to do. For example, when an interrupt occurs, the trap handler (or perhaps the processor, depending on its architecture) raises the processor’s IRQL to the assigned IRQL of the interrupt source. This elevation masks all interrupts at and below that IRQL (on that processor only), which ensures that the processor servicing the interrupt isn’t waylaid by an interrupt at the same level or a lower level. The masked interrupts are either handled by another processor or held back until the IRQL drops. Therefore, all components of the system, including the kernel and device drivers, attempt to keep the IRQL at passive level (sometimes called low level). They do this because device drivers can respond to hardware interrupts in a timelier manner if the IRQL isn’t kept unnecessarily elevated for long periods. Thus, when the system is not performing any interrupt work (or needs to synchronize with it) or handling a software interrupt such as a DPC or APC, the IRQL is always 0. This obviously includes any user-mode processing because allowing user-mode code to touch the IRQL would have significant effects on system operation. In fact, returning to a user-mode thread with the IRQL above 0 results in an immediate system crash (bugcheck) and is a serious driver bug.
Finally, note that dispatcher operations themselves—such as context switching from one thread to another due to preemption—run at IRQL 2 (hence the name dispatch level), meaning that the processor behaves in a single-threaded, cooperative fashion at this level and above. It is, for example, illegal to wait on a dispatcher object (more on this in the “Synchronization” section that follows) at this IRQL, as a context switch to a different thread (or the idle thread) would never occur. Another restriction is that only nonpaged memory can be accessed at IRQL DPC/dispatch level or higher.
This rule is actually a side effect of the first restriction because attempting to access memory that isn’t resident results in a page fault. When a page fault occurs, the memory manager initiates a disk I/O and then needs to wait for the file system driver to read the page in from disk. This wait would, in turn, require the scheduler to perform a context switch (perhaps to the idle thread if no user thread is waiting to run), thus violating the rule that the scheduler can’t be invoked (because the IRQL is still DPC/dispatch level or higher at the time of the disk read). A further problem results in the fact that I/O completion typically occurs at APC_LEVEL, so even in cases where a wait wouldn’t be required, the I/O would never complete because the completion APC would not get a chance to run.
If either of these two restrictions is violated, the system crashes with an IRQL_NOT_LESS_OR_EQUAL or a DRIVER_IRQL_NOT_LESS_OR_EQUAL crash code. (See Chapter 10, “Management, diagnostics, and tracing” for a thorough discussion of system crashes.) Violating these restrictions is a common bug in device drivers. The Windows Driver Verifier has an option you can set to assist in finding this particular type of bug.
Conversely, this also means that when working at IRQL 1 (also called APC level), preemption is still active and context switching can occur. This makes IRQL 1 essentially behave as a thread-local IRQL instead of a processor-local IRQL, since a wait operation or preemption operation at IRQL 1 will cause the scheduler to save the current IRQL in the thread’s control block (in the KTHREAD structure, as seen in Chapter 5), and restore the processor’s IRQL to that of the newly executed thread. This means that a thread at passive level (IRQL 0) can still preempt a thread running at APC level (IRQL 1), because below IRQL 2, the scheduler decides which thread controls the processor.
Mapping interrupt vectors to IRQLs
On systems without an APIC-based architecture, the mapping between the GSIV/IRQ and the IRQL had to be strict. To avoid situations where the interrupt controller might think an interrupt line is of higher priority than another, when in Windows’s world, the IRQLs reflected an opposite situation. Thankfully, with APICs, Windows can easily expose the IRQL as part of the APIC’s TPR, which in turn can be used by the APIC to make better delivery decisions. Further, on APIC systems, the priority of each hardware interrupt is not tied to its GSIV/IRQ, but rather to the interrupt vector: the upper 4 bits of the vector map back to the priority. Since the IDT can have up to 256 entries, this gives a space of 16 possible priorities (for example, vector 0x40 would be priority 4), which are the same 16 numbers that the TPR can hold, which map back to the same 16 IRQLs that Windows implements!
Therefore, for Windows to determine what IRQL to assign to an interrupt, it must first determine the appropriate interrupt vector for the interrupt, and program the IOAPIC to use that vector for the associated hardware GSIV. Or, conversely, if a specific IRQL is needed for a hardware device, Windows must choose an interrupt vector that maps back to that priority. These decisions are performed by the Plug and Play manager working in concert with a type of device driver called a bus driver, which determines the presence of devices on its bus (PCI, USB, and so on) and what interrupts can be assigned to a device. The bus driver reports this information to the Plug and Play manager, which decides—after taking into account the acceptable interrupt assignments for all other devices—which interrupt will be assigned to each device. Then it calls a Plug and Play interrupt arbiter, which maps interrupts to IRQLs. This arbiter is exposed by the HAL, which also works with the ACPI bus driver and the PCI bus driver to collectively determine the appropriate mapping. In most cases, the ultimate vector number is selected in a round-robin fashion, so there is no computable way to figure it out ahead of time. However, an experiment later in this section shows how the debugger can query this information from the interrupt arbiter.
Outside of arbitered interrupt vectors associated with hardware interrupts, Windows also has a number of predefined interrupt vectors that are always at the same index in the IDT, which are defined in Table 8-4.
Table 8-4 Predefined interrupt vectors
Vector |
Usage |
|---|---|
0x1F |
APC interrupt |
0x2F |
DPC interrupt |
0x30 |
Hypervisor interrupt |
0x31-0x34 |
VMBus interrupt(s) |
0x35 |
CMCI interrupt |
0xCD |
Thermal interrupt |
0xCE |
IOMMU interrupt |
0xCF |
DMA interrupt |
0xD1 |
Clock timer interrupt |
0xD2 |
Clock IPI interrupt |
0xD3 |
Clock always on interrupt |
0xD7 |
Reboot Interrupt |
0xD8 |
Stub interrupt |
0xD9 |
Test interrupt |
0xDF |
Spurious interrupt |
0xE1 |
IPI interrupt |
0xE2 |
LAPIC error interrupt |
0xE3 |
DRS interrupt |
0xF0 |
Watchdog interrupt |
0xFB |
Hypervisor HPET interrupt |
0xFD |
Profile interrupt |
0xFE |
Performance interrupt |
You’ll note that the vector number’s priority (recall that this is stored in the upper 4 bits, or nibble) typically matches the IRQLs shown in the Figure 8-14—for example, the APC interrupt is 1, the DPC interrupt is 2, while the IPI interrupt is 14, and the profile interrupt is 15. On this topic, let’s see what the predefined IRQLs are on a modern Windows system.
Predefined IRQLs
Let’s take a closer look at the use of the predefined IRQLs, starting from the highest level shown in Figure 8-13:
■ The kernel typically uses high level only when it’s halting the system in KeBugCheckEx and masking out all interrupts or when a remote kernel debugger is attached. The profile level shares the same value on non-x86 systems, which is where the profile timer runs when this functionality is enabled. The performance interrupt, associated with such features as Intel Processor Trace (Intel PT) and other hardware performance monitoring unit (PMU) capabilities, also runs at this level.
■ Interprocessor interrupt level is used to request another processor to perform an action, such as updating the processor’s TLB cache or modifying a control register on all processors. The Deferred Recovery Service (DRS) level also shares the same value and is used on x64 systems by the Windows Hardware Error Architecture (WHEA) for performing recovery from certain Machine Check Errors (MCE).
■ Clock level is used for the system’s clock, which the kernel uses to track the time of day as well as to measure and allot CPU time to threads.
■ The synchronization IRQL is internally used by the dispatcher and scheduler code to protect access to global thread scheduling and wait/synchronization code. It is typically defined as the highest level right after the device IRQLs.
■ The device IRQLs are used to prioritize device interrupts. (See the previous section for how hardware interrupt levels are mapped to IRQLs.)
■ The corrected machine check interrupt level is used to signal the operating system after a serious but corrected hardware condition or error that was reported by the CPU or firmware through the Machine Check Error (MCE) interface.
■ DPC/dispatch-level and APC-level interrupts are software interrupts that the kernel and device drivers generate. (DPCs and APCs are explained in more detail later in this chapter.)
■ The lowest IRQL, passive level, isn’t really an interrupt level at all; it’s the setting at which normal thread execution takes place and all interrupts can occur.
Interrupt objects
The kernel provides a portable mechanism—a kernel control object called an interrupt object, or KINTERRUPT—that allows device drivers to register ISRs for their devices. An interrupt object contains all the information the kernel needs to associate a device ISR with a particular hardware interrupt, including the address of the ISR, the polarity and trigger mode of the interrupt, the IRQL at which the device interrupts, sharing state, the GSIV and other interrupt controller data, as well as a host of performance statistics.
These interrupt objects are allocated from a common pool of memory, and when a device driver registers an interrupt (with IoConnectInterrupt or IoConnectInterruptEx), one is initialized with all the necessary information. Based on the number of processors eligible to receive the interrupt (which is indicated by the device driver when specifying the interrupt affinity), a KINTERRUPT object is allocated for each one—in the typical case, this means for every processor on the machine. Next, once an interrupt vector has been selected, an array in the KPRCB (called InterruptObject) of each eligible processor is updated to point to the allocated KINTERRUPT object that’s specific to it.
As the KINTERRUPT is allocated, a check is made to validate whether the chosen interrupt vector is a shareable vector, and if so, whether an existing KINTERRUPT has already claimed the vector. If yes, the kernel updates the DispatchAddress field (of the KINTERRUPT data structure) to point to the function KiChainedDispatch and adds this KINTERRUPT to a linked list (InterruptListEntry) contained in the first existing KINTERRUPT already associated with the vector. If this is an exclusive vector, on the other hand, then KiInterruptDispatch is used instead.
The interrupt object also stores the IRQL associated with the interrupt so that KiInterruptDispatch or KiChainedDispatch can raise the IRQL to the correct level before calling the ISR and then lower the IRQL after the ISR has returned. This two-step process is required because there’s no way to pass a pointer to the interrupt object (or any other argument for that matter) on the initial dispatch because the initial dispatch is done by hardware.
When an interrupt occurs, the IDT points to one of 256 copies of the KiIsrThunk function, each one having a different line of assembly code that pushes the interrupt vector on the kernel stack (because this is not provided by the processor) and then calling a shared KiIsrLinkage function, which does the rest of the processing. Among other things, the function builds an appropriate trap frame as explained previously, and eventually calls the dispatch address stored in the KINTERRUPT (one of the two functions above). It finds the KINTERRUPT by reading the current KPRCB’s InterruptObject array and using the interrupt vector on the stack as an index, dereferencing the matching pointer. On the other hand, if a KINTERRUPT is not present, then this interrupt is treated as an unexpected interrupt. Based on the value of the registry value BugCheckUnexpectedInterrupts in the HKLMSYSTEMCurrentControlSetControlSession ManagerKernel key, the system might either crash with KeBugCheckEx, or the interrupt is silently ignored, and execution is restored back to the original control point.
On x64 Windows systems, the kernel optimizes interrupt dispatch by using specific routines that save processor cycles by omitting functionality that isn’t needed, such as KiInterruptDispatchNoLock, which is used for interrupts that do not have an associated kernel-managed spinlock (typically used by drivers that want to synchronize with their ISRs), KiInterruptDispatchNoLockNoEtw for interrupts that do not want ETW performance tracing, and KiSpuriousDispatchNoEOI for interrupts that are not required to send an end-of-interrupt signal since they are spurious.
Finally, KiInterruptDispatchNoEOI, which is used for interrupts that have programmed the APIC in Auto-End-of-Interrupt (Auto-EOI) mode—because the interrupt controller will send the EOI signal automatically, the kernel does not need the extra code to perform the EOI itself. For example, many HAL interrupt routines take advantage of the “no-lock” dispatch code because the HAL does not require the kernel to synchronize with its ISR.
Another kernel interrupt handler is KiFloatingDispatch, which is used for interrupts that require saving the floating-point state. Unlike kernel-mode code, which typically is not allowed to use floating-point (MMX, SSE, 3DNow!) operations because these registers won’t be saved across context switches, ISRs might need to use these registers (such as the video card ISR performing a quick drawing operation). When connecting an interrupt, drivers can set the FloatingSave argument to TRUE, requesting that the kernel use the floating-point dispatch routine, which will save the floating registers. (However, this greatly increases interrupt latency.) Note that this is supported only on 32-bit systems.
Regardless of which dispatch routine is used, ultimately a call to the ServiceRoutine field in the KINTERRUPT will be made, which is where the driver’s ISR is stored. Alternatively, for message signaled interrupts (MSI), which are explained later, this is a pointer to KiInterruptMessageDispatch, which will then call the MessageServiceRoutine pointer in KINTERRUPT instead. Note that in some cases, such as when dealing with Kernel Mode Driver Framework (KMDF) drivers, or certain miniport drivers such as those based on NDIS or StorPort (more on driver frameworks is explained in Chapter 6 of Part 1, “I/O system”), these routines might be specific to the framework and/or port driver, which will do further processing before calling the final underlying driver.
Figure 8-15 shows typical interrupt control flow for interrupts associated with interrupt objects.
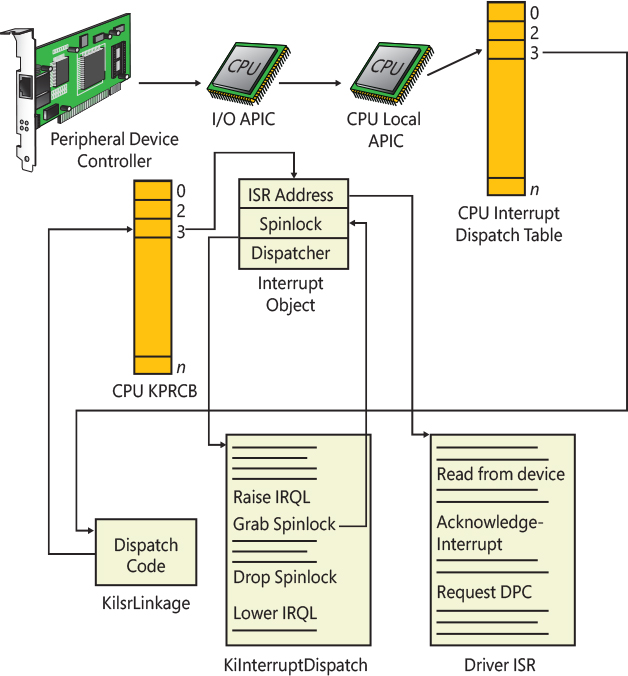
Figure 8-15 Typical interrupt control flow.
Associating an ISR with a particular level of interrupt is called connecting an interrupt object, and dissociating an ISR from an IDT entry is called disconnecting an interrupt object. These operations, accomplished by calling the kernel functions IoConnectInterruptEx and IoDisconnectInterruptEx, allow a device driver to “turn on” an ISR when the driver is loaded into the system and to “turn off” the ISR if the driver is unloaded.
As was shown earlier, using the interrupt object to register an ISR prevents device drivers from fiddling directly with interrupt hardware (which differs among processor architectures) and from needing to know any details about the IDT. This kernel feature aids in creating portable device drivers because it eliminates the need to code in assembly language or to reflect processor differences in device drivers. Interrupt objects provide other benefits as well. By using the interrupt object, the kernel can synchronize the execution of the ISR with other parts of a device driver that might share data with the ISR. (See Chapter 6 in Part 1 for more information about how device drivers respond to interrupts.)
We also described the concept of a chained dispatch, which allows the kernel to easily call more than one ISR for any interrupt level. If multiple device drivers create interrupt objects and connect them to the same IDT entry, the KiChainedDispatch routine calls each ISR when an interrupt occurs at the specified interrupt line. This capability allows the kernel to easily support daisy-chain configurations, in which several devices share the same interrupt line. The chain breaks when one of the ISRs claims ownership for the interrupt by returning a status to the interrupt dispatcher.
If multiple devices sharing the same interrupt require service at the same time, devices not acknowledged by their ISRs will interrupt the system again once the interrupt dispatcher has lowered the IRQL. Chaining is permitted only if all the device drivers wanting to use the same interrupt indicate to the kernel that they can share the interrupt (indicated by the ShareVector field in the KINTERRUPT object); if they can’t, the Plug and Play manager reorganizes their interrupt assignments to ensure that it honors the sharing requirements of each.
Line-based versus message signaled–based interrupts
Shared interrupts are often the cause of high interrupt latency and can also cause stability issues. They are typically undesirable and a side effect of the limited number of physical interrupt lines on a computer. For example, in the case of a 4-in-1 media card reader that can handle USB, Compact Flash, Sony Memory Stick, Secure Digital, and other formats, all the controllers that are part of the same physical device would typically be connected to a single interrupt line, which is then configured by the different device drivers as a shared interrupt vector. This adds latency as each one is called in a sequence to determine the actual controller that is sending the interrupt for the media device.
A much better solution is for each device controller to have its own interrupt and for one driver to manage the different interrupts, knowing which device they came from. However, consuming four traditional IRQ lines for a single device quickly leads to IRQ line exhaustion. Additionally, PCI devices are each connected to only one IRQ line anyway, so the media card reader cannot use more than one IRQ in the first place even if it wanted to.
Other problems with generating interrupts through an IRQ line is that incorrect management of the IRQ signal can lead to interrupt storms or other kinds of deadlocks on the machine because the signal is driven “high” or “low” until the ISR acknowledges it. (Furthermore, the interrupt controller must typically receive an EOI signal as well.) If either of these does not happen due to a bug, the system can end up in an interrupt state forever, further interrupts could be masked away, or both. Finally, line-based interrupts provide poor scalability in multiprocessor environments. In many cases, the hardware has the final decision as to which processor will be interrupted out of the possible set that the Plug and Play manager selected for this interrupt, and device drivers can do little about it.
A solution to all these problems was first introduced in the PCI 2.2 standard called message-signaled interrupts (MSI). Although it was an optional component of the standard that was seldom found in client machines (and mostly found on servers for network card and storage controller performance), most modern systems, thanks to PCI Express 3.0 and later, fully embrace this model. In the MSI world, a device delivers a message to its driver by writing to a specific memory address over the PCI bus; in fact, this is essentially treated like a Direct Memory Access (DMA) operation as far as hardware is concerned. This action causes an interrupt, and Windows then calls the ISR with the message content (value) and the address where the message was delivered. A device can also deliver multiple messages (up to 32) to the memory address, delivering different payloads based on the event.
For even more performance and latency-sensitive systems, MSI-X, an extension to the MSI model, which is introduced in PCI 3.0, adds support for 32-bit messages (instead of 16-bit), a maximum of 2048 different messages (instead of just 32), and more importantly, the ability to use a different address (which can be dynamically determined) for each of the MSI payloads. Using a different address allows the MSI payload to be written to a different physical address range that belongs to a different processor, or a different set of target processors, effectively enabling nonuniform memory access (NUMA)-aware interrupt delivery by sending the interrupt to the processor that initiated the related device request. This improves latency and scalability by monitoring both load and the closest NUMA node during interrupt completion.
In either model, because communication is based across a memory value, and because the content is delivered with the interrupt, the need for IRQ lines is removed (making the total system limit of MSIs equal to the number of interrupt vectors, not IRQ lines), as is the need for a driver ISR to query the device for data related to the interrupt, decreasing latency. Due to the large number of device interrupts available through this model, this effectively nullifies any benefit of sharing interrupts, decreasing latency further by directly delivering the interrupt data to the concerned ISR.
This is also one of the reasons why you’ve seen this text, as well as most of the debugger commands, utilize the term “GSIV” instead of IRQ because it more generically describes an MSI vector (which is identified by a negative number), a traditional IRQ-based line, or even a General Purpose Input Output (GPIO) pin on an embedded device. And, additionally, on ARM and ARM64 systems, neither of these models are used, and a Generic Interrupt Controller, or GIC, architecture is leveraged instead. In Figure 8-16, you can see the Device Manager on two computer systems showing both traditional IRQ-based GSIV assignments, as well as MSI values, which are negative.
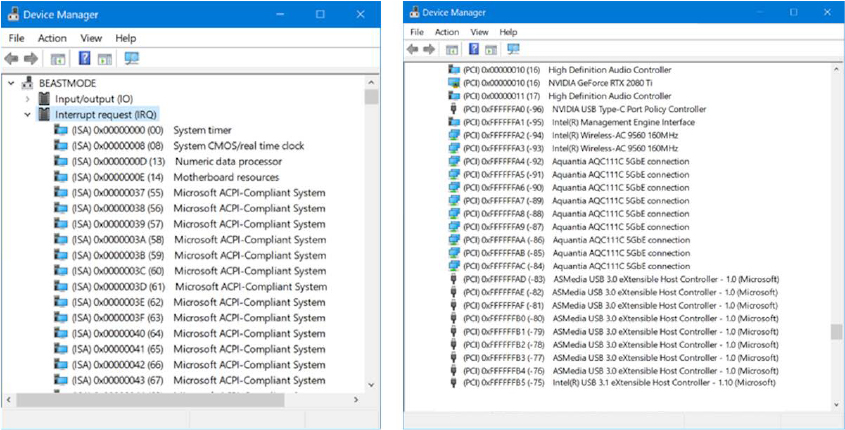
Figure 8-16 IRQ and MSI-based GSIV assignment.
Interrupt steering
On client (that is, excluding Server SKUs) systems that are not running virtualized, and which have between 2 and 16 processors in a single processor group, Windows enables a piece of functionality called interrupt steering to help with power and latency needs on modern consumer systems. Thanks to this feature, interrupt load can be spread across processors as needed to avoid bottlenecking a single CPU, and the core parking engine, which was described in Chapter 6 of Part 1, can also steer interrupts away from parked cores to avoid interrupt distribution from keeping too many processors awake at the same time.
Interrupt steering capabilities are dependent on interrupt controllers— for example, on ARM systems with a GIC, both level sensitive and edge (latched) triggered interrupts can be steered, whereas on APIC systems (unless running under Hyper-V), only level-sensitive interrupts can be steered. Unfortunately, because MSIs are always level edge-triggered, this would reduce the benefits of the technology, which is why Windows also implements an additional interrupt redirection model to handle these situations.
When steering is enabled, the interrupt controller is simply reprogrammed to deliver the GSIV to a different processor’s LAPIC (or equivalent in the ARM GIC world). When redirection must be used, then all processors are delivery targets for the GSIV, and whichever processor received the interrupt manually issues an IPI to the target processor to which the interrupt should be steered toward.
Outside of the core parking engine’s use of interrupt steering, Windows also exposes the functionality through a system information class that is handled by KeIntSteerAssignCpuSetForGsiv as part of the Real-Time Audio capabilities of Windows 10 and the CPU Set feature that was described in the “Thread scheduling” section in Chapter 4 of Part 1. This allows a particular GSIV to be steered to a specific group of processors that can be chosen by the user-mode application, as long as it has the Increase Base Priority privilege, which is normally only granted to administrators or local service accounts.
Interrupt affinity and priority
Windows enables driver developers and administrators to somewhat control the processor affinity (selecting the processor or group of processors that receives the interrupt) and affinity policy (selecting how processors will be chosen and which processors in a group will be chosen). Furthermore, it enables a primitive mechanism of interrupt prioritization based on IRQL selection. Affinity policy is defined according to Table 8-5, and it’s configurable through a registry value called InterruptPolicyValue in the Interrupt ManagementAffinity Policy key under the device’s instance key in the registry. Because of this, it does not require any code to configure—an administrator can add this value to a given driver’s key to influence its behavior. Interrupt affinity is documented on Microsoft Docs at https://docs.microsoft.com/en-us/windows-hardware/drivers/kernel/interrupt-affinity-and-priority.
Table 8-5 IRQ affinity policies
Policy |
Meaning |
|---|---|
IrqPolicyMachineDefault |
The device does not require a particular affinity policy. Windows uses the default machine policy, which (for machines with less than eight logical processors) is to select any available processor on the machine. |
IrqPolicyAllCloseProcessors |
On a NUMA machine, the Plug and Play manager assigns the interrupt to all the processors that are close to the device (on the same node). On non-NUMA machines, this is the same as IrqPolicyAllProcessorsInMachine. |
IrqPolicyOneCloseProcessor |
On a NUMA machine, the Plug and Play manager assigns the interrupt to one processor that is close to the device (on the same node). On non-NUMA machines, the chosen processor will be any available processor on the system. |
IrqPolicyAllProcessorsInMachine |
The interrupt is processed by any available processor on the machine. |
IrqPolicySpecifiedProcessors |
The interrupt is processed only by one of the processors specified in the affinity mask under the AssignmentSetOverride registry value. |
IrqPolicySpreadMessagesAcrossAllProcessors |
Different message-signaled interrupts are distributed across an optimal set of eligible processors, keeping track of NUMA topology issues, if possible. This requires MSI-X support on the device and platform. |
IrqPolicyAllProcessorsInGroupWhenSteered |
The interrupt is subject to interrupt steering, and as such, the interrupt should be assigned to all processor IDTs as the target processor will be dynamically selected based on steering rules. |
Other than setting this affinity policy, another registry value can also be used to set the interrupt’s priority, based on the values in Table 8-6.
Table 8-6 IRQ priorities
Priority |
Meaning |
|---|---|
IrqPriorityUndefined |
No particular priority is required by the device. It receives the default priority (IrqPriorityNormal). |
IrqPriorityLow |
The device can tolerate high latency and should receive a lower IRQL than usual (3 or 4). |
IrqPriorityNormal |
The device expects average latency. It receives the default IRQL associated with its interrupt vector (5 to 11). |
IrqPriorityHigh |
The device requires as little latency as possible. It receives an elevated IRQL beyond its normal assignment (12). |
As discussed earlier, it is important to note that Windows is not a real-time operating system, and as such, these IRQ priorities are hints given to the system that control only the IRQL associated with the interrupt and provide no extra priority other than the Windows IRQL priority-scheme mechanism. Because the IRQ priority is also stored in the registry, administrators are free to set these values for drivers should there be a requirement of lower latency for a driver not taking advantage of this feature.
Software interrupts
Although hardware generates most interrupts, the Windows kernel also generates software interrupts for a variety of tasks, including these:
■ Initiating thread dispatching
■ Non-time-critical interrupt processing
■ Handling timer expiration
■ Asynchronously executing a procedure in the context of a particular thread
■ Supporting asynchronous I/O operations
These tasks are described in the following subsections.
Dispatch or deferred procedure call (DPC) interrupts
A DPC is typically an interrupt-related function that performs a processing task after all device interrupts have already been handled. The functions are called deferred because they might not execute immediately. The kernel uses DPCs to process timer expiration (and release threads waiting for the timers) and to reschedule the processor after a thread’s quantum expires (note that this happens at DPC IRQL but not really through a regular kernel DPC). Device drivers use DPCs to process interrupts and perform actions not available at higher IRQLs. To provide timely service for hardware interrupts, Windows—with the cooperation of device drivers—attempts to keep the IRQL below device IRQL levels. One way that this goal is achieved is for device driver ISRs to perform the minimal work necessary to acknowledge their device, save volatile interrupt state, and defer data transfer or other less time-critical interrupt processing activity for execution in a DPC at DPC/dispatch IRQL. (See Chapter 6 in Part 1 for more information on the I/O system.)
In the case where the IRQL is passive or at APC level, DPCs will immediately execute and block all other non-hardware-related processing, which is why they are also often used to force immediate execution of high-priority system code. Thus, DPCs provide the operating system with the capability to generate an interrupt and execute a system function in kernel mode. For example, when a thread can no longer continue executing, perhaps because it has terminated or because it voluntarily enters a wait state, the kernel calls the dispatcher directly to perform an immediate context switch. Sometimes, however, the kernel detects that rescheduling should occur when it is deep within many layers of code. In this situation, the kernel requests dispatching but defers its occurrence until it completes its current activity. Using a DPC software interrupt is a convenient way to achieve this delayed processing.
The kernel always raises the processor’s IRQL to DPC/dispatch level or above when it needs to synchronize access to scheduling-related kernel structures. This disables additional software interrupts and thread dispatching. When the kernel detects that dispatching should occur, it requests a DPC/dispatch-level interrupt; but because the IRQL is at or above that level, the processor holds the interrupt in check. When the kernel completes its current activity, it sees that it will lower the IRQL below DPC/dispatch level and checks to see whether any dispatch interrupts are pending. If there are, the IRQL drops to DPC/dispatch level, and the dispatch interrupts are processed. Activating the thread dispatcher by using a software interrupt is a way to defer dispatching until conditions are right. A DPC is represented by a DPC object, a kernel control object that is not visible to user-mode programs but is visible to device drivers and other system code. The most important piece of information the DPC object contains is the address of the system function that the kernel will call when it processes the DPC interrupt. DPC routines that are waiting to execute are stored in kernel-managed queues, one per processor, called DPC queues. To request a DPC, system code calls the kernel to initialize a DPC object and then places it in a DPC queue.
By default, the kernel places DPC objects at the end of one of two DPC queues belonging to the processor on which the DPC was requested (typically the processor on which the ISR executed). A device driver can override this behavior, however, by specifying a DPC priority (low, medium, medium-high, or high, where medium is the default) and by targeting the DPC at a particular processor. A DPC aimed at a specific CPU is known as a targeted DPC. If the DPC has a high priority, the kernel inserts the DPC object at the front of the queue; otherwise, it is placed at the end of the queue for all other priorities.
When the processor’s IRQL is about to drop from an IRQL of DPC/dispatch level or higher to a lower IRQL (APC or passive level), the kernel processes DPCs. Windows ensures that the IRQL remains at DPC/dispatch level and pulls DPC objects off the current processor’s queue until the queue is empty (that is, the kernel “drains” the queue), calling each DPC function in turn. Only when the queue is empty will the kernel let the IRQL drop below DPC/dispatch level and let regular thread execution continue. DPC processing is depicted in Figure 8-17.
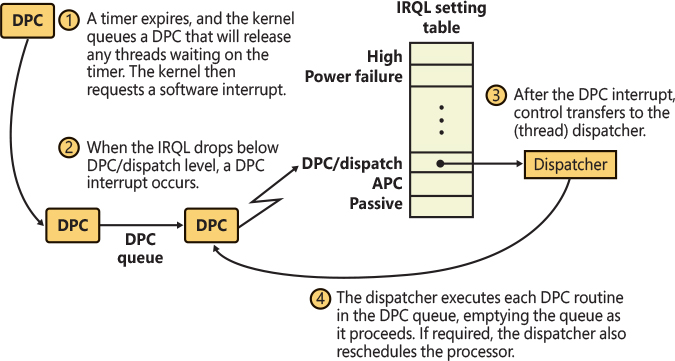
Figure 8-17 Delivering a DPC.
DPC priorities can affect system behavior another way. The kernel usually initiates DPC queue draining with a DPC/dispatch-level interrupt. The kernel generates such an interrupt only if the DPC is directed at the current processor (the one on which the ISR executes) and the DPC has a priority higher than low. If the DPC has a low priority, the kernel requests the interrupt only if the number of outstanding DPC requests (stored in the DpcQueueDepth field of the KPRCB) for the processor rises above a threshold (called MaximumDpcQueueDepth in the KPRCB) or if the number of DPCs requested on the processor within a time window is low.
If a DPC is targeted at a CPU different from the one on which the ISR is running and the DPC’s priority is either high or medium-high, the kernel immediately signals the target CPU (by sending it a dispatch IPI) to drain its DPC queue, but only as long as the target processor is idle. If the priority is medium or low, the number of DPCs queued on the target processor (this being the DpcQueueDepth again) must exceed a threshold (the MaximumDpcQueueDepth) for the kernel to trigger a DPC/dispatch interrupt. The system idle thread also drains the DPC queue for the processor it runs on. Although DPC targeting and priority levels are flexible, device drivers rarely need to change the default behavior of their DPC objects. Table 8-7 summarizes the situations that initiate DPC queue draining. Medium-high and high appear, and are, in fact, equal priorities when looking at the generation rules. The difference comes from their insertion in the list, with high interrupts being at the head and medium-high interrupts at the tail.
Table 8-7 DPC interrupt generation rules
DPC Priority |
DPC Targeted at ISR’s Processor |
DPC Targeted at Another Processor |
|---|---|---|
Low |
DPC queue length exceeds maximum DPC queue length, or DPC request rate is less than minimum DPC request rate |
DPC queue length exceeds maximum DPC queue length, or system is idle |
Medium |
Always |
DPC queue length exceeds maximum DPC queue length, or system is idle |
Medium-High |
Always |
Target processor is idle |
High |
Always |
Target processor is idle |
Additionally, Table 8-8 describes the various DPC adjustment variables and their default values, as well as how they can be modified through the registry. Outside of the registry, these values can also be set by using the SystemDpcBehaviorInformation system information class.
Table 8-8 DPC interrupt generation variables
Variable |
Definition |
Default |
Override Value |
|---|---|---|---|
KiMaximumDpcQueueDepth |
Number of DPCs queued before an interrupt will be sent even for Medium or below DPCs |
4 |
DpcQueueDepth |
KiMinimumDpcRate |
Number of DPCs per clock tick where low DPCs will not cause a local interrupt to be generated |
3 |
MinimumDpcRate |
KiIdealDpcRate |
Number of DPCs per clock tick before the maximum DPC queue depth is decremented if DPCs are pending but no interrupt was generated |
20 |
IdealDpcRate |
KiAdjustDpcThreshold |
Number of clock ticks before the maximum DPC queue depth is incremented if DPCs aren’t pending |
20 |
AdjustDpcThreshold |
Because user-mode threads execute at low IRQL, the chances are good that a DPC will interrupt the execution of an ordinary user’s thread. DPC routines execute without regard to what thread is running, meaning that when a DPC routine runs, it can’t assume what process address space is currently mapped. DPC routines can call kernel functions, but they can’t call system services, generate page faults, or create or wait for dispatcher objects (explained later in this chapter). They can, however, access nonpaged system memory addresses, because system address space is always mapped regardless of what the current process is.
Because all user-mode memory is pageable and the DPC executes in an arbitrary process context, DPC code should never access user-mode memory in any way. On systems that support Supervisor Mode Access Protection (SMAP) or Privileged Access Neven (PAN), Windows activates these features for the duration of the DPC queue processing (and routine execution), ensuring that any user-mode memory access will immediately result in a bugcheck.
Another side effect of DPCs interrupting the execution of threads is that they end up “stealing” from the run time of the thread; while the scheduler thinks that the current thread is executing, a DPC is executing instead. In Chapter 4, Part 1, we discussed mechanisms that the scheduler uses to make up for this lost time by tracking the precise number of CPU cycles that a thread has been running and deducting DPC and ISR time, when applicable.
While this ensures the thread isn’t penalized in terms of its quantum, it does still mean that from the user’s perspective, the wall time (also sometimes called clock time—the real-life passage of time) is still being spent on something else. Imagine a user currently streaming their favorite song off the Internet: If a DPC were to take 2 seconds to run, those 2 seconds would result in the music skipping or repeating in a small loop. Similar impacts can be felt on video streaming or even keyboard and mouse input. Because of this, DPCs are a primary cause for perceived system unresponsiveness of client systems or workstation workloads because even the highest-priority thread will be interrupted by a running DPC. For the benefit of drivers with long-running DPCs, Windows supports threaded DPCs. Threaded DPCs, as their name implies, function by executing the DPC routine at passive level on a real-time priority (priority 31) thread. This allows the DPC to preempt most user-mode threads (because most application threads don’t run at real-time priority ranges), but it allows other interrupts, nonthreaded DPCs, APCs, and other priority 31 threads to preempt the routine.
The threaded DPC mechanism is enabled by default, but you can disable it by adding a DWORD value named ThreadDpcEnable in the HKEY_LOCAL_MACHINESystemCurrentControlSetControlSession ManagerKernel key, and setting it to 0. A threaded DPC must be initialized by a developer through the KeInitializeThreadedDpc API, which sets the DPC internal type to ThreadedDpcObject. Because threaded DPCs can be disabled, driver developers who make use of threaded DPCs must write their routines following the same rules as for nonthreaded DPC routines and cannot access paged memory, perform dispatcher waits, or make assumptions about the IRQL level at which they are executing. In addition, they must not use the KeAcquire/ReleaseSpinLockAtDpcLevel APIs because the functions assume the CPU is at dispatch level. Instead, threaded DPCs must use KeAcquire/ReleaseSpinLockForDpc, which performs the appropriate action after checking the current IRQL.
While threaded DPCs are a great feature for driver developers to protect the system’s resources when possible, they are an opt-in feature—both from the developer’s point of view and even the system administrator. As such, the vast majority of DPCs still execute nonthreaded and can result in perceived system lag. Windows employs a vast arsenal of performance tracking mechanisms to diagnose and assist with DPC-related issues. The first of these, of course, is to track DPC (and ISR) time both through performance counters, as well as through precise ETW tracing.

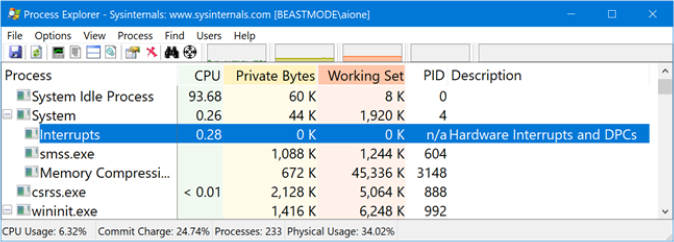
lkd> dx new { QueuedDpcCount = @$prcb->DpcData[0].DpcCount + @$prcb->DpcData[1].DpcCount, ExecutedDpcCount = ((nt!_ISRDPCSTATS*)@$prcb->IsrDpcStats)->DpcCount },d
    QueuedDpcCount   : 3370380
    ExecutedDpcCount : 1766914 [Type: unsigned __int64]
Windows doesn’t just expect users to manually look into latency issues caused by DPCs; it also includes built-in mechanisms to address a few common scenarios that can cause significant problems. The first is the DPC Watchdog and DPC Timeout mechanism, which can be configured through certain registry values in HKEY_LOCAL_MACHINESYSTEMCurrentControlSetControlSession ManagerKernel such as DPCTimeout, DpcWatchdogPeriod, and DpcWatchdogProfileOffset.
The DPC Watchdog is responsible for monitoring all execution of code at DISPATCH_LEVEL or above, where a drop in IRQL has not been registered for quite some time. The DPC Timeout, on the other hand, monitors the execution time of a specific DPC. By default, a specific DPC times out after 20 seconds, and all DISPATCH_LEVEL (and above) execution times out after 2 minutes. Both limits are configurable with the registry values mentioned earlier (DPCTimeout controls a specific DPC time limit, whereas the DpcWatchdogPeriod controls the combined execution of all the code running at high IRQL). When these thresholds are hit, the system will either bugcheck with DPC_WATCHDOG_VIOLATION (indicating which of the situations was encountered), or, if a kernel debugger is attached, raise an assertion that can be continued.
Driver developers who want to do their part in avoiding these situations can use the KeQueryDpcWatchdogInformation API to see the current values configured and the time remaining. Furthermore, the KeShouldYieldProcessor API takes these values (and other system state values) into consideration and returns to the driver a hint used for making a decision whether to continue its DPC work later, or if possible, drop the IRQL back to PASSIVE_LEVEL (in the case where a DPC wasn’t executing, but the driver was holding a lock or synchronizing with a DPC in some way).
On the latest builds of Windows 10, each PRCB also contains a DPC Runtime History Table (DpcRuntimeHistoryHashTable), which contains a hash table of buckets tracking specific DPC callback functions that have recently executed and the amount of CPU cycles that they spent running. When analyzing a memory dump or remote system, this can be useful in figuring out latency issues without access to a UI tool, but more importantly, this data is also now used by the kernel.
When a driver developer queues a DPC through KeInsertQueueDpc, the API will enumerate the processor’s table and check whether this DPC has been seen executing before with a particularly long runtime (a default of 100 microseconds but configurable through the LongDpcRuntimeThreshold registry value in HKEY_LOCAL_MACHINESYSTEMCurrentControlSetControlSession ManagerKernel). If this is the case, the LongDpcPresent field will be set in the DpcData structure mentioned earlier.
For each idle thread (See Part 1, Chapter 4 for more information on thread scheduling and the idle thread), the kernel now also creates a DPC Delegate Thread. These are highly unique threads that belong to the System Idle Process—just like Idle Threads—and are never part of the scheduler’s default thread selection algorithms. They are merely kept in the back pocket of the kernel for its own purposes. Figure 8-18 shows a system with 16 logical processors that now has 16 idle threads as well as 16 DPC delegate threads. Note that in this case, these threads have a real Thread ID (TID), and the Processor column should be treated as such for them.

Figure 8-18 The DPC delegate threads on a 16-CPU system.
Whenever the kernel is dispatching DPCs, it checks whether the DPC queue depth has passed the threshold of such long-running DPCs (this defaults to 2 but is also configurable through the same registry key we’ve shown a few times). If this is the case, a decision is made to try to mitigate the issue by looking at the properties of the currently executing thread: Is it idle? Is it a real-time thread? Does its affinity mask indicate that it typically runs on a different processor? Depending on the results, the kernel may decide to schedule the DPC delegate thread instead, essentially swapping the DPC from its thread-starving position into a dedicated thread, which has the highest priority possible (still executing at DISPATCH_LEVEL). This gives a chance to the old preempted thread (or any other thread in the standby list) to be rescheduled to some other CPU.
This mechanism is similar to the Threaded DPCs we explained earlier, with some exceptions. The delegate thread still runs at DISPATCH_LEVEL. Indeed, when it is created and started in phase 1 of the NT kernel initialization (see Chapter 12 for more details), it raises its own IRQL to DISPATCH level, saves it in the WaitIrql field of its kernel thread data structure, and voluntarily asks the scheduler to perform a context switch to another standby or ready thread (via the KiSwapThread routine.) Thus, the delegate DPCs provide an automatic balancing action that the system takes, instead of an opt-in that driver developers must judiciously leverage on their own.
If you have a newer Windows 10 system with this capability, you can run the following command in the kernel debugger to take a look at how often the delegate thread was needed, which you can infer from the amount of context switches that have occurred since boot:
lkd> dx @$cursession.Processes[0].Threads.Where(t => t.KernelObject.ThreadName->
ToDisplayString().Contains("DPC Delegate Thread")).Select(t => t.KernelObject.Tcb.ContextSwitches),d
    [44]             : 2138 [Type: unsigned long]
    [52]             : 4 [Type: unsigned long]
    [60]             : 11 [Type: unsigned long]
    [68]             : 6 [Type: unsigned long]
    [76]             : 13 [Type: unsigned long]
    [84]             : 3 [Type: unsigned long]
    [92]             : 16 [Type: unsigned long]
    [100]            : 19 [Type: unsigned long]
    [108]            : 2 [Type: unsigned long]
    [116]            : 1 [Type: unsigned long]
    [124]            : 2 [Type: unsigned long]
    [132]            : 2 [Type: unsigned long]
    [140]            : 3 [Type: unsigned long]
    [148]            : 2 [Type: unsigned long]
    [156]            : 1 [Type: unsigned long]
    [164]            : 1 [Type: unsigned long]
Asynchronous procedure call interrupts
Asynchronous procedure calls (APCs) provide a way for user programs and system code to execute in the context of a particular user thread (and hence a particular process address space). Because APCs are queued to execute in the context of a particular thread, they are subject to thread scheduling rules and do not operate within the same environment as DPCs—namely, they do not operate at DISPATCH_LEVEL and can be preempted by higher priority threads, perform blocking waits, and access pageable memory.
That being said, because APCs are still a type of software interrupt, they must somehow still be able to wrangle control away from the thread’s primary execution path, which, as shown in this section, is in part done by operating at a specific IRQL called APC_LEVEL. This means that although APCs don’t operate under the same restrictions as a DPC, there are still certain limitations imposed that developers must be wary of, which we’ll cover shortly.
APCs are described by a kernel control object, called an APC object. APCs waiting to execute reside in one of two kernel-managed APC queues. Unlike the DPC queues, which are per-processor (and divided into threaded and nonthreaded), the APC queues are per-thread—with each thread having two APC queues: one for kernel APCs and one for user APCs.
When asked to queue an APC, the kernel looks at the mode (user or kernel) of the APC and then inserts it into the appropriate queue belonging to the thread that will execute the APC routine. Before looking into how and when this APC will execute, let’s look at the differences between the two modes. When an APC is queued against a thread, that thread may be in one of the three following situations:
■ The thread is currently running (and may even be the current thread).
■ The thread is currently waiting.
■ The thread is doing something else (ready, standby, and so on).
First, you might recall from Part 1, Chapter 4, “Thread scheduling,” that a thread has an alertable state whenever performing a wait. Unless APCs have been completely disabled for a thread, for kernel APCs, this state is ignored—the APC always aborts the wait, with consequences that will be explained later in this section. For user APCs however, the thread is interrupted only if the wait was alertable and instantiated on behalf of a user-mode component or if there are other pending user APCs that already started aborting the wait (which would happen if there were lots of processors trying to queue an APC to the same thread).
User APCs also never interrupt a thread that’s already running in user mode; the thread needs to either perform an alertable wait or go through a ring transition or context switch that revisits the User APC queue. Kernel APCs, on the other hand, request an interrupt on the processor of the target thread, raising the IRQL to APC_LEVEL, notifying the processor that it must look at the kernel APC queue of its currently running thread. And, in both scenarios, if the thread was doing “something else,” some transition that takes it into either the running or waiting state needs to occur. As a practical result of this, suspended threads, for example, don’t execute APCs that are being queued to them.
We mentioned that APCs could be disabled for a thread, outside of the previously described scenarios around alertability. Kernel and driver developers can choose to do so through two mechanisms, one being to simply keep their IRQL at APC_LEVEL or above while executing some piece of code. Because the thread is in a running state, an interrupt is normally delivered, but as per the IRQL rules we’ve explained, if the processor is already at APC_LEVEL (or higher), the interrupt is masked out. Therefore, it is only once the IRQL has dropped to PASSIVE_LEVEL that the pending interrupt is delivered, causing the APC to execute.
The second mechanism, which is strongly preferred because it avoids changing interrupt controller state, is to use the kernel API KeEnterGuardedRegion, pairing it with KeLeaveGuardedRegion when you want to restore APC delivery back to the thread. These APIs are recursive and can be called multiple times in a nested fashion. It is safe to context switch to another thread while still in such a region because the state updates a field in the thread object (KTHREAD) structure—SpecialApcDisable and not per-processor state.
Similarly, context switches can occur while at APC_LEVEL, even though this is per-processor state. The dispatcher saves the IRQL in the KTHREAD using the field WaitIrql and then sets the processor IRQL to the WaitIrql of the new incoming thread (which could be PASSIVE_LEVEL). This creates an interesting scenario where technically, a PASSIVE_LEVEL thread can preempt an APC_LEVEL thread. Such a possibility is common and entirely normal, proving that when it comes to thread execution, the scheduler outweighs any IRQL considerations. It is only by raising to DISPATCH_LEVEL, which disables thread preemption, that IRQLs supersede the scheduler. Since APC_LEVEL is the only IRQL that ends up behaving this way, it is often called a thread-local IRQL, which is not entirely accurate but is a sufficient approximation for the behavior described herein.
Regardless of how APCs are disabled by a kernel developer, one rule is paramount: Code can neither return to user mode with the APC at anything above PASSIVE_LEVEL nor can SpecialApcDisable be set to anything but 0. Such situations result in an immediate bugcheck, typically meaning some driver has forgotten to release a lock or leave its guarded region.
In addition to two APC modes, there are two types of APCs for each mode—normal APCs and special APCs—both of which behave differently depending on the mode. We describe each combination:
■ Special Kernel APC This combination results in an APC that is always inserted at the tail of all other existing special kernel APCs in the APC queue but before any normal kernel APCs. The kernel routine receives a pointer to the arguments and to the normal routine of the APC and operates at APC_LEVEL, where it can choose to queue a new, normal APC.
■ Normal Kernel APC This type of APC is always inserted at the tail end of the APC queue, allowing for a special kernel APC to queue a new normal kernel APC that will execute soon thereafter, as described in the earlier example. These kinds of APCs can not only be disabled through the mechanisms presented earlier but also through a third API called KeEnterCriticalRegion (paired with KeLeaveCriticalRegion), which updates the KernelApcDisable counter in KTHREAD but not SpecialApcDisable.
■ These APCs first execute their kernel routine at APC_LEVEL, sending it pointers to the arguments and the normal routine. If the normal routine hasn’t been cleared as a result, they then drop the IRQL to PASSIVE_LEVEL and execute the normal routine as well, with the input arguments passed in by value this time. Once the normal routine returns, the IRQL is raised back to APC_LEVEL again.
■ Normal User APC This typical combination causes the APC to be inserted at the tail of the APC queue and for the kernel routine to first execute at APC_LEVEL in the same way as the preceding bullet. If a normal routine is still present, then the APC is prepared for user-mode delivery (obviously, at PASSIVE_LEVEL) through the creation of a trap frame and exception frame that will eventually cause the user-mode APC dispatcher in Ntdll.dll to take control of the thread once back in user mode, and which will call the supplied user pointer. Once the user-mode APC returns, the dispatcher uses the NtContinue or NtContinueEx system call to return to the original trap frame.
■ Note that if the kernel routine ended up clearing out the normal routine, then the thread, if alerted, loses that state, and, conversely, if not alerted, becomes alerted, and the user APC pending flag is set, potentially causing other user-mode APCs to be delivered soon. This is performed by the KeTestAlertThread API to essentially still behave as if the normal APC would’ve executed in user mode, even though the kernel routine cancelled the dispatch.
■ Special User APC This combination of APC is a recent addition to newer builds of Windows 10 and generalizes a special dispensation that was done for the thread termination APC such that other developers can make use of it as well. As we’ll soon see, the act of terminating a remote (noncurrent) thread requires the use of an APC, but it must also only occur once all kernel-mode code has finished executing. Delivering the termination code as a User APC would fit the bill quite well, but it would mean that a user-mode developer could avoid termination by performing a nonalertable wait or filling their queue with other User APCs instead.
To fix this scenario, the kernel long had a hard-coded check to validate if the kernel routine of a User APC was KiSchedulerApcTerminate. In this situation, the User APC was recognized as being “special” and put at the head of the queue. Further, the status of the thread was ignored, and the “user APC pending” state was always set, which forced execution of the APC at the next user-mode ring transition or context switch to this thread.
This functionality, however, being solely reserved for the termination code path, meant that developers who want to similarly guarantee the execution of their User APC, regardless of alertability state, had to resort to using more complex mechanisms such as manually changing the context of the thread using SetThreadContext, which is error-prone at best. In response, the QueueUserAPC2 API was created, which allows passing in the QUEUE_USER_APC_FLAGS_SPECIAL_USER_APC flag, officially exposing similar functionality to developers as well. Such APCs will always be added before any other user-mode APCs (except the termination APC, which is now extra special) and will ignore the alertable flag in the case of a waiting thread. Additionally, the APC will first be inserted exceptionally as a Special Kernel APC such that its kernel routine will execute almost instantaneously to then reregister the APC as a special user APC.
Table 8-9 summarizes the APC insertion and delivery behavior for each type of APC.
Table 8-9 APC insertion and delivery
APC Type |
Insertion Behavior |
Delivery Behavior |
|---|---|---|
Special (kernel) |
Inserted right after the last special APC (at the head of all other normal APCs) |
Kernel routine delivered at APC level as soon as IRQL drops, and the thread is not in a guarded region. It is given pointers to arguments specified when inserting the APC. |
Normal (kernel) |
Inserted at the tail of the kernel-mode APC list |
Kernel routine delivered at APC_LEVEL as soon as IRQL drops, and the thread is not in a critical (or guarded) region. It is given pointers to arguments specified when inserting the APC. Executes the normal routine, if any, at PASSIVE_LEVEL after the associated kernel routine was executed. It is given arguments returned by the associated kernel routine (which can be the original arguments used during insertion or new ones). |
Normal (user) |
Inserted at the tail of the user-mode APC list |
Kernel routine delivered at APC_LEVEL as soon as IRQL drops and the thread has the “user APC pending” flag set (indicating that an APC was queued while the thread was in an alertable wait state). It is given pointers to arguments specified when inserting the APC. Executes the normal routine, if any, in user mode at PASSIVE_LEVEL after the associated kernel routine is executed. It is given arguments returned by the associated kernel routine (which can be the original arguments used during insertion or new ones). If the normal routine was cleared by the kernel routine, it performs a test-alert against the thread. |
User Thread Terminate APC (KiSchedulerApcTerminate) |
Inserted at the head of the user-mode APC list |
Immediately sets the “user APC pending” flag and follows similar rules as described earlier but delivered at PASSIVE_LEVEL on return to user mode, no matter what. It is given arguments returned by the thread-termination special APC. |
Special (user) |
Inserted at the head of the user-mode APC list but after the thread terminates APC, if any. |
Same as above, but arguments are controlled by the caller of QueueUserAPC2 (NtQueueApcThreadEx2). Kernel routine is internal KeSpecialUserApcKernelRoutine function that re-inserts the APC, converting it from the initial special kernel APC to a special user APC. |
The executive uses kernel-mode APCs to perform operating system work that must be completed within the address space (in the context) of a particular thread. It can use special kernel-mode APCs to direct a thread to stop executing an interruptible system service, for example, or to record the results of an asynchronous I/O operation in a thread’s address space. Environment subsystems use special kernel-mode APCs to make a thread suspend or terminate itself or to get or set its user-mode execution context. The Windows Subsystem for Linux (WSL) uses kernel-mode APCs to emulate the delivery of UNIX signals to Subsystem for UNIX Application processes.
Another important use of kernel-mode APCs is related to thread suspension and termination. Because these operations can be initiated from arbitrary threads and directed to other arbitrary threads, the kernel uses an APC to query the thread context as well as to terminate the thread. Device drivers often block APCs or enter a critical or guarded region to prevent these operations from occurring while they are holding a lock; otherwise, the lock might never be released, and the system would hang.
Device drivers also use kernel-mode APCs. For example, if an I/O operation is initiated and a thread goes into a wait state, another thread in another process can be scheduled to run. When the device finishes transferring data, the I/O system must somehow get back into the context of the thread that initiated the I/O so that it can copy the results of the I/O operation to the buffer in the address space of the process containing that thread. The I/O system uses a special kernel-mode APC to perform this action unless the application used the SetFileIoOverlappedRange API or I/O completion ports. In that case, the buffer will either be global in memory or copied only after the thread pulls a completion item from the port. (The use of APCs in the I/O system is discussed in more detail in Chapter 6 of Part 1.)
Several Windows APIs—such as ReadFileEx, WriteFileEx, and QueueUserAPC—use user-mode APCs. For example, the ReadFileEx and WriteFileEx functions allow the caller to specify a completion routine to be called when the I/O operation finishes. The I/O completion is implemented by queuing an APC to the thread that issued the I/O. However, the callback to the completion routine doesn’t necessarily take place when the APC is queued because user-mode APCs are delivered to a thread only when it’s in an alertable wait state. A thread can enter a wait state either by waiting for an object handle and specifying that its wait is alertable (with the Windows WaitForMultipleObjectsEx function) or by testing directly whether it has a pending APC (using SleepEx). In both cases, if a user-mode APC is pending, the kernel interrupts (alerts) the thread, transfers control to the APC routine, and resumes the thread’s execution when the APC routine completes. Unlike kernel-mode APCs, which can execute at APC_LEVEL, user-mode APCs execute at PASSIVE_LEVEL.
APC delivery can reorder the wait queues—the lists of which threads are waiting for what, and in what order they are waiting. (Wait resolution is described in the section “Low-IRQL synchronization,” later in this chapter.) If the thread is in a wait state when an APC is delivered, after the APC routine completes, the wait is reissued or re-executed. If the wait still isn’t resolved, the thread returns to the wait state, but now it will be at the end of the list of objects it’s waiting for. For example, because APCs are used to suspend a thread from execution, if the thread is waiting for any objects, its wait is removed until the thread is resumed, after which that thread will be at the end of the list of threads waiting to access the objects it was waiting for. A thread performing an alertable kernel-mode wait will also be woken up during thread termination, allowing such a thread to check whether it woke up as a result of termination or for a different reason.
Timer processing
The system’s clock interval timer is probably the most important device on a Windows machine, as evidenced by its high IRQL value (CLOCK_LEVEL) and due to the critical nature of the work it is responsible for. Without this interrupt, Windows would lose track of time, causing erroneous results in calculations of uptime and clock time—and worse, causing timers to no longer expire, and threads never to consume their quantum. Windows would also not be a preemptive operating system, and unless the current running thread yielded the CPU, critical background tasks and scheduling could never occur on a given processor.
Timer types and intervals
Traditionally, Windows programmed the system clock to fire at some appropriate interval for the machine, and subsequently allowed drivers, applications, and administrators to modify the clock interval for their needs. This system clock thus fired in a fixed, periodic fashion, maintained by either by the Programmable Interrupt Timer (PIT) chip that has been present on all computers since the PC/AT or the Real Time Clock (RTC). The PIT works on a crystal that is tuned at one-third the NTSC color carrier frequency (because it was originally used for TV-Out on the first CGA video cards), and the HAL uses various achievable multiples to reach millisecond-unit intervals, starting at 1 ms all the way up to 15 ms. The RTC, on the other hand, runs at 32.768 kHz, which, by being a power of two, is easily configured to run at various intervals that are also powers of two. On RTC-based systems, the APIC Multiprocessor HAL configured the RTC to fire every 15.6 milliseconds, which corresponds to about 64 times a second.
The PIT and RTC have numerous issues: They are slow, external devices on legacy buses, have poor granularity, force all processors to synchronize access to their hardware registers, are a pain to emulate, and are increasingly no longer found on embedded hardware devices, such as IoT and mobile. In response, hardware vendors created new types of timers, such as the ACPI Timer, also sometimes called the Power Management (PM) Timer, and the APIC Timer (which lives directly on the processor). The ACPI Timer achieved good flexibility and portability across hardware architectures, but its latency and implementation bugs caused issues. The APIC Timer, on the other hand, is highly efficient but is often already used by other platform needs, such as for profiling (although more recent processors now have dedicated profiling timers).
In response, Microsoft and the industry created a specification called the High Performance Event Timer, or HPET, which a much-improved version of the RTC. On systems with an HPET, it is used instead of the RTC or PIC. Additionally, ARM64 systems have their own timer architecture, called the Generic Interrupt Timer (GIT). All in all, the HAL maintains a complex hierarchy of finding the best possible timer on a given system, using the following order:
Try to find a synthetic hypervisor timer to avoid any kind of emulation if running inside of a virtual machine.
On physical hardware, try to find a GIT. This is expected to work only on ARM64 systems.
If possible, try to find a per-processor timer, such as the Local APIC timer, if not already used.
Otherwise, find an HPET—going from an MSI-capable HPET to a legacy periodic HPET to any kind of HPET.
If no HPET was found, use the RTC.
If no RTC is found, try to find some other kind of timer, such as the PIT or an SFI Timer, first trying to find ones that support MSI interrupts, if possible.
If no timer has yet been found, the system doesn’t actually have a Windows compatible timer, which should never happen.
The HPET and the LAPIC Timer have one more advantage—other than only supporting the typical periodic mode we described earlier, they can also be configured in a one shot mode. This capability will allow recent versions of Windows to leverage a dynamic tick model, which we explain later.
Timer granularity
Some types of Windows applications require very fast response times, such as multimedia applications. In fact, some multimedia tasks require rates as low as 1 ms. For this reason, Windows from early on implemented APIs and mechanisms that enable lowering the interval of the system’s clock interrupt, which results in more frequent clock interrupts. These APIs do not adjust a particular timer’s specific rate (that functionality was added later, through enhanced timers, which we cover in an upcoming section); instead, they end up increasing the resolution of all timers in the system, potentially causing other timers to expire more frequently, too.
That being said, Windows tries its best to restore the clock timer back to its original value whenever it can. Each time a process requests a clock interval change, Windows increases an internal reference count and associates it with the process. Similarly, drivers (which can also change the clock rate) get added to the global reference count. When all drivers have restored the clock and all processes that modified the clock either have exited or restored it, Windows restores the clock to its default value (or barring that, to the next highest value that’s been required by a process or driver).
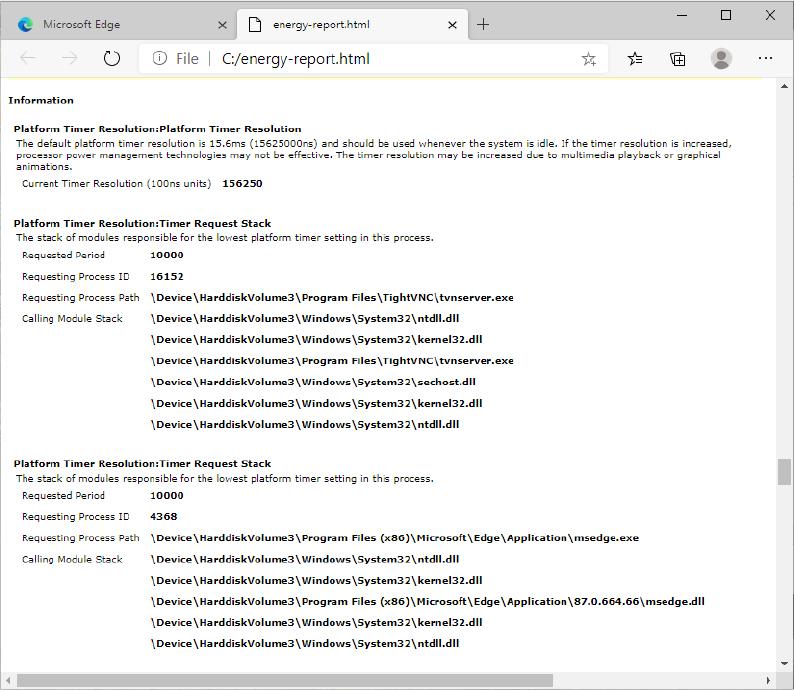
   +0x4a8 TimerResolutionLink : _LIST_ENTRY [ 0xfffffa80’05218fd8 - 0xfffffa80’059cd508 ]
   +0x4b8 RequestedTimerResolution : 0
   +0x4bc ActiveThreadsHighWatermark : 0x1d
   +0x4c0 SmallestTimerResolution : 0x2710
   +0x4c8 TimerResolutionStackRecord : 0xfffff8a0’0476ecd0 _PO_DIAG_STACK_RECORD
lkd> dx -g Debugger.Utility.Collections.FromListEntry(*(nt!_LIST_ENTRY*)&nt!ExpTimerReso
lutionListHead, "nt!_EPROCESS", "TimerResolutionLink").Select(p => new { Name = ((char*)
p.ImageFileName).ToDisplayString("sb"), Smallest = p.SmallestTimerResolution, Requested =
p.RequestedTimerResolution}),d
======================================================
=         = Name              = Smallest = Requested =
======================================================
= [0]     - msedge.exe        - 10000    - 0         =
= [1]     - msedge.exe        - 10000    - 0         =
= [2]     - msedge.exe        - 10000    - 0         =
= [3]     - msedge.exe        - 10000    - 0         =
= [4]     - mstsc.exe         - 10000    - 0         =
= [5]     - msedge.exe        - 10000    - 0         =
= [6]     - msedge.exe        - 10000    - 0         =
= [7]     - msedge.exe        - 10000    - 0         =
= [8]     - DbgX.Shell.exe    - 10000    - 10000     =
= [9]     - msedge.exe        - 10000    - 0         =
= [10]    - msedge.exe        - 10000    - 0         =
= [11]    - msedge.exe        - 10000    - 0         =
= [12]    - msedge.exe        - 10000    - 0         =
= [13]    - msedge.exe        - 10000    - 0         =
= [14]    - msedge.exe        - 10000    - 0         =
= [15]    - msedge.exe        - 10000    - 0         =
= [16]    - msedge.exe        - 10000    - 0         =
= [17]    - msedge.exe        - 10000    - 0         =
= [18]    - msedge.exe        - 10000    - 0         =
= [19]    - SearchApp.exe     - 40000    - 0         =
======================================================
Timer expiration
As we said, one of the main tasks of the ISR associated with the interrupt that the clock source generates is to keep track of system time, which is mainly done by the KeUpdateSystemTime routine. Its second job is to keep track of logical run time, such as process/thread execution times and the system tick time, which is the underlying number used by APIs such as GetTickCount that developers use to time operations in their applications. This part of the work is performed by KeUpdateRunTime. Before doing any of that work, however, KeUpdateRunTime checks whether any timers have expired.
Windows timers can be either absolute timers, which implies a distinct expiration time in the future, or relative timers, which contain a negative expiration value used as a positive offset from the current time during timer insertion. Internally, all timers are converted to an absolute expiration time, although the system keeps track of whether this is the “true” absolute time or a converted relative time. This difference is important in certain scenarios, such as Daylight Savings Time (or even manual clock changes). An absolute timer would still fire at 8:00 p.m. if the user moved the clock from 1:00 p.m. to 7:00 p.m., but a relative timer—say, one set to expire “in two hours”—would not feel the effect of the clock change because two hours haven’t really elapsed. During system time-change events such as these, the kernel reprograms the absolute time associated with relative timers to match the new settings.
Back when the clock only fired in a periodic mode, since its expiration was at known interval multiples, each multiple of the system time that a timer could be associated with is an index called a hand, which is stored in the timer object’s dispatcher header. Windows used that fact to organize all driver and application timers into linked lists based on an array where each entry corresponds to a possible multiple of the system time. Because modern versions of Windows 10 no longer necessarily run on a periodic tick (due to the dynamic tick functionality), a hand has instead been redefined as the upper 46 bits of the due time (which is in 100 ns units). This gives each hand an approximate “time” of 28 ms. Additionally, because on a given tick (especially when not firing on a fixed periodic interval), multiple hands could have expiring timers, Windows can no longer just check the current hand. Instead, a bitmap is used to track each hand in each processor’s timer table. These pending hands are found using the bitmap and checked during every clock interrupt.
Regardless of method, these 256 linked lists live in what is called the timer table—which is in the PRCB—enabling each processor to perform its own independent timer expiration without needing to acquire a global lock, as shown in Figure 8-19. Recent builds of Windows 10 can have up to two timer tables, for a total of 512 linked lists.

Figure 8-19 Example of per-processor timer lists.
Later, you will see what determines which logical processor’s timer table a timer is inserted on. Because each processor has its own timer table, each processor also does its own timer expiration work. As each processor gets initialized, the table is filled with absolute timers with an infinite expiration time to avoid any incoherent state. Therefore, to determine whether a clock has expired, it is only necessary to check if there are any timers on the linked list associated with the current hand.
Although updating counters and checking a linked list are fast operations, going through every timer and expiring it is a potentially costly operation—keep in mind that all this work is currently being performed at CLOCK_LEVEL, an exceptionally elevated IRQL. Similar to how a driver ISR queues a DPC to defer work, the clock ISR requests a DPC software interrupt, setting a flag in the PRCB so that the DPC draining mechanism knows timers need expiration. Likewise, when updating process/thread runtime, if the clock ISR determines that a thread has expired its quantum, it also queues a DPC software interrupt and sets a different PRCB flag. These flags are per-PRCB because each processor normally does its own processing of run-time updates because each processor is running a different thread and has different tasks associated with it. Table 8-10 displays the various fields used in timer expiration and processing.
Table 8-10 Timer processing KPRCB fields
KPRCB Field |
Type |
Description |
|---|---|---|
LastTimerHand |
Index (up to 256) |
The last timer hand that was processed by this processor. In recent builds, part of TimerTable because there are now two tables. |
ClockOwner |
Boolean |
Indicates whether the current processor is the clock owner. |
TimerTable |
KTIMER_TABLE |
List heads for the timer table lists (256, or 512 on more recent builds). |
DpcNormalTimerExpiration |
Bit |
Indicates that a DISPATCH_LEVEL interrupt has been raised to request timer expiration. |
DPCs are provided primarily for device drivers, but the kernel uses them, too. The kernel most frequently uses a DPC to handle quantum expiration. At every tick of the system clock, an interrupt occurs at clock IRQL. The clock interrupt handler (running at clock IRQL) updates the system time and then decrements a counter that tracks how long the current thread has run. When the counter reaches 0, the thread’s time quantum has expired, and the kernel might need to reschedule the processor, a lower-priority task that should be done at DPC/dispatch IRQL. The clock interrupt handler queues a DPC to initiate thread dispatching and then finishes its work and lowers the processor’s IRQL. Because the DPC interrupt has a lower priority than do device interrupts, any pending device interrupts that surface before the clock interrupt completes are handled before the DPC interrupt occurs.
Once the IRQL eventually drops back to DISPATCH_LEVEL, as part of DPC processing, these two flags will be picked up.
Chapter 4 of Part 1 covers the actions related to thread scheduling and quantum expiration. Here, we look at the timer expiration work. Because the timers are linked together by hand, the expiration code (executed by the DPC associated with the PRCB in the TimerExpirationDpc field, usually KiTimerExpirationDpc) parses this list from head to tail. (At insertion time, the timers nearest to the clock interval multiple will be first, followed by timers closer and closer to the next interval but still within this hand.) There are two primary tasks to expiring a timer:
■ The timer is treated as a dispatcher synchronization object (threads are waiting on the timer as part of a timeout or directly as part of a wait). The wait-testing and wait-satisfaction algorithms will be run on the timer. This work is described in a later section on synchronization in this chapter. This is how user-mode applications, and some drivers, make use of timers.
■ The timer is treated as a control object associated with a DPC callback routine that executes when the timer expires. This method is reserved only for drivers and enables very low latency response to timer expiration. (The wait/dispatcher method requires all the extra logic of wait signaling.) Additionally, because timer expiration itself executes at DISPATCH_LEVEL, where DPCs also run, it is perfectly suited as a timer callback.
As each processor wakes up to handle the clock interval timer to perform system-time and run-time processing, it therefore also processes timer expirations after a slight latency/delay in which the IRQL drops from CLOCK_LEVEL to DISPATCH_LEVEL. Figure 8-20 shows this behavior on two processors—the solid arrows indicate the clock interrupt firing, whereas the dotted arrows indicate any timer expiration processing that might occur if the processor had associated timers.

Figure 8-20 Timer expiration.
Processor selection
A critical determination that must be made when a timer is inserted is to pick the appropriate table to use—in other words, the most optimal processor choice. First, the kernel checks whether timer serialization is disabled. If it is, it then checks whether the timer has a DPC associated with its expiration, and if the DPC has been affinitized to a target processor, in which case it selects that processor’s timer table. If the timer has no DPC associated with it, or if the DPC has not been bound to a processor, the kernel scans all processors in the current processor’s group that have not been parked. (For more information on core parking, see Chapter 4 of Part 1.) If the current processor is parked, it picks the next closest neighboring unparked processor in the same NUMA node; otherwise, the current processor is used.
This behavior is intended to improve performance and scalability on server systems that make use of Hyper-V, although it can improve performance on any heavily loaded system. As system timers pile up—because most drivers do not affinitize their DPCs—CPU 0 becomes more and more congested with the execution of timer expiration code, which increases latency and can even cause heavy delays or missed DPCs. Additionally, timer expiration can start competing with DPCs typically associated with driver interrupt processing, such as network packet code, causing systemwide slowdowns. This process is exacerbated in a Hyper-V scenario, where CPU 0 must process the timers and DPCs associated with potentially numerous virtual machines, each with their own timers and associated devices.
By spreading the timers across processors, as shown in Figure 8-21, each processor’s timer-expiration load is fully distributed among unparked logical processors. The timer object stores its associated processor number in the dispatcher header on 32-bit systems and in the object itself on 64-bit systems.

Figure 8-21 Timer queuing behaviors.
This behavior, although highly beneficial on servers, does not typically affect client systems that much. Additionally, it makes each timer expiration event (such as a clock tick) more complex because a processor may have gone idle but still have had timers associated with it, meaning that the processor(s) still receiving clock ticks need to potentially scan everyone else’s processor tables, too. Further, as various processors may be cancelling and inserting timers simultaneously, it means there’s inherent asynchronous behaviors in timer expiration, which may not always be desired. This complexity makes it nearly impossible to implement Modern Standby’s resiliency phase because no one single processor can ultimately remain to manage the clock. Therefore, on client systems, timer serialization is enabled if Modern Standby is available, which causes the kernel to choose CPU 0 no matter what. This allows CPU 0 to behave as the default clock owner—the processor that will always be active to pick up clock interrupts (more on this later).
![]() Note
Note
This behavior is controlled by the kernel variable KiSerializeTimerExpiration, which is initialized based on a registry setting whose value is different between a server and client installation. By modifying or creating the value SerializeTimerExpiration under HKLMSYSTEMCurrentControlSetControlSession ManagerKernel and setting it to any value other than 0 or 1, serialization can be disabled, enabling timers to be distributed among processors. Deleting the value, or keeping it as 0, allows the kernel to make the decision based on Modern Standby availability, and setting it to 1 permanently enables serialization even on non-Modern Standby systems.
Intelligent timer tick distribution
Figure 8-20, which shows processors handling the clock ISR and expiring timers, reveals that processor 1 wakes up several times (the solid arrows) even when there are no associated expiring timers (the dotted arrows). Although that behavior is required as long as processor 1 is running (to update the thread/process run times and scheduling state), what if processor 1 is idle (and has no expiring timers)? Does it still need to handle the clock interrupt? Because the only other work required that was referenced earlier is to update the overall system time/clock ticks, it’s sufficient to designate merely one processor as the time-keeping processor (in this case, processor 0) and allow other processors to remain in their sleep state; if they wake, any time-related adjustments can be performed by resynchronizing with processor 0.
Windows does, in fact, make this realization (internally called intelligent timer tick distribution), and Figure 8-22 shows the processor states under the scenario where processor 1 is sleeping (unlike earlier, when we assumed it was running code). As you can see, processor 1 wakes up only five times to handle its expiring timers, creating a much larger gap (sleeping period). The kernel uses a variable KiPendingTimerBitmaps, which contains an array of affinity mask structures that indicate which logical processors need to receive a clock interval for the given timer hand (clock-tick interval). It can then appropriately program the interrupt controller, as well as determine to which processors it will send an IPI to initiate timer processing.
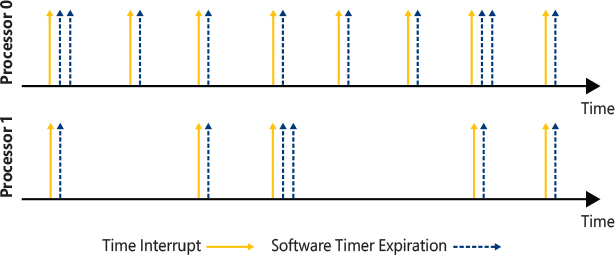
Figure 8-22 Intelligent timer tick distribution applied to processor 1.
Leaving as large a gap as possible is important due to the way power management works in processors: as the processor detects that the workload is going lower and lower, it decreases its power consumption (P states), until it finally reaches an idle state. The processor then can selectively turn off parts of itself and enter deeper and deeper idle/sleep states, such as turning off caches. However, if the processor has to wake again, it will consume energy and take time to power up; for this reason, processor designers will risk entering these lower idle/sleep states (C-states) only if the time spent in a given state outweighs the time and energy it takes to enter and exit the state. Obviously, it makes no sense to spend 10 ms to enter a sleep state that will last only 1 ms. By preventing clock interrupts from waking sleeping processors unless needed (due to timers), they can enter deeper C-states and stay there longer.
Timer coalescing
Although minimizing clock interrupts to sleeping processors during periods of no timer expiration gives a big boost to longer C-state intervals, with a timer granularity of 15 ms, many timers likely will be queued at any given hand and expire often, even if just on processor 0. Reducing the amount of software timer-expiration work would both help to decrease latency (by requiring less work at DISPATCH_LEVEL) as well as allow other processors to stay in their sleep states even longer. (Because we’ve established that the processors wake up only to handle expiring timers, fewer timer expirations result in longer sleep times.) In truth, it is not just the number of expiring timers that really affects sleep state (it does affect latency), but the periodicity of these timer expirations—six timers all expiring at the same hand is a better option than six timers expiring at six different hands. Therefore, to fully optimize idle-time duration, the kernel needs to employ a coalescing mechanism to combine separate timer hands into an individual hand with multiple expirations.
Timer coalescing works on the assumption that most drivers and user-mode applications do not particularly care about the exact firing period of their timers (except in the case of multimedia applications, for example). This “don’t care” region grows as the original timer period grows—an application waking up every 30 seconds probably doesn’t mind waking up every 31 or 29 seconds instead, while a driver polling every second could probably poll every second plus or minus 50 ms without too many problems. The important guarantee most periodic timers depend on is that their firing period remains constant within a certain range—for example, when a timer has been changed to fire every second plus 50 ms, it continues to fire within that range forever, not sometimes at every two seconds and other times at half a second. Even so, not all timers are ready to be coalesced into coarser granularities, so Windows enables this mechanism only for timers that have marked themselves as coalescable, either through the KeSetCoalescableTimer kernel API or through its user-mode counterpart, SetWaitableTimerEx.
With these APIs, driver and application developers are free to provide the kernel with the maximum tolerance (or tolerably delay) that their timer will endure, which is defined as the maximum amount of time past the requested period at which the timer will still function correctly. (In the previous example, the 1-second timer had a tolerance of 50 ms.) The recommended minimum tolerance is 32 ms, which corresponds to about twice the 15.6 ms clock tick—any smaller value wouldn’t really result in any coalescing because the expiring timer could not be moved even from one clock tick to the next. Regardless of the tolerance that is specified, Windows aligns the timer to one of four preferred coalescing intervals: 1 second, 250 ms, 100 ms, or 50 ms.
When a tolerable delay is set for a periodic timer, Windows uses a process called shifting, which causes the timer to drift between periods until it gets aligned to the most optimal multiple of the period interval within the preferred coalescing interval associated with the specified tolerance (which is then encoded in the dispatcher header). For absolute timers, the list of preferred coalescing intervals is scanned, and a preferred expiration time is generated based on the closest acceptable coalescing interval to the maximum tolerance the caller specified. This behavior means that absolute timers are always pushed out as far as possible past their real expiration point, which spreads out timers as far as possible and creates longer sleep times on the processors.
Now with timer coalescing, refer to Figure 8-20 and assume all the timers specified tolerances and are thus coalescable. In one scenario, Windows could decide to coalesce the timers as shown in Figure 8-23. Notice that now, processor 1 receives a total of only three clock interrupts, significantly increasing the periods of idle sleep, thus achieving a lower C-state. Furthermore, there is less work to do for some of the clock interrupts on processor 0, possibly removing the latency of requiring a drop to DISPATCH_LEVEL at each clock interrupt.
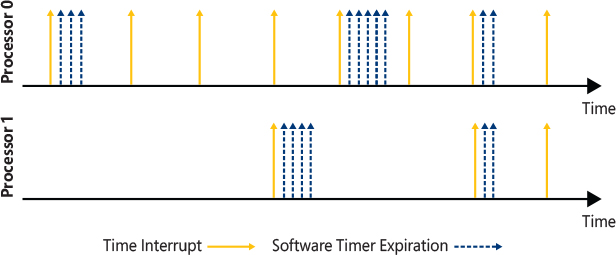
Figure 8-23 Timer coalescing.
Enhanced timers
Enhanced timers were introduced to satisfy a long list of requirements that previous timer system improvements had still not yet addressed. For one, although timer coalescing reduced power usage, it also made timers have inconsistent expiration times, even when there was no need to reduce power (in other words, coalescing was an all-or-nothing proposition). Second, the only mechanism in Windows for high-resolution timers was for applications and drivers to lower the clock tick globally, which, as we’ve seen, had significant negative impact on systems. And, ironically, even though the resolution of these timers was now higher, they were not necessarily more precise because regular time expiration can happen before the clock tick, regardless of how much more granular it’s been made.
Finally, recall that the introduction of Connected/Modern Standby, described in Chapter 6 of Part 1, added features such as timer virtualization and the Desktop Activity Moderator (DAM), which actively delay the expiration of timers during the resiliency phase of Modern Standby to simulate S3 sleep. However, some key system timer activity must still be permitted to periodically run even during this phase.
These three requirements led to the creation of enhanced timers, which are also internally known as Timer2 objects, and the creation of new system calls such as NtCreateTimer2 and NtSetTimer2, as well as driver APIs such as ExAllocateTimer and ExSetTimer. Enhanced timers support four modes of behavior, some of which are mutually exclusive:
■ No-wake This type of enhanced timer is an improvement over timer coalescing because it provides for a tolerable delay that is only used in periods of sleep.
■ High-resolution This type of enhanced timer corresponds to a high-resolution timer with a precise clock rate that is dedicated to it. The clock rate will only need to run at this speed when approaching the expiration of the timer.
■ Idle-resilient This type of enhanced timer is still active even during deep sleep, such as the resiliency phase of modern standby.
■ Finite This is the type for enhanced timers that do not share one of the previously described properties.
High-resolution timers can also be idle resilient, and vice-versa. Finite timers, on the other hand, cannot have any of the described properties. Therefore, if finite enhanced timers do not have any “special” behavior, why create them at all? It turns out that since the new Timer2 infrastructure was a rewrite of the legacy timer logic that’s been there since the start of the kernel’s life, it includes a few other benefits regardless of any special functionality:
■ It uses self-balancing red-black binary trees instead of the linked lists that form the timer table.
■ It allows drivers to specify an enable and disable callback without worrying about manually creating DPCs.
■ It includes new, clean, ETW tracing entries for each operation, aiding in troubleshooting.
■ It provides additional security-in-depth through certain pointer obfuscation techniques and additional assertions, hardening against data-only exploits and corruption.
Therefore, driver developers that are only targeting Windows 8.1 and later are highly recommended to use the new enhanced timer infrastructure, even if they do not require the additional capabilities.
![]() Note
Note
The documented ExAllocateTimer API does not allow drivers to create idle-resilient timers. In fact, such an attempt crashes the system. Only Microsoft inbox drivers can create such timers through the ExAllocateTimerInternal API. Readers are discouraged from attempting to use this API because the kernel maintains a static, hard-coded list of every known legitimate caller, tracked by a unique identifier that must be provided, and further has knowledge of how many such timers the component is allowed to create. Any violations result in a system crash (blue screen of death).
Enhanced timers also have a more complex set of expiration rules than regular timers because they end up having two possible due times. The first, called the minimum due time, specifies the earliest system clock time at which point the timer is allowed to expire. The second, maximum due time, is the latest system clock time at which the timer should ever expire. Windows guarantees that the timer will expire somewhere between these two points in time, either because of a regular clock tick every interval (such as 15 ms), or because of an ad-hoc check for timer expiration (such as the one that the idle thread does upon waking up from an interrupt). This interval is computed by taking the expected expiration time passed in by the developer and adjusting for the possible “no wake tolerance” that was passed in. If unlimited wake tolerance was specified, then the timer does not have a maximum due time.
As such, a Timer2 object lives in potentially up to two red-black tree nodes—node 0, for the minimum due time checks, and node 1, for the maximum due time checks. No-wake and high-resolution timers live in node 0, while finite and idle-resilient timers live in node 1.
Since we mentioned that some of these attributes can be combined, how does this fit in with the two nodes? Instead of a single red-black tree, the system obviously needs to have more, which are called collections (see the public KTIMER2_COLLECTION_INDEX data structure), one for each type of enhanced timer we’ve seen. Then, a timer can be inserted into node 0 or node 1, or both, or neither, depending on the rules and combinations shown in Table 8-11.
Table 8-11 Timer types and node collection indices
Timer type |
Node 0 collection index |
Node 1 collection index |
|---|---|---|
No-wake |
NoWake, if it has a tolerance |
NoWake, if it has a non-unlimited or no tolerance |
Finite |
Never inserted in this node |
Finite |
High-resolution |
Hr, always |
Finite, if it has a non-unlimited or no tolerance |
Idle-resilient |
NoWake, if it has a tolerance |
Ir, if it has a non-unlimited or no tolerance |
High-resolution & Idle-resilient |
Hr, always |
Ir, if it has a non-unlimited or no tolerance |
Think of node 1 as the one that mirrors the default legacy timer behavior—every clock tick, check if a timer is due to expire. Therefore, a timer is guaranteed to expire as long as it’s in at least node 1, which implies that its minimum due time is the same as its maximum due time. If it has unlimited tolerance; however, it won’t be in node 1 because, technically, the timer could never expire if the CPU remains sleeping forever.
High-resolution timers are the opposite; they are checked exactly at the “right” time they’re supposed to expire and never earlier, so node 0 is used for them. However, if their precise expiration time is “too early” for the check in node 0, they might be in node 1 as well, at which point they are treated like a regular (finite) timer (that is, they expire a little bit later than expected). This can also happen if the caller provided a tolerance, the system is idle, and there is an opportunity to coalesce the timer.
Similarly, an idle-resilient timer, if the system isn’t in the resiliency phase, lives in the NoWake collection if it’s not also high resolution (the default enhanced timer state) or lives in the Hr collection otherwise. However, on the clock tick, which checks node 1, it must be in the special Ir collection to recognize that the timer needs to execute even though the system is in deep sleep.
Although it may seem confusing at first, this state combination allows all legal combinations of timers to behave correctly when checked either at the system clock tick (node 1—enforcing a maximum due time) or at the next closest due time computation (node 0—enforcing a minimum due time).
As each timer is inserted into the appropriate collection (KTIMER2_COLLECTION) and associated red-black tree node(s), the collection’s next due time is updated to be the earliest due time of any timer in the collection, whereas a global variable (KiNextTimer2Due) reflects the earliest due time of any timer in any collection.
System worker threads
During system initialization, Windows creates several threads in the System process, called system worker threads, which exist solely to perform work on behalf of other threads. In many cases, threads executing at DPC/dispatch level need to execute functions that can be performed only at a lower IRQL. For example, a DPC routine, which executes in an arbitrary thread context (because DPC execution can usurp any thread in the system) at DPC/dispatch level IRQL, might need to access paged pool or wait for a dispatcher object used to synchronize execution with an application thread. Because a DPC routine can’t lower the IRQL, it must pass such processing to a thread that executes at an IRQL below DPC/dispatch level.
Some device drivers and executive components create their own threads dedicated to processing work at passive level; however, most use system worker threads instead, which avoids the unnecessary scheduling and memory overhead associated with having additional threads in the system. An executive component requests a system worker thread’s services by calling the executive functions ExQueueWorkItem or IoQueueWorkItem. Device drivers should use only the latter (because this associates the work item with a Device object, allowing for greater accountability and the handling of scenarios in which a driver unloads while its work item is active). These functions place a work item on a queue dispatcher object where the threads look for work. (Queue dispatcher objects are described in more detail in the section “I/O completion ports” in Chapter 6 in Part 1.)
The IoQueueWorkItemEx, IoSizeofWorkItem, IoInitializeWorkItem, and IoUninitializeWorkItem APIs act similarly, but they create an association with a driver’s Driver object or one of its Device objects.
Work items include a pointer to a routine and a parameter that the thread passes to the routine when it processes the work item. The device driver or executive component that requires passive-level execution implements the routine. For example, a DPC routine that must wait for a dispatcher object can initialize a work item that points to the routine in the driver that waits for the dispatcher object. At some stage, a system worker thread will remove the work item from its queue and execute the driver’s routine. When the driver’s routine finishes, the system worker thread checks to see whether there are more work items to process. If there aren’t any more, the system worker thread blocks until a work item is placed on the queue. The DPC routine might or might not have finished executing when the system worker thread processes its work item.
There are many types of system worker threads:
■ Normal worker threads execute at priority 8 but otherwise behave like delayed worker threads.
■ Background worker threads execute at priority 7 and inherit the same behaviors as normal worker threads.
■ Delayed worker threads execute at priority 12 and process work items that aren’t considered time-critical.
■ Critical worker threads execute at priority 13 and are meant to process time-critical work items.
■ Super-critical worker threads execute at priority 14, otherwise mirroring their critical counterparts.
■ Hyper-critical worker threads execute at priority 15 and are otherwise just like other critical threads.
■ Real-time worker threads execute at priority 18, which gives them the distinction of operating in the real-time scheduling range (see Chapter 4 of Part 1 for more information), meaning they are not subject to priority boosting nor regular time slicing.
Because the naming of all of these worker queues started becoming confusing, recent versions of Windows introduced custom priority worker threads, which are now recommended for all driver developers and allow the driver to pass in their own priority level.
A special kernel function, ExpLegacyWorkerInitialization, which is called early in the boot process, appears to set an initial number of delayed and critical worker queue threads, configurable through optional registry parameters. You may even have seen these details in an earlier edition of this book. Note, however, that these variables are there only for compatibility with external instrumentation tools and are not actually utilized by any part of the kernel on modern Windows 10 systems and later. This is because recent kernels implemented a new kernel dispatcher object, the priority queue (KPRIQUEUE), coupled it with a fully dynamic number of kernel worker threads, and further split what used to be a single queue of worker threads into per-NUMA node worker threads.
On Windows 10 and later, the kernel dynamically creates additional worker threads as needed, with a default maximum limit of 4096 (see ExpMaximumKernelWorkerThreads) that can be configured through the registry up to a maximum of 16,384 threads and down to a minimum of 32. You can set this using the MaximumKernelWorkerThreads value under the registry key HKLMSYSTEMCurrentControlSetControlSession ManagerExecutive.
Each partition object, which we described in Chapter 5 of Part 1, contains an executive partition, which is the portion of the partition object relevant to the executive—namely, the system worker thread logic. It contains a data structure tracking the work queue manager for each NUMA node part of the partition (a queue manager is made up of the deadlock detection timer, the work queue item reaper, and a handle to the actual thread doing the management). It then contains an array of pointers to each of the eight possible work queues (EX_WORK_QUEUE). These queues are associated with an individual index and track the number of minimum (guaranteed) and maximum threads, as well as how many work items have been processed so far.
Every system includes two default work queues: the ExPool queue and the IoPool queue. The former is used by drivers and system components using the ExQueueWorkItem API, whereas the latter is meant for IoAllocateWorkItem-type APIs. Finally, up to six more queues are defined for internal system use, meant to be used by the internal (non-exported) ExQueueWorkItemToPrivatePool API, which takes in a pool identifier from 0 to 5 (making up queue indices 2 to 7). Currently, only the memory manager’s Store Manager (see Chapter 5 of Part 1 for more information) leverages this capability.
The executive tries to match the number of critical worker threads with changing workloads as the system executes. Whenever work items are being processed or queued, a check is made to see if a new worker thread might be needed. If so, an event is signaled, waking up the ExpWorkQueueManagerThread for the associated NUMA node and partition. An additional worker thread is created in one of the following conditions:
■ There are fewer threads than the minimum number of threads for this queue.
■ The maximum thread count hasn’t yet been reached, all worker threads are busy, and there are pending work items in the queue, or the last attempt to try to queue a work item failed.
Additionally, once every second, for each worker queue manager (that is, for each NUMA node on each partition) the ExpWorkQueueManagerThread can also try to determine whether a deadlock may have occurred. This is defined as an increase in work items queued during the last interval without a matching increase in the number of work items processed. If this is occurring, an additional worker thread will be created, regardless of any maximum thread limits, hoping to clear out the potential deadlock. This detection will then be disabled until it is deemed necessary to check again (such as if the maximum number of threads has been reached). Since processor topologies can change due to hot add dynamic processors, the thread is also responsible for updating any affinities and data structures to keep track of the new processors as well.
Finally, once every double the worker thread timeout minutes (by default 10, so once every 20 minutes), this thread also checks if it should destroy any system worker threads. Through the same registry key, this can be configured to be between 2 and 120 minutes instead, using the value WorkerThreadTimeoutInSeconds. This is called reaping and ensures that system worker thread counts do not get out of control. A system worker thread is reaped if it has been waiting for a long time (defined as the worker thread timeout value) and no further work items are waiting to be processed (meaning the current number of threads are clearing them all out in a timely fashion).
Exception dispatching
In contrast to interrupts, which can occur at any time, exceptions are conditions that result directly from the execution of the program that is running. Windows uses a facility known as structured exception handling, which allows applications to gain control when exceptions occur. The application can then fix the condition and return to the place the exception occurred, unwind the stack (thus terminating execution of the subroutine that raised the exception), or declare back to the system that the exception isn’t recognized, and the system should continue searching for an exception handler that might process the exception. This section assumes you’re familiar with the basic concepts behind Windows structured exception handling—if you’re not, you should read the overview in the Windows API reference documentation in the Windows SDK or Chapters 23 through 25 in Jeffrey Richter and Christophe Nasarre’s book Windows via C/C++ (Microsoft Press, 2007) before proceeding. Keep in mind that although exception handling is made accessible through language extensions (for example, the __try construct in Microsoft Visual C++), it is a system mechanism and hence isn’t language specific.
On the x86 and x64 processors, all exceptions have predefined interrupt numbers that directly correspond to the entry in the IDT that points to the trap handler for a particular exception. Table 8-12 shows x86-defined exceptions and their assigned interrupt numbers. Because the first entries of the IDT are used for exceptions, hardware interrupts are assigned entries later in the table, as mentioned earlier.
Table 8-12 x86 exceptions and their interrupt numbers
Interrupt Number |
Exception |
Mnemonic |
|---|---|---|
0 |
Divide Error |
#DE |
1 |
Debug (Single Step) |
#DB |
2 |
Non-Maskable Interrupt (NMI) |
- |
3 |
Breakpoint |
#BP |
4 |
Overflow |
#OF |
5 |
Bounds Check (Range Exceeded) |
#BR |
6 |
Invalid Opcode |
#UD |
7 |
NPX Not Available |
#NM |
8 |
Double Fault |
#DF |
9 |
NPX Segment Overrun |
- |
10 |
Invalid Task State Segment (TSS) |
#TS |
11 |
Segment Not Present |
#NP |
12 |
Stack-Segment Fault |
#SS |
13 |
General Protection |
#GP |
14 |
Page Fault |
#PF |
15 |
Intel Reserved |
- |
16 |
x87 Floating Point |
#MF |
17 |
Alignment Check |
#AC |
18 |
Machine Check |
#MC |
19 |
SIMD Floating Point |
#XM or #XF |
20 |
Virtualization Exception |
#VE |
21 |
Control Protection (CET) |
#CP |
All exceptions, except those simple enough to be resolved by the trap handler, are serviced by a kernel module called the exception dispatcher. The exception dispatcher’s job is to find an exception handler that can dispose of the exception. Examples of architecture-independent exceptions that the kernel defines include memory-access violations, integer divide-by-zero, integer overflow, floating-point exceptions, and debugger breakpoints. For a complete list of architecture-independent exceptions, consult the Windows SDK reference documentation.
The kernel traps and handles some of these exceptions transparently to user programs. For example, encountering a breakpoint while executing a program being debugged generates an exception, which the kernel handles by calling the debugger. The kernel handles certain other exceptions by returning an unsuccessful status code to the caller.
A few exceptions are allowed to filter back, untouched, to user mode. For example, certain types of memory-access violations or an arithmetic overflow generate an exception that the operating system doesn’t handle. 32-bit applications can establish frame-based exception handlers to deal with these exceptions. The term frame-based refers to an exception handler’s association with a particular procedure activation. When a procedure is invoked, a stack frame representing that activation of the procedure is pushed onto the stack. A stack frame can have one or more exception handlers associated with it, each of which protects a particular block of code in the source program. When an exception occurs, the kernel searches for an exception handler associated with the current stack frame. If none exists, the kernel searches for an exception handler associated with the previous stack frame, and so on, until it finds a frame-based exception handler. If no exception handler is found, the kernel calls its own default exception handlers.
For 64-bit applications, structured exception handling does not use frame-based handlers (the frame-based technology has been proven to be attackable by malicious users). Instead, a table of handlers for each function is built into the image during compilation. The kernel looks for handlers associated with each function and generally follows the same algorithm we described for 32-bit code.
Structured exception handling is heavily used within the kernel itself so that it can safely verify whether pointers from user mode can be safely accessed for read or write access. Drivers can make use of this same technique when dealing with pointers sent during I/O control codes (IOCTLs).
Another mechanism of exception handling is called vectored exception handling. This method can be used only by user-mode applications. You can find more information about it in the Windows SDK or Microsoft Docs at https://docs.microsoft.com/en-us/windows/win32/debug/vectored-exception-handling.
When an exception occurs, whether it is explicitly raised by software or implicitly raised by hardware, a chain of events begins in the kernel. The CPU hardware transfers control to the kernel trap handler, which creates a trap frame (as it does when an interrupt occurs). The trap frame allows the system to resume where it left off if the exception is resolved. The trap handler also creates an exception record that contains the reason for the exception and other pertinent information.
If the exception occurred in kernel mode, the exception dispatcher simply calls a routine to locate a frame-based exception handler that will handle the exception. Because unhandled kernel-mode exceptions are considered fatal operating system errors, you can assume that the dispatcher always finds an exception handler. Some traps, however, do not lead into an exception handler because the kernel always assumes such errors to be fatal; these are errors that could have been caused only by severe bugs in the internal kernel code or by major inconsistencies in driver code (that could have occurred only through deliberate, low-level system modifications that drivers should not be responsible for). Such fatal errors will result in a bug check with the UNEXPECTED_KERNEL_MODE_TRAP code.
If the exception occurred in user mode, the exception dispatcher does something more elaborate. The Windows subsystem has a debugger port (this is actually a debugger object, which will be discussed later) and an exception port to receive notification of user-mode exceptions in Windows processes. (In this case, by “port” we mean an ALPC port object, which will be discussed later in this chapter.) The kernel uses these ports in its default exception handling, as illustrated in Figure 8-24.

Figure 8-24 Dispatching an exception.
Debugger breakpoints are common sources of exceptions. Therefore, the first action the exception dispatcher takes is to see whether the process that incurred the exception has an associated debugger process. If it does, the exception dispatcher sends a debugger object message to the debug object associated with the process (which internally the system refers to as a “port” for compatibility with programs that might rely on behavior in Windows 2000, which used an LPC port instead of a debug object).
If the process has no debugger process attached or if the debugger doesn’t handle the exception, the exception dispatcher switches into user mode, copies the trap frame to the user stack formatted as a CONTEXT data structure (documented in the Windows SDK), and calls a routine to find a structured or vectored exception handler. If none is found or if none handles the exception, the exception dispatcher switches back into kernel mode and calls the debugger again to allow the user to do more debugging. (This is called the second-chance notification.)
If the debugger isn’t running and no user-mode exception handlers are found, the kernel sends a message to the exception port associated with the thread’s process. This exception port, if one exists, was registered by the environment subsystem that controls this thread. The exception port gives the environment subsystem, which presumably is listening at the port, the opportunity to translate the exception into an environment-specific signal or exception. However, if the kernel progresses this far in processing the exception and the subsystem doesn’t handle the exception, the kernel sends a message to a systemwide error port that Csrss (Client/Server Run-Time Subsystem) uses for Windows Error Reporting (WER)—which is discussed in Chapter 10—and executes a default exception handler that simply terminates the process whose thread caused the exception.
Unhandled exceptions
All Windows threads have an exception handler that processes unhandled exceptions. This exception handler is declared in the internal Windows start-of-thread function. The start-of-thread function runs when a user creates a process or any additional threads. It calls the environment-supplied thread start routine specified in the initial thread context structure, which in turn calls the user-supplied thread start routine specified in the CreateThread call.
The generic code for the internal start-of-thread functions is shown here:
VOID RtlUserThreadStart(VOID)
{
    LPVOID StartAddress = RCX;   // Located in the initial thread context structure
    LPVOID Argument = RDX;   // Located in the initial thread context structure
    LPVOID Win32StartAddr;
    if (Kernel32ThreadInitThunkFunction != NULL) {
        Win32StartAddr = Kernel32ThreadInitThunkFunction;
    } else {
        Win32StartAddr = StartAddress;
    }
    __try
    {
        DWORD ThreadExitCode = Win32StartAddr(Argument);
        RtlExitUserThread(ThreadExitCode);
    }
    __except(RtlpGetExceptionFilter(GetExceptionInformation()))
    {
        NtTerminateProcess(NtCurrentProcess(), GetExceptionCode());
    }
}
Notice that the Windows unhandled exception filter is called if the thread has an exception that it doesn’t handle. The purpose of this function is to provide the system-defined behavior for what to do when an exception is not handled, which is to launch the WerFault.exe process. However, in a default configuration, the Windows Error Reporting service, described in Chapter 10, will handle the exception and this unhandled exception filter never executes.
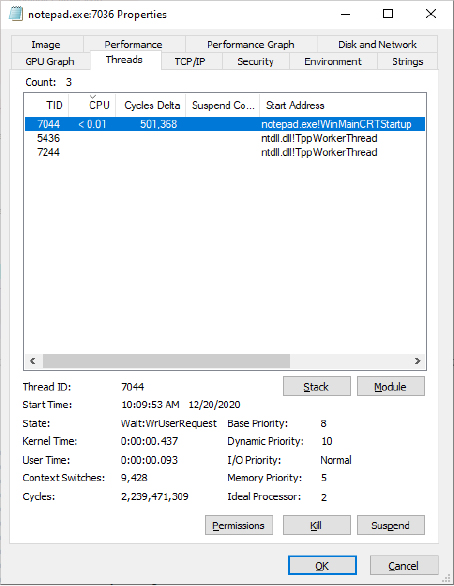


System service handling
As Figure 8-24 illustrated, the kernel’s trap handlers dispatch interrupts, exceptions, and system service calls. In the preceding sections, you saw how interrupt and exception handling work; in this section, you’ll learn about system services. A system service dispatch (shown in Figure 8-25) is triggered as a result of executing an instruction assigned to system service dispatching. The instruction that Windows uses for system service dispatching depends on the processor on which it is executing and whether Hypervisor Code Integrity (HVCI) is enabled, as you’re about to learn.
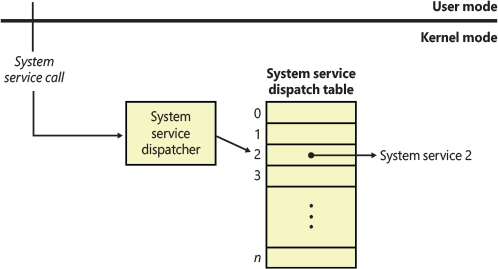
Figure 8-25 System service dispatching.
Architectural system service dispatching
On most x64 systems, Windows uses the syscall instruction, which results in the change of some of the key processor state we have learned about in this chapter, based on certain preprogrammed model specific registers (MSRs):
■ 0xC0000081, known as STAR (SYSCALL Target Address Register)
■ 0xC0000082, known as LSTAR (Long-Mode STAR)
■ 0xC0000084, known as SFMASK (SYSCALL Flags Mask)
Upon encountering the syscall instruction, the processor acts in the following manner:
■ The Code Segment (CS) is loaded from Bits 32 to 47 in STAR, which Windows sets to 0x0010 (KGDT64_R0_CODE).
■ The Stack Segment (SS) is loaded from Bits 32 to 47 in STAR plus 8, which gives us 0x0018 (KGDT_R0_DATA).
■ The Instruction Pointer (RIP) is saved in RCX, and the new value is loaded from LSTAR, which Windows sets to KiSystemCall64 if the Meltdown (KVA Shadowing) mitigation is not needed, or KiSystemCall64Shadow otherwise. (More information on the Meltdown vulnerability was provided in the “Hardware side-channel vulnerabilities” section earlier in this chapter.)
■ The current processor flags (RFLAGS) are saved in R11 and then masked with SFMASK, which Windows sets to 0x4700 (Trap Flag, Direction Flag, Interrupt Flag, and Nested Task Flag).
■ The Stack Pointer (RSP) and all other segments (DS, ES, FS, and GS) are kept to their current user-space values.
Therefore, although the instruction executes in very few processor cycles, it does leave the processor in an insecure and unstable state—the user-mode stack pointer is still loaded, GS is still pointing to the TEB, but the Ring Level, or CPL, is now 0, enabling kernel mode privileges. Windows acts quickly to place the processor in a consistent operating environment. Outside of the KVA shadow-specific operations that might happen on legacy processors, these are the precise steps that KiSystemCall64 must perform:
By using the swapgs instruction, GS now points to the PCR, as described earlier in this chapter.
The current stack pointer (RSP) is saved into the UserRsp field of the PCR. Because GS has now correctly been loaded, this can be done without using any stack or register.
The new stack pointer is loaded from the RspBase field of the PRCB (recall that this structure is stored as part of the PCR).
Now that the kernel stack is loaded, the function builds a trap frame, using the format described earlier in the chapter. This includes storing in the frame the SegSs set to KGDT_R3_DATA (0x2B), Rsp from the UserRsp in the PCR, EFlags from R11, SegCs set to KGDT_R3_CODE (0x33), and storing Rip from RCX. Normally, a processor trap would’ve set these fields, but Windows must emulate the behavior based on how syscall operates.
Loading RCX from R10. Normally, the x64 ABI dictates that the first argument of any function (including a syscall) be placed in RCX—yet the syscall instruction overrides RCX with the instruction pointer of the caller, as shown earlier. Windows is aware of this behavior and copies RCX into R10 before issuing the syscall instruction, as you’ll soon see, so this step restores the value.
The next steps have to do with processor mitigations such as Supervisor Mode Access Prevention (SMAP)—such as issuing the stac instruction—and the myriad processor side-channel mitigations, such as clearing the branch tracing buffers (BTB) or return store buffer (RSB). Additionally, on processors with Control-flow Enforcement Technology (CET), the shadow stack for the thread must also be synchronized correctly. Beyond this point, additional elements of the trap frame are stored, such as various nonvolatile registers and debug registers, and the nonarchitectural handling of the system call begins, which we discuss in more detail in just a bit.
Not all processors are x64, however, and it’s worth pointing out that on x86 processors, for example, a different instruction is used, which is called sysenter. As 32-bit processors are increasingly rare, we don’t spend too much time digging into this instruction other than mentioning that its behavior is similar—a certain amount of processor state is loaded from various MSRs, and the kernel does some additional work, such as setting up the trap frame. More details can be found in the relevant Intel processor manuals. Similarly, ARM-based processors use the svc instruction, which has its own behavior and OS-level handling, but these systems still represent only a small minority of Windows installations.
There is one more corner case that Windows must handle: processors without Mode Base Execution Controls (MBEC) operating while Hypervisor Code Integrity (HVCI) is enabled suffer from a design issue that violates the promises HVCI provides. (Chapter 9 covers HVCI and MBEC.) Namely, an attacker could allocate user-space executable memory, which HVCI allows (by marking the respective SLAT entry as executable), and then corrupt the PTE (which is not protected against kernel modification) to make the virtual address appear as a kernel page. Because the MMU would see the page as being kernel, Supervisor Mode Execution Prevention (SMEP) would not prohibit execution of the code, and because it was originally allocated as a user physical page, the SLAT entry wouldn’t prohibit the execution either. The attacker has now achieved arbitrary kernel-mode code execution, violating the basic tenet of HVCI.
MBEC and its sister technologies (Restricted User Mode) fix this issue by introducing distinct kernel versus user executable bits in the SLAT entry data structures, allowing the hypervisor (or the Secure Kernel, through VTL1-specific hypercalls) to mark user pages as kernel non executable but user executable. Unfortunately, on processors without this capability, the hypervisor has no choice but to trap all code privilege level changes and swap between two different sets of SLAT entries—ones marking all user physical pages as nonexecutable, and ones marking them as executable. The hypervisor traps CPL changes by making the IDT appear empty (effectively setting its limit to 0) and decoding the underlying instruction, which is an expensive operation. However, as interrupts can directly be trapped by the hypervisor, avoiding these costs, the system call dispatch code in user space prefers issuing an interrupt if it detects an HVCI-enabled system without MBEC-like capabilities. The SystemCall bit in the Shared User Data structure described in Chapter 4, Part 1, is what determines this situation.
Therefore, when SystemCall is set to 1, x64 Windows uses the int 0x2e instruction, which results in a trap, including a fully built-out trap frame that does not require OS involvement. Interestingly, this happens to be the same instruction that was used on ancient x86 processors prior to the Pentium Pro, and continues to still be supported on x86 systems for backward compatibility with three-decade-old software that had unfortunately hardcoded this behavior. On x64, however, int 0x2e can be used only in this scenario because the kernel will not fill out the relevant IDT entry otherwise.
Regardless of which instruction is ultimately used, the user-mode system call dispatching code always stores a system call index in a register—EAX on x86 and x64, R12 on 32-bit ARM, and X8 on ARM64—which will be further inspected by the nonarchitectural system call handling code we’ll see next. And, to make things easy, the standard function call processor ABI (application binary interface) is maintained across the boundary—for example, arguments are placed on the stack on x86, and RCX (technically R10 due to the behavior of syscall), RDX, R8, R9 plus the stack for any arguments past the first four on x64.
Once dispatching completes, how does the processor return to its old state? For trap-based system calls that occurred through int 0x2e, the iret instruction restores the processor state based on the hardware trap frame on the stack. For syscall and sysenter, though, the processor once again leverages the MSRs and hardcoded registers we saw on entry, through specialized instructions called sysret and sysexit, respectively. Here’s how the former behaves:
■ The Stack Segment (SS) is loaded from bits 48 to 63 in STAR, which Windows sets to 0x0023 (KGDT_R3_DATA).
■ The Code Segment (CS) is loaded from bits 48 to 63 in STAR plus 0x10, which gives us 0x0033 (KGDT64_R3_CODE).
■ The Instruction Pointer (RIP) is loaded from RCX.
■ The processor flags (RFLAGS) are loaded from R11.
■ The Stack Pointer (RSP) and all other segments (DS, ES, FS, and GS) are kept to their current kernel-space values.
Therefore, just like for system call entry, the exit mechanics must also clean up some processor state. Namely, RSP is restored to the Rsp field that was saved on the manufactured hardware trap frame from the entry code we analyzed, similar to all the other saved registers. RCX register is loaded from the saved Rip, R11 is loaded from EFlags, and the swapgs instruction is used right before issuing the sysret instruction. Because DS, ES, and FS were never touched, they maintain their original user-space values. Finally, EDX and XMM0 through XMM5 are zeroed out, and all other nonvolatile registers are restored from the trap frame before the sysret instruction. Equivalent actions are taken on for sysexit and ARM64’s exit instruction (eret). Additionally, if CET is enabled, just like in the entry path, the shadow stack must correctly be synchronized on the exit path.
Nonarchitectural system service dispatching
As Figure 8-25 illustrates, the kernel uses the system call number to locate the system service information in the system service dispatch table. On x86 systems, this table is like the interrupt dispatch table described earlier in the chapter except that each entry contains a pointer to a system service rather than to an interrupt-handling routine. On other platforms, including 32-bit ARM and ARM64, the table is implemented slightly differently; instead of containing pointers to the system service, it contains offsets relative to the table itself. This addressing mechanism is more suited to the x64 and ARM64 application binary interface (ABI) and instruction-encoding format, and the RISC nature of ARM processors in general.
![]() Note
Note
System service numbers frequently change between OS releases. Not only does Microsoft occasionally add or remove system services, but the table is also often randomized and shuffled to break attacks that hardcode system call numbers to avoid detection.
Regardless of architecture, the system service dispatcher performs a few common actions on all platforms:
■ Save additional registers in the trap frame, such as debug registers or floating-point registers.
■ If this thread belongs to a pico process, forward to the system call pico provider routine (see Chapter 3, Part 1, for more information on pico providers).
■ If this thread is an UMS scheduled thread, call KiUmsCallEntry to synchronize with the primary (see Chapter 1, Part 1, for an introduction on UMS). For UMS primary threads, set the UmsPerformingSyscall flag in the thread object.
■ Save the first parameter of the system call in the FirstArgument field of the thread object and the system call number in SystemCallNumber.
■ Call the shared user/kernel system call handler (KiSystemServiceStart), which sets the TrapFrame field of the thread object to the current stack pointer where it is stored.
■ Enable interrupt delivery.
At this point, the thread is officially undergoing a system call, and its state is fully consistent and can be interrupted. The next step is to select the correct system call table and potentially upgrade the thread to a GUI thread, details of which will be based on the GuiThread and RestrictedGuiThread fields of the thread object, and which will be described in the next section. Following that, GDI Batching operations will occur for GUI threads, as long as the TEB’s GdiBatchCount field is non-zero.
Next, the system call dispatcher must copy any of the caller’s arguments that are not passed by register (which depends on the CPU architecture) from the thread’s user-mode stack to its kernel-mode stack. This is needed to avoid having each system call manually copy the arguments (which would require assembly code and exception handling) and ensure that the user can’t change the arguments as the kernel is accessing them. This operation is done within a special code block that is recognized by the exception handlers as being associated to user stack copying, ensuring that the kernel does not crash in the case that an attacker, or incorrectly written program, is messing with the user stack. Since system calls can take an arbitrary number of arguments (well, almost), you see in the next section how the kernel knows how many to copy.
Note that this argument copying is shallow: If any of the arguments passed to a system service points to a buffer in user space, it must be probed for safe accessibility before kernel-mode code can read and/or write from it. If the buffer will be accessed multiple times, it may also need to be captured, or copied, into a local kernel buffer. The responsibility of this probe and capture operation lies with each individual system call and is not performed by the handler. However, one of the key operations that the system call dispatcher must perform is to set the previous mode of the thread. This value corresponds to either KernelMode or UserMode and must be synchronized whenever the current thread executes a trap, identifying the privilege level of the incoming exception, trap, or system call. This will allow the system call, using ExGetPreviousMode, to correctly handle user versus kernel callers.
Finally, two last steps are taken as part of the dispatcher’s body. First, if DTrace is configured and system call tracing is enabled, the appropriate entry/exit callbacks are called around the system call. Alternatively, if ETW tracing is enabled but not DTrace, the appropriate ETW events are logged around the system call. Finally, if neither DTrace nor ETW are enabled, the system call is made without any additional logic. The second, and final, step, is to increment the KeSystemCalls variable in the PRCB, which is exposed as a performance counter that you can track in the Performance & Reliability Monitor.
At this point, system call dispatching is complete, and the opposite steps will then be taken as part of system call exit. These steps will restore and copy user-mode state as appropriate, handle user-mode APC delivery as needed, address side-channel mitigations around various architectural buffers, and eventually return with one of the CPU instructions relevant for this platform.
Kernel-issued system call dispatching
Because system calls can be performed both by user-mode code and kernel mode, any pointers, handles, and behaviors should be treated as if coming from user mode—which is clearly not correct.
To solve this, the kernel exports specialized Zw versions of these calls—that is, instead of NtCreateFile, the kernel exports ZwCreateFile. Additionally, because Zw functions must be manually exported by the kernel, only the ones that Microsoft wishes to expose for third-party use are present. For example, ZwCreateUserProcess is not exported by name because kernel drivers are not expected to launch user applications. These exported APIs are not actually simple aliases or wrappers around the Nt versions. Instead, they are “trampolines” to the appropriate Nt system call, which use the same system call-dispatching mechanism.
Like KiSystemCall64 does, they too build a fake hardware trap frame (pushing on the stack the data that the CPU would generate after an interrupt coming from kernel mode), and they also disable interrupts, just like a trap would. On x64 systems, for example, the KGDT64_R0_CODE (0x0010) selector is pushed as CS, and the current kernel stack as RSP. Each of the trampolines places the system call number in the appropriate register (for example, EAX on x86 and x64), and then calls KiServiceInternal, which saves additional data in the trap frame, reads the current previous mode, stores it in the trap frame, and then sets the previous mode to KernelMode (this is an important difference).
User-issued system call dispatching
As was already introduced in Chapter 1 of Part 1, the system service dispatch instructions for Windows executive services exist in the system library Ntdll.dll. Subsystem DLLs call functions in Ntdll to implement their documented functions. The exception is Windows USER and GDI functions, including DirectX Kernel Graphics, for which the system service dispatch instructions are implemented in Win32u.dll. Ntdll.dll is not involved. These two cases are shown in Figure 8-26.
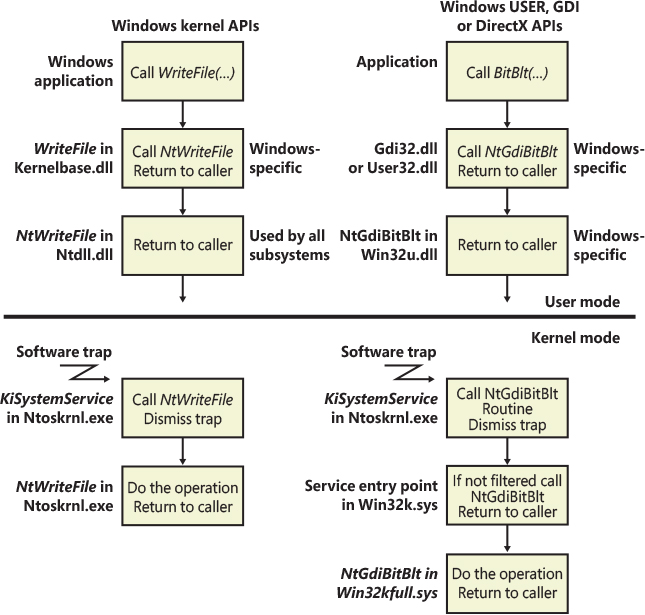
Figure 8-26 System service dispatching.
As shown in the figure, the Windows WriteFile function in Kernel32.dll imports and calls the WriteFile function in API-MS-Win-Core-File-L1-1-0.dll, one of the MinWin redirection DLLs (see Chapter 3, Part 1, for more information on API redirection), which in turn calls the WriteFile function in KernelBase.dll, where the actual implementation lies. After some subsystem-specific parameter checks, it then calls the NtWriteFile function in Ntdll.dll, which in turn executes the appropriate instruction to cause a system service trap, passing the system service number representing NtWriteFile.
The system service dispatcher in Ntoskrnl.exe (in this example, KiSystemService) then calls the real NtWriteFile to process the I/O request. For Windows USER, GDI, and DirectX Kernel Graphics functions, the system service dispatch calls the function in the loadable kernel-mode part of the Windows subsystem, Win32k.sys, which might then filter the system call or forward it to the appropriate module, either Win32kbase.sys or Win32kfull.sys on Desktop systems, Win32kmin.sys on Windows 10X systems, or Dxgkrnl.sys if this was a DirectX call.
System call security
Since the kernel has the mechanisms that it needs for correctly synchronizing the previous mode for system call operations, each system call service can rely on this value as part of processing. We previously mentioned that these functions must first probe any argument that’s a pointer to a user-mode buffer of any sort. By probe, we mean the following:
Making sure that the address is below MmUserProbeAddress, which is 64 KB below the highest user-mode address (such as 0x7FFF0000 on 32-bit).
Making sure that the address is aligned to a boundary matching how the caller intends to access its data—for example, 2 bytes for Unicode characters, 8 bytes for a 64-bit pointer, and so on.
If the buffer is meant to be used for output, making sure that, at the time the system call begins, it is actually writable.
Note that output buffers could become invalid or read-only at any future point in time, and the system call must always access them using SEH, which we described earlier in this chapter, to avoid crashing the kernel. For a similar reason, although input buffers aren’t checked for readability, because they will likely be imminently used anyway, SEH must be used to ensure they can be safely read. SEH doesn’t protect against alignment mismatches or wild kernel pointers, though, so the first two steps must still be taken.
It’s obvious that the first check described above would fail for any kernel-mode caller right away, and this is the first part where previous mode comes in—probing is skipped for non-UserMode calls, and all buffers are assumed to be valid, readable and/or writeable as needed. This isn’t the only type of validation that a system call must perform, however, because some other dangerous situations can arise:
■ The caller may have supplied a handle to an object. The kernel normally bypasses all security access checks when referencing objects, and it also has full access to kernel handles (which we describe later in the “Object Manager” section of this chapter), whereas user-mode code does not. The previous mode is used to inform the Object Manager that it should still perform access checks because the request came from user space.
■ In even more complex cases, it’s possible that flags such as OBJ_FORCE_ACCESS_CHECK need to be used by a driver to indicate that even though it is using the Zw API, which sets the previous mode to KernelMode, the Object Manager should still treat the request as if coming from UserMode.
■ Similarly, the caller may have specified a file name. It’s important for the system call, when opening the file, to potentially use the IO_FORCE_ACCESS_CHECKING flag, to force the security reference monitor to validate access to the file system, as otherwise a call such as ZwCreateFile would change the previous mode to KernelMode and bypass access checks. Potentially, a driver may also have to do this if it’s creating a file on behalf of an IRP from user-space.
■ File system access also brings risks with regard to symbolic links and other types of redirection attacks, where privileged kernel-mode code might be incorrectly using various process-specific/user-accessible reparse points.
■ Finally, and in general, any operation that results in a chained system call, which is performed with the Zw interface, must keep in mind that this will reset the previous mode to KernelMode and respond accordingly.
Service descriptor tables
We previously mentioned that before performing a system call, the user-mode or kernel-mode trampolines will first place a system call number in a processor register such as RAX, R12, or X8. This number is technically composed of two elements, which are shown in Figure 8-27. The first element, stored in the bottom 12 bits, represents the system call index. The second, which uses the next higher 2 bits (12-13), is the table identifier. As you’re about to see, this allows the kernel to implement up to four different types of system services, each stored in a table that can house up to 4096 system calls.
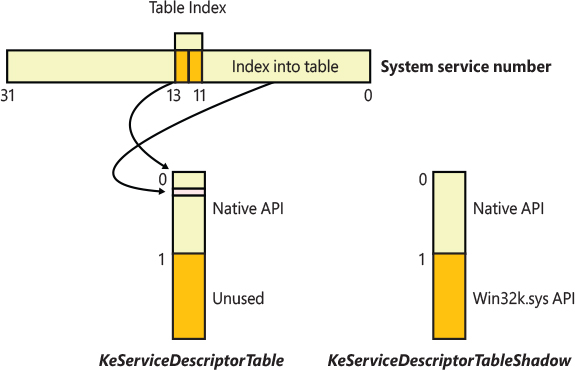
Figure 8-27 System service number to system service translation.
The kernel keeps track of the system service tables using three possible arrays—KeServiceDescriptorTable, KeServiceDescriptorTableShadow, and KeServiceDescriptorTableFilter. Each of these arrays can have up to two entries, which store the following three pieces of data:
■ A pointer to the array of system calls implemented by this service table
■ The number of system calls present in this service table, called the limit
■ A pointer to the array of argument bytes for each of the system calls in this service table
The first array only ever has one entry, which points to KiServiceTable and KiArgumentTable, with a little over 450 system calls (the precise number depends on your version of Windows). All threads, by default, issue system calls that only access this table. On x86, this is enforced by the ServiceTable pointer in the thread object, while all other platforms hardcode the symbol KeServiceDescriptorTable in the system call dispatcher.
The first time that a thread makes a system call that’s beyond the limit, the kernel calls PsConvertToGuiThread, which notifies the USER and GDI services in Win32k.sys about the thread and sets either the thread object’s GuiThread flag or its RestrictedGuiThread flag after these return successfully. Which one is used depends on whether the EnableFilteredWin32kSystemCalls process mitigation option is enabled, which we described in the “Process-mitigation policies” section of Chapter 7, Part 1. On x86 systems, the thread object’s ServiceTable pointer now changes to KeServiceDescriptorTableShadow or KeServiceDescriptorTableFilter depending on which of the flags is set, while on other platforms it is a hardcoded symbol chosen at each system call. (Although less performant, the latter avoids an obvious hooking point for malicious software to abuse.)
As you can probably guess, these other arrays include a second entry, which represents the Windows USER and GDI services implemented in the kernel-mode part of the Windows subsystem, Win32k.sys, and, more recently, the DirectX Kernel Subsystem services implemented by Dxgkrnl.sys, albeit these still transit through Win32k.sys initially. This second entry points to W32pServiceTable or W32pServiceTableFilter and W32pArgumentTable or W32pArgumentTableFilter, respectively, and has about 1250 system calls or more, depending on your version of Windows.
![]() Note
Note
Because the kernel does not link against Win32k.sys, it exports a KeAddSystemServiceTable function that allows the addition of an additional entry into the KeServiceDescriptorTableShadow and the KeServiceDescriptorTableFilter table if it has not already been filled out. If Win32k.sys has already called these APIs, the function fails, and PatchGuard protects the arrays once this function has been called, so that the structures effectively become read only.
The only material difference between the Filter entries is that they point to system calls in Win32k.sys with names like stub_UserGetThreadState, while the real array points to NtUserGetThreadState. The former stubs will check if Win32k.sys filtering is enabled for this system call, based, in part, on the filter set that’s been loaded for the process. Based on this determination, they will either fail the call and return STATUS_INVALID_SYSTEM_SERVICE if the filter set prohibits it or end up calling the original function (such as NtUserGetThreadState), with potential telemetry if auditing is enabled.
The argument tables, on the other hand, are what help the kernel to know how many stack bytes need to be copied from the user stack into the kernel stack, as explained in the dispatching section earlier. Each entry in the argument table corresponds to the matching system call with that index and stores the count of bytes to copy (up to 255). However, kernels for platforms other than x86 employ a mechanism called system call table compaction, which combines the system call pointer from the call table with the byte count from the argument table into a single value. The feature works as follows:
Take the system call function pointer and compute the 32-bit difference from the beginning of the system call table itself. Because the tables are global variables inside of the same module that contains the functions, this range of ±2 GB should be more than enough.
Take the stack byte count from the argument table and divide it by 4, converting it into an argument count (some functions might take 8-byte arguments, but for these purposes, they’ll simply be considered as two “arguments”).
Shift the 32-bit difference from the first step by 4 bits to the left, effectively making it a 28-bit difference (again, this is fine—no kernel component is more than 256 MB) and perform a bitwise or operation to add the argument count from the second step.
Override the system call function pointer with the value obtained in step 3.
This optimization, although it may look silly at first, has a number of advantages: It reduces cache usage by not requiring two distinct arrays to be looked up during a system call, it simplifies the amount of pointer dereferences, and it acts as a layer of obfuscation, which makes it harder to hook or patch the system call table while making it easier for PatchGuard to defend it.

WoW64 (Windows-on-Windows)
WoW64 (Win32 emulation on 64-bit Windows) refers to the software that permits the execution of 32-bit applications on 64-bit platforms (which can also belong to a different architecture). WoW64 was originally a research project for running x86 code in old alpha and MIPS version of Windows NT 3.51. It has drastically evolved since then (that was around the year 1995). When Microsoft released Windows XP 64-bit edition in 2001, WoW64 was included in the OS for running old x86 32-bit applications in the new 64-bit OS. In modern Windows releases, WoW64 has been expanded to support also running ARM32 applications and x86 applications on ARM64 systems.
WoW64 core is implemented as a set of user-mode DLLs, with some support from the kernel for creating the target’s architecture versions of what would normally only be 64-bit native data structures, such as the process environment block (PEB) and thread environment block (TEB). Changing WoW64 contexts through Get/SetThreadContext is also implemented by the kernel. Here are the core user-mode DLLs responsible for WoW64:
■ Wow64.dll Implements the WoW64 core in user mode. Creates the thin software layer that acts as a kind of intermediary kernel for 32-bit applications and starts the simulation. Handles CPU context state changes and base system calls exported by Ntoskrnl.exe. It also implements file-system redirection and registry redirection.
■ Wow64win.dll Implements thunking (conversion) for GUI system calls exported by Win32k.sys. Both Wow64win.dll and Wow64.dll include thunking code, which converts a calling convention from an architecture to another one.
Some other modules are architecture-specific and are used for translating machine code that belongs to a different architecture. In some cases (like for ARM64) the machine code needs to be emulated or jitted. In this book, we use the term jitting to refer to the just-in-time compilation technique that involves compilation of small code blocks (called compilation units) at runtime instead of emulating and executing one instruction at a time.
Here are the DLLs that are responsible in translating, emulating, or jitting the machine code, allowing it to be run by the target operating system:
■ Wow64cpu.dll Implements the CPU simulator for running x86 32-bit code in AMD64 operating systems. Manages the 32-bit CPU context of each running thread inside WoW64 and provides processor architecture-specific support for switching CPU mode from 32-bit to 64-bit and vice versa.
■ Wowarmhw.dll Implements the CPU simulator for running ARM32 (AArch32) applications on ARM64 systems. It represents the ARM64 equivalent of the Wow64cpu.dll used in x86 systems.
■ Xtajit.dll Implements the CPU emulator for running x86 32-bit applications on ARM64 systems. Includes a full x86 emulator, a jitter (code compiler), and the communication protocol between the jitter and the XTA cache server. The jitter can create compilation blocks including ARM64 code translated from the x86 image. Those blocks are stored in a local cache.
The relationship of the WoW64 user-mode libraries (together with other core WoW64 components) is shown in Figure 8-28.
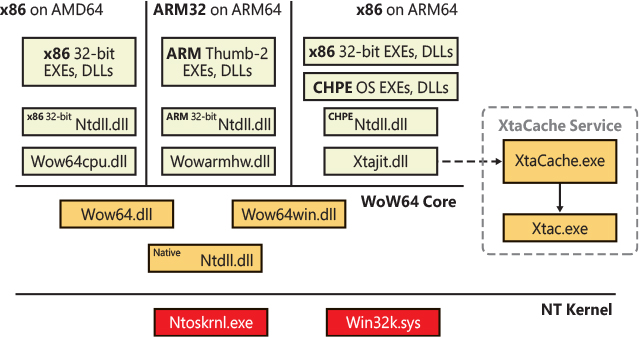
Figure 8-28 The WoW64 architecture.
![]() Note
Note
Older Windows versions designed to run in Itanium machines included a full x86 emulator integrated in the WoW64 layer called Wowia32x.dll. Itanium processors were not able to natively execute x86 32-bit instructions in an efficient manner, so an emulator was needed. The Itanium architecture was officially discontinued in January 2019.
A newer Insider release version of Windows also supports executing 64-bit x86 code on ARM64 systems. A new jitter has been designed for that reason. However emulating AMD64 code in ARM systems is not performed through WoW64. Describing the architecture of the AMD64 emulator is outside the scope of this release of this book.
The WoW64 core
As introduced in the previous section, the WoW64 core is platform independent: It creates a software layer for managing the execution of 32-bit code in 64-bit operating systems. The actual translation is performed by another component called Simulator (also known as Binary Translator), which is platform specific. In this section, we will discuss the role of the WoW64 core and how it interoperates with the Simulator. While the core of WoW64 is almost entirely implemented in user mode (in the Wow64.dll library), small parts of it reside in the NT kernel.
WoW64 core in the NT kernel
During system startup (phase 1), the I/O manager invokes the PsLocateSystemDlls routine, which maps all the system DLLs supported by the system (and stores their base addresses in a global array) in the System process user address space. This also includes WoW64 versions of Ntdll, as described by Table 8-13. Phase 2 of the process manager (PS) startup resolves some entry points of those DLLs, which are stored in internal kernel variables. One of the exports, LdrSystemDllInitBlock, is used to transfer WoW64 information and function pointers to new WoW64 processes.
Table 8-13 Different Ntdll version list
Path |
Internal Name |
Description |
|---|---|---|
c:windowssystem32 tdll.dll |
ntdll.dll |
The system Ntdll mapped in every user process (except for minimal processes). This is the only version marked as required. |
c:windowsSysWow64 tdll.dll |
ntdll32.dll |
32-bit x86 Ntdll mapped in WoW64 processes running in 64-bit x86 host systems. |
c:windowsSysArm32 tdll.dll |
ntdll32.dll |
32-bit ARM Ntdll mapped in WoW64 processes running in 64-bit ARM host systems. |
c:windowsSyChpe32 tdll.dll |
ntdllwow.dll |
32-bit x86 CHPE Ntdll mapped in WoW64 processes running in 64-bit ARM host systems. |
When a process is initially created, the kernel determines whether it would run under WoW64 using an algorithm that analyzes the main process executable PE image and checks whether the correct Ntdll version is mapped in the system. In case the system has determined that the process is WoW64, when the kernel initializes its address space, it maps both the native Ntdll and the correct WoW64 version. As explained in Chapter 3 of Part 1, each nonminimal process has a PEB data structure that is accessible from user mode. For WoW64 processes, the kernel also allocates the 32-bit version of the PEB and stores a pointer to it in a small data structure (EWoW64PROCESS) linked to the main EPROCESS representing the new process. The kernel then fills the data structure described by the 32-bit version of the LdrSystemDllInitBlock symbol, including pointers of Wow64 Ntdll exports.
When a thread is allocated for the process, the kernel goes through a similar process: along with the thread initial user stack (its initial size is specified in the PE header of the main image), another stack is allocated for executing 32-bit code. The new stack is called the thread’s WoW64 stack. When the thread’s TEB is built, the kernel will allocate enough memory to store both the 64-bit TEB, followed by a 32-bit TEB.
Furthermore, a small data structure (called WoW64 CPU Area Information) is allocated at the base of the 64-bit stack. The latter is composed of the target images machine identifier, a platform-dependent 32-bit CPU context (X86_NT5_CONTEXT or ARM_CONTEXT data structures, depending on the target architecture), and a pointer of the per-thread WoW64 CPU shared data, which can be used by the Simulator. A pointer to this small data structure is stored also in the thread’s TLS slot 1 for fast referencing by the binary translator. Figure 8-29 shows the final configuration of a WoW64 process that contains an initial single thread.
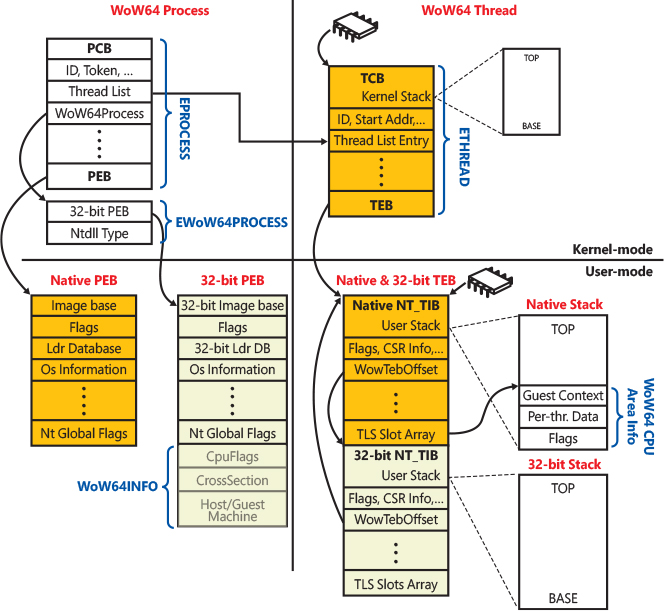
Figure 8-29 Internal configuration of a WoW64 process with only a single thread.
User-mode WoW64 core
Aside from the differences described in the previous section, the birth of the process and its initial thread happen in the same way as for non-WoW64 processes, until the main thread starts its execution by invoking the loader initialization function, LdrpInitialize, in the native version of Ntdll. When the loader detects that the thread is the first to be executed in the context of the new process, it invokes the process initialization routine, LdrpInitializeProcess, which, along with a lot of different things (see the “Early process initialization” section of Chapter 3 in Part 1 for further details), determines whether the process is a WoW64 one, based on the presence of the 32-bit TEB (located after the native TEB and linked to it). In case the check succeeded, the native Ntdll sets the internal UseWoW64 global variable to 1, builds the path of the WoW64 core library, wow64.dll, and maps it above the 4 GB virtual address space limit (in that way it can’t interfere with the simulated 32-bit address space of the process.) It then gets the address of some WoW64 functions that deal with process/thread suspension and APC and exception dispatching and stores them in some of its internal variables.
When the process initialization routine ends, the Windows loader transfers the execution to the WoW64 Core via the exported Wow64LdrpInitialize routine, which will never return. From now on, each new thread starts through that entry point (instead of the classical RtlUserThreadStart). The WoW64 core obtains a pointer to the CPU WoW64 area stored by the kernel at the TLS slot 1. In case the thread is the first of the process, it invokes the WoW64 process initialization routine, which performs the following steps:
Tries to load the WoW64 Thunk Logging DLL (wow64log.dll). The Dll is used for logging WoW64 calls and is not included in commercial Windows releases, so it is simply skipped.
Looks up the Ntdll32 base address and function pointers thanks to the LdrSystemDllInitBlock filled by the NT kernel.
Initializes the files system and registry redirection. File system and registry redirection are implemented in the Syscall layer of WoW64 core, which intercepts 32-bit registry and files system requests and translates their path before invoking the native system calls.
Initializes the WoW64 service tables, which contains pointers to system services belonging to the NT kernel and Win32k GUI subsystem (similar to the standard kernel system services), but also Console and NLS service call (both WoW64 system service calls and redirection are covered later in this chapter.)
Fills the 32-bit version of the process’s PEB allocated by the NT kernel and loads the correct CPU simulator, based on the process main image’s architecture. The system queries the “default” registry value of the HKLMSOFTWAREMicrosoftWow64<arch> key (where <arch> can be x86 or arm, depending on the target architecture), which contains the simulator’s main DLL name. The simulator is then loaded and mapped in the process’s address space. Some of its exported functions are resolved and stored in an internal array called BtFuncs. The array is the key that links the platform-specific binary translator to the WoW64 subsystem: WoW64 invokes simulator’s functions only through it. The BtCpuProcessInit function, for example, represents the simulator’s process initialization routine.
The thunking cross-process mechanism is initialized by allocating and mapping a 16 KB shared section. A synthesized work item is posted on the section when a WoW64 process calls an API targeting another 32-bit process (this operation propagates thunk operations across different processes).
The WoW64 layer informs the simulator (by invoking the exported BtCpuNotifyMapViewOfSection) that the main module, and the 32-bit version of Ntdll have been mapped in the address space.
Finally, the WoW64 core stores a pointer to the 32-bit system call dispatcher into the Wow64Transition exported variable of the 32-bit version of Ntdll. This allows the system call dispatcher to work.
When the process initialization routine ends, the thread is ready to start the CPU simulation. It invokes the Simulator’s thread initialization function and prepares the new 32-bit context, translating the 64-bit one initially filled by the NT kernel. Finally, based on the new context, it prepares the 32-bit stack for executing the 32-bit version of the LdrInitializeThunk function. The simulation is started via the simulator’s BTCpuSimulate exported function, which will never return to the caller (unless a critical error in the simulator happens).
File system redirection
To maintain application compatibility and to reduce the effort of porting applications from Win32 to 64-bit Windows, system directory names were kept the same. Therefore, the WindowsSystem32 folder contains native 64-bit images. WoW64, as it intercepts all the system calls, translates all the path related APIs and replaces various system paths with the WoW64 equivalent (which depends on the target process’s architecture), as listed in Table 8-14. The table also shows paths redirected through the use of system environment variables. (For example, the %PROGRAMFILES% variable is also set to Program Files (x86) for 32-bit applications, whereas it is set to the Program Files folder for 64-bit applications.)
Table 8-14 WoW64 redirected paths
Path |
Architecture |
Redirected Location |
|---|---|---|
c:windowssystem32 |
X86 on AMD64 |
C:WindowsSysWow64 |
X86 on ARM64 |
C:WindowsSyChpe32 (or C:WindowsSysWow64 if the target file does not exist in SyChpe32) |
|
ARM32 |
C:WindowsSysArm32 |
|
%ProgramFiles% |
Native |
C:Program Files |
X86 |
C:Program Files (x86) |
|
ARM32 |
C:Program Files (Arm) |
|
%CommonProgramFiles% |
Native |
C:Program FilesCommon Files |
X86 |
C:Program Files (x86) |
|
ARM32 |
C:Program Files (Arm)Common Files |
|
C:Windows egedit.exe |
X86 |
C:WindowsSysWow64 egedit.exe |
ARM32 |
C:WindowsSysArm32 egedit.exe |
|
C:WindowsLastGoodSystem32 |
X86 |
C:WindowsLastGoodSysWow64 |
ARM32 |
C:WindowsLastGoodSysArm32 |
There are a few subdirectories of WindowsSystem32 that, for compatibility and security reasons, are exempted from being redirected such that access attempts to them made by 32-bit applications actually access the real one. These directories include the following:
■ %windir%system32catroot and %windir%system32catroot2
■ %windir%system32driverstore
■ %windir%system32driversetc
■ %windir%system32hostdriverstore
■ %windir%system32logfiles
■ %windir%system32spool
Finally, WoW64 provides a mechanism to control the file system redirection built into WoW64 on a per-thread basis through the Wow64DisableWow64FsRedirection and Wow64RevertWow64FsRedirection functions. This mechanism works by storing an enabled/disabled value on the TLS index 8, which is consulted by the internal WoW64 RedirectPath function. However, the mechanism can have issues with delay-loaded DLLs, opening files through the common file dialog and even internationalization—because once redirection is disabled, the system no longer uses it during internal loading either, and certain 64-bit-only files would then fail to be found. Using the %SystemRoot%Sysnative path or some of the other consistent paths introduced earlier is usually a safer methodology for developers to use.
![]() Note
Note
Because certain 32-bit applications might indeed be aware and able to deal with 64-bit images, a virtual directory, WindowsSysnative, allows any I/Os originating from a 32-bit application to this directory to be exempted from file redirection. This directory doesn’t actually exist—it is a virtual path that allows access to the real System32 directory, even from an application running under WoW64.
Registry redirection
Applications and components store their configuration data in the registry. Components usually write their configuration data in the registry when they are registered during installation. If the same component is installed and registered both as a 32-bit binary and a 64-bit binary, the last component registered will override the registration of the previous component because they both write to the same location in the registry.
To help solve this problem transparently without introducing any code changes to 32-bit components, the registry is split into two portions: Native and WoW64. By default, 32-bit components access the 32-bit view, and 64-bit components access the 64-bit view. This provides a safe execution environment for 32-bit and 64-bit components and separates the 32-bit application state from the 64-bit one, if it exists.
As discussed later in the “System calls” section, the WoW64 system call layer intercepts all the system calls invoked by a 32-bit process. When WoW64 intercepts the registry system calls that open or create a registry key, it translates the key path to point to the WoW64 view of the registry (unless the caller explicitly asks for the 64-bit view.) WoW64 can keep track of the redirected keys thanks to multiple tree data structures, which store a list of shared and split registry keys and subkeys (an anchor tree node defines where the system should begin the redirection). WoW64 redirects the registry at these points:
■ HKLMSOFTWARE
■ HKEY_CLASSES_ROOT
Not the entire hive is split. Subkeys belonging to those root keys can be stored in the private WoW64 part of the registry (in this case, the subkey is a split key). Otherwise, the subkey can be kept shared between 32-bit and 64-bit apps (in this case, the subkey is a shared key). Under each of the split keys (in the position tracked by an anchor node), WoW64 creates a key called WoW6432Node (for x86 application) or WowAA32Node (for ARM32 applications). Under this key is stored 32-bit configuration information. All other portions of the registry are shared between 32-bit and 64-bit applications (for example, HKLMSYSTEM).
As extra help, if an x86 32-bit application writes a REG_SZ or REG_EXPAND_SZ value that starts with the data “%ProgramFiles%” or %CommonProgramFiles%” to the registry, WoW64 modifies the actual values to “%ProgramFiles(x86)%” and %CommonProgramFiles(x86)%” to match the file system redirection and layout explained earlier. The 32-bit application must write exactly these strings using this case—any other data will be ignored and written normally.
For applications that need to explicitly specify a registry key for a certain view, the following flags on the RegOpenKeyEx, RegCreateKeyEx, RegOpenKeyTransacted, RegCreateKeyTransacted, and RegDeleteKeyEx functions permit this:
■ KEY_WoW64_64KEY Explicitly opens a 64-bit key from either a 32-bit or 64-bit application and disables the REG_SZ or REG_EXPAND_SZ interception explained earlier
■ KEY_WoW64_32KEY Explicitly opens a 32-bit key from either a 32-bit or 64-bit application
X86 simulation on AMD64 platforms
The interface of the x86 simulator for AMD64 platforms (Wow64cpu.dll) is pretty simple. The simulator process initialization function enables the fast system call interface, depending on the presence of software MBEC (Mode Based Execute Control is discussed in Chapter 9). When the WoW64 core starts the simulation by invoking the BtCpuSimulate simulator’s interface, the simulator builds the WoW64 stack frame (based on the 32-bit CPU context provided by the WoW64 core), initializes the Turbo thunks array for dispatching fast system calls, and prepares the FS segment register to point to the thread’s 32-bit TEB. It finally sets up a call gate targeting a 32-bit segment (usually the segment 0x20), switches the stacks, and emits a far jump to the final 32-bit entry point (at the first execution, the entry point is set to the 32-bit version of the LdrInitializeThunk loader function). When the CPU executes the far jump, it detects that the call gate targets a 32-bit segment, thus it changes the CPU execution mode to 32-bit. The code execution exits 32-bit mode only in case of an interrupt or a system call being dispatched. More details about call gates are available in the Intel and AMD software development manuals.
![]() Note
Note
During the first switch to 32-bit mode, the simulator uses the IRET opcode instead of a far call. This is because all the 32-bit registers, including volatile registers and EFLAGS, need to be initialized.
System calls
For 32-bit applications, the WoW64 layer acts similarly to the NT kernel: special 32-bit versions of Ntdll.dll, User32.dll, and Gdi32.dll are located in the WindowsSyswow64 folder (as well as certain other DLLs that perform interprocess communication, such as Rpcrt4.dll). When a 32-bit application requires assistance from the OS, it invokes functions located in the special 32-bit versions of the OS libraries. Like their 64-bit counterparts, the OS routines can perform their job directly in user mode, or they can require assistance from the NT kernel. In the latter case, they invoke system calls through stub functions like the one implemented in the regular 64-bit Ntdll. The stub places the system call index into a register, but, instead of issuing the native 32-bit system call instruction, it invokes the WoW64 system call dispatcher (through the Wow64Transition variable compiled by the WoW64 core).
The WoW64 system call dispatcher is implemented in the platform-specific simulator (wow64cpu.dll). It emits another far jump for transitioning to the native 64-bit execution mode, exiting from the simulation. The binary translator switches the stack to the 64-bit one and saves the old CPU’s context. It then captures the parameters associated with the system call and converts them. The conversion process is called “thunking” and allows machine code executed following the 32-bit ABI to interoperate with 64-bit code. The calling convention (which is described by the ABI) defines how data structure, pointers, and values are passed in parameters of each function and accessed through the machine code.
Thunking is performed in the simulator using two strategies. For APIs that do not interoperate with complex data structures provided by the client (but deal with simple input and output values), the Turbo thunks (small conversion routines implemented in the simulator) take care of the conversion and directly invoke the native 64-bit API. Other complex APIs need the Wow64SystemServiceEx routine’s assistance, which extracts the correct WoW64 system call table number from the system call index and invokes the correct WoW64 system call function. WoW64 system calls are implemented in the WoW64 core library and in Wow64win.dll and have the same name as the native system calls but with the wh- prefix. (So, for example, the NtCreateFile WoW64 API is called whNtCreateFile.)
After the conversion has been correctly performed, the simulator issues the corresponding native 64-bit system call. When the native system call returns, WoW64 converts (or thunks) any output parameters if necessary, from 64-bit to 32-bit formats, and restarts the simulation.
Exception dispatching
Similar to WoW64 system calls, exception dispatching forces the CPU simulation to exit. When an exception happens, the NT kernel determines whether it has been generated by a thread executing user-mode code. If so, the NT kernel builds an extended exception frame on the active stack and dispatches the exception by returning to the user-mode KiUserExceptionDispatcher function in the 64-bit Ntdll (for more information about exceptions, refer to the “Exception dispatching” section earlier in this chapter).
Note that a 64-bit exception frame (which includes the captured CPU context) is allocated in the 32-bit stack that was currently active when the exception was generated. Thus, it needs to be converted before being dispatched to the CPU simulator. This is exactly the role of the Wow64PrepareForException function (exported by the WoW64 core library), which allocates space on the native 64-bit stack and copies the native exception frame from the 32-bit stack in it. It then switches to the 64-bit stack and converts both the native exception and context records to their relative 32-bit counterpart, storing the result on the 32-bit stack (replacing the 64-bit exception frame). At this point, the WoW64 Core can restart the simulation from the 32-bit version of the KiUserExceptionDispatcher function, which dispatches the exception in the same way the native 32-bit Ntdll would.
32-bit user-mode APC delivery follows a similar implementation. A regular user-mode APC is delivered through the native Ntdll’s KiUserApcDispatcher. When the 64-bit kernel is about to dispatch a user-mode APC to a WoW64 process, it maps the 32-bit APC address to a higher range of 64-bit address space. The 64-bit Ntdll then invokes the Wow64ApcRoutine routine exported by the WoW64 core library, which captures the native APC and context record in user mode and maps it back in the 32-bit stack. It then prepares a 32-bit user-mode APC and context record and restarts the CPU simulation from the 32-bit version of the KiUserApcDispatcher function, which dispatches the APC the same way the native 32-bit Ntdll would.
ARM
ARM is a family of Reduced Instruction Set Computing (RISC) architectures originally designed by the ARM Holding company. The company, unlike Intel and AMD, designs the CPU’s architecture and licenses it to other companies, such as Qualcomm and Samsung, which produce the final CPUs. As a result, there have been multiple releases and versions of the ARM architecture, which have quickly evolved during the years, starting from very simple 32-bit CPUs, initially brought by the ARMv3 generation in the year 1993, up to the latest ARMv8. The, latest ARM64v8.2 CPUs natively support multiple execution modes (or states), most commonly AArch32, Thumb-2, and AArch64:
■ AArch32 is the most classical execution mode, where the CPU executes 32-bit code only and transfers data to and from the main memory through a 32-bit bus using 32-bit registers.
■ Thumb-2 is an execution state that is a subset of the AArch32 mode. The Thumb instruction set has been designed for improving code density in low-power embedded systems. In this mode, the CPU can execute a mix of 16-bit and 32-bit instructions, while still accessing 32-bit registers and memory.
■ AArch64 is the modern execution mode. The CPU in this execution state has access to 64-bit general purpose registers and can transfer data to and from the main memory through a 64-bit bus.
Windows 10 for ARM64 systems can operate in the AArch64 or Thumb-2 execution mode (AArch32 is generally not used). Thumb-2 was especially used in old Windows RT systems. The current state of an ARM64 processor is determined also by the current Exception level (EL), which defines different levels of privilege: ARM currently defines three exception levels and two security states. They are both discussed more in depth in Chapter 9 and in the ARM Architecture Reference Manual.
Memory models
In the “Hardware side-channel vulnerabilities” earlier in this chapter, we introduced the concept of a cache coherency protocol, which guarantees that the same data located in a CPU’s core cache is observed while accessed by multiple processors (MESI is one of the most famous cache coherency protocols). Like the cache coherency protocol, modern CPUs also should provide a memory consistency (or ordering) model for solving another problem that can arise in multiprocessor environments: memory reordering. Some architectures (ARM64 is an example) are indeed free to re-order memory accesses with the goal to make more efficient use of the memory subsystem and parallelize memory access instructions (achieving better performance while accessing the slower memory bus). This kind of architecture follows a weak memory model, unlike the AMD64 architecture, which follows a strong memory model, in which memory access instructions are generally executed in program order. Weak models allow the processor to be faster and access the memory in a more efficient way but bring a lot of synchronization issues when developing multiprocessor software. In contrast, a strong model is more intuitive and stable, but it has the big drawback of being slower.
CPUs that can do memory reordering (following the weak model) provide some machine instructions that act as memory barriers. A barrier prevents the processor from reordering memory accesses before and after the barrier, helping multiprocessors synchronization issues. Memory barriers are slow; thus, they are used only when strictly needed by critical multiprocessor code in Windows, especially in synchronization primitives (like spinlocks, mutexes, pushlocks, and so on).
As we describe in the next section, the ARM64 jitter always makes use of memory barriers while translating x86 code in a multiprocessor environment. Indeed, it can’t infer whether the code that will execute could be run by multiple threads in parallel at the same time (and thus have potential synchronization issues. X86 follows a strong memory model, so it does not have the reordering issue, a part of generic out-of-order execution as explained in the previous section).
![]() Note
Note
Other than the CPU, memory reordering can also affect the compiler, which, during compilation time, can reorder (and possibly remove) memory references in the source code for efficiency and speed reasons. This kind of reordering is called compiler reordering, whereas the type described in the previous section is processor reordering.
ARM32 simulation on ARM64 platforms
The simulation of ARM32 applications under ARM64 is performed in a very similar way as for x86 under AMD64. As discussed in the previous section, an ARM64v8 CPU is capable of dynamic switching between the AArch64 and Thumb-2 execution state (so it can execute 32-bit instructions directly in hardware). However, unlike AMD64 systems, the CPU can’t switch execution mode in user mode via a specific instruction, so the WoW64 layer needs to invoke the NT kernel to request the execution mode switch. To do this, the BtCpuSimulate function, exported by the ARM-on-ARM64 CPU simulator (Wowarmhw.dll), saves the nonvolatile AArch64 registers in the 64-bit stack, restores the 32-bit context stored in WoW64 CPU area, and finally emits a well-defined system call (which has an invalid syscall number, –1).
The NT kernel exception handler (which, on ARM64, is the same as the syscall handler), detects that the exception has been raised due to a system call, thus it checks the syscall number. In case the number is the special –1, the NT kernel knows that the request is due to an execution mode change coming from WoW64. In that case, it invokes the KiEnter32BitMode routine, which sets the new execution state for the lower EL (exception level) to AArch32, dismisses the exception, and returns to user mode.
The code starts the execution in AArch32 state. Like the x86 simulator for AMD64 systems, the execution controls return to the simulator only in case an exception is raised or a system call is invoked. Both exceptions and system calls are dispatched in an identical way as for the x86 simulator under AMD64.
X86 simulation on ARM64 platforms
The x86-on-ARM64 CPU simulator (Xtajit.dll) is different from other binary translators described in the previous sections, mostly because it cannot directly execute x86 instructions using the hardware. The ARM64 processor is simply not able to understand any x86 instruction. Thus, the x86-on-ARM simulator implements a full x86 emulator and a jitter, which can translate blocks of x86 opcodes in AArch64 code and execute the translated blocks directly.
When the simulator process initialization function (BtCpuProcessInit) is invoked for a new WoW64 process, it builds the jitter main registry key for the process by combining the HKLMSOFTWAREMicrosoftWow64x86xtajit path with the name of the main process image. If the key exists, the simulator queries multiple configuration information from it (most common are the multiprocessor compatibility and JIT block threshold size. Note that the simulator also queries configuration settings from the application compatibility database.) The simulator then allocates and compiles the Syscall page, which, as the name implies, is used for emitting x86 syscalls (the page is then linked to Ntdll thanks to the Wow64Transition variable). At this point, the simulator determines whether the process can use the XTA cache.
The simulator uses two different caches for storing precompiled code blocks: The internal cache is allocated per-thread and contains code blocks generated by the simulator while compiling x86 code executed by the thread (those code blocks are called jitted blocks); the external XTA cache is managed by the XtaCache service and contains all the jitted blocks generated lazily for an x86 image by the XtaCache service. The per-image XTA cache is stored in an external cache file (more details provided later in this chapter.) The process initialization routine allocates also the Compile Hybrid Executable (CHPE) bitmap, which covers the entire 4-GB address space potentially used by a 32-bit process. The bitmap uses a single bit to indicate that a page of memory contains CHPE code (CHPE is described later in this chapter.)
The simulator thread initialization routine (BtCpuThreadInit) initializes the compiler and allocates the per-thread CPU state on the native stack, an important data structure that contains the per-thread compiler state, including the x86 thread context, the x86 code emitter state, the internal code cache, and the configuration of the emulated x86 CPU (segment registers, FPU state, emulated CPUIDs.)
Simulator’s image load notification
Unlike any other binary translator, the x86-on-ARM64 CPU simulator must be informed any time a new image is mapped in the process address space, including for the CHPE Ntdll. This is achieved thanks to the WoW64 core, which intercepts when the NtMapViewOfSection native API is called from the 32-bit code and informs the Xtajit simulator through the exported BTCpuNotifyMapViewOfSection routine. It is important that the notification happen because the simulator needs to update the internal compiler data, such as
■ The CHPE bitmap (which needs to be updated by setting bits to 1 when the target image contains CHPE code pages)
■ The internal emulated CFG (Control Flow Guard) state
■ The XTA cache state for the image
In particular, whenever a new x86 or CHPE image is loaded, the simulator determines whether it should use the XTA cache for the module (through registry and application compatibility shim.) In case the check succeeded, the simulator updates the global per-process XTA cache state by requesting to the XtaCache service the updated cache for the image. In case the XtaCache service is able to identify and open an updated cache file for the image, it returns a section object to the simulator, which can be used to speed up the execution of the image. (The section contains precompiled ARM64 code blocks.)
Compiled Hybrid Portable Executables (CHPE)
Jitting an x86 process in ARM64 environments is challenging because the compiler should keep enough performance to maintain the application responsiveness. One of the major issues is tied to the memory ordering differences between the two architectures. The x86 emulator does not know how the original x86 code has been designed, so it is obliged to aggressively use memory barriers between each memory access made by the x86 image. Executing memory barriers is a slow operation. On average, about 40% of many applications’ time is spent running operating system code. This meant that not emulating OS libraries would have allowed a gain in a lot of overall applications’ performance.
These are the motivations behind the design of Compiled Hybrid Portable Executables (CHPE). A CHPE binary is a special hybrid executable that contains both x86 and ARM64-compatible code, which has been generated with full awareness of the original source code (the compiler knew exactly where to use memory barriers). The ARM64-compatible machine code is called hybrid (or CHPE) code: it is still executed in AArch64 mode but is generated following the 32-bit ABI for a better interoperability with x86 code.
CHPE binaries are created as standard x86 executables (the machine ID is still 014C as for x86); the main difference is that they include hybrid code, described by a table in the Hybrid Image metadata (stored as part of the image load configuration directory). When a CHPE binary is loaded into the WoW64 process’s address space, the simulator updates the CHPE bitmap by setting a bit to 1 for each page containing hybrid code described by the Hybrid metadata. When the jitter compiles the x86 code block and detects that the code is trying to invoke a hybrid function, it directly executes it (using the 32-bit stack), without wasting any time in any compilation.
The jitted x86 code is executed following a custom ABI, which means that there is a nonstandard convention on how the ARM64 registers are used and how parameters are passed between functions. CHPE code does not follow the same register conventions as jitted code (although hybrid code still follows a 32-bit ABI). This means that directly invoking CHPE code from the jitted blocks built by the compiler is not directly possible. To overcome this problem, CHPE binaries also include three different kinds of thunk functions, which allow the interoperability of CHPE with x86 code:
■ A pop thunk allows x86 code to invoke a hybrid function by converting incoming (or outgoing) arguments from the guest (x86) caller to the CHPE convention and by directly transferring execution to the hybrid code.
■ A push thunk allows CHPE code to invoke an x86 routine by converting incoming (or outgoing) arguments from the hybrid code to the guest (x86) convention and by calling the emulator to resume execution on the x86 code.
■ An export thunk is a compatibility thunk created for supporting applications that detour x86 functions exported from OS modules with the goal of modifying their functionality. Functions exported from CHPE modules still contain a little amount of x86 code (usually 8 bytes), which semantically does not provide any sort of functionality but allows detours to be inserted by the external application.
The x86-on-ARM simulator makes the best effort to always load CHPE system binaries instead of standard x86 ones, but this is not always possible. In case a CHPE binary does not exist, the simulator will load the standard x86 one from the SysWow64 folder. In this case, the OS module will be jitted entirely.
The XTA cache
As introduced in the previous sections, the x86-on-ARM64 simulator, other than its internal per-thread cache, uses an external global cache called XTA cache, managed by the XtaCache protected service, which implements the lazy jitter. The service is an automatic start service, which, when started, opens (or creates) the C:WindowsXtaCache folder and protects it through a proper ACL (only the XtaCache service and members of the Administrators group have access to the folder). The service starts its own ALPC server through the {BEC19D6F-D7B2-41A8-860C-8787BB964F2D} connection port. It then allocates the ALPC and lazy jit worker threads before exiting.
The ALPC worker thread is responsible in dispatching all the incoming requests to the ALPC server. In particular, when the simulator (the client), running in the context of a WoW64 process, connects to the XtaCache service, a new data structure tracking the x86 process is created and stored in an internal list, together with a 128 KB memory mapped section, which is shared between the client and XtaCache (the memory backing the section is internally called Trace buffer). The section is used by the simulator to send hints about the x86 code that has been jitted to execute the application and was not present in any cache, together with the module ID to which they belong. The information stored in the section is processed every 1 second by the XTA cache or in case the buffer becomes full. Based on the number of valid entries in the list, the XtaCache can decide to directly start the lazy jitter.
When a new image is mapped into an x86 process, the WoW64 layer informs the simulator, which sends a message to the XtaCache looking for an already-existing XTA cache file. To find the cache file, the XtaCache service should first open the executable image, map it, and calculate its hashes. Two hashes are generated based on the executable image path and its internal binary data. The hashes are important because they avoid the execution of jitted blocks compiled for an old stale version of the executable image. The XTA cache file name is then generated using the following name scheme: <module name>.<module header hash>.<module path hash>.<multi/uniproc>. <cache file version>.jc. The cache file contains all the precompiled code blocks, which can be directly executed by the simulator. Thus, in case a valid cache file exists, the XtaCache creates a file-mapped section and injects it into the client WoW64 process.
The lazy jitter is the engine of the XtaCache. When the service decides to invoke it, a new version of the cache file representing the jitted x86 module is created and initialized. The lazy jitter then starts the lazy compilation by invoking the XTA offline compiler (xtac.exe). The compiler is started in a protected low-privileged environment (AppContainer process), which runs in low-priority mode. The only job of the compiler is to compile the x86 code executed by the simulator. The new code blocks are added to the ones located in the old version of the cache file (if one exists) and stored in a new version of the cache file.
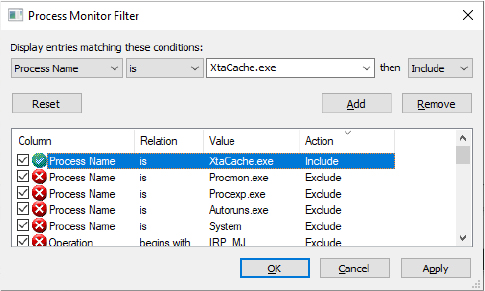
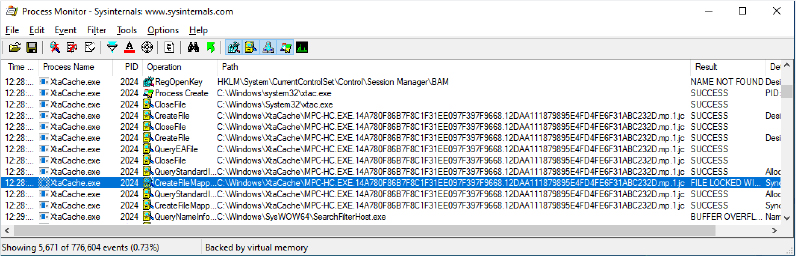
takeown /f c:windowsXtaCache
icacls c:WindowsXtaCache /grant Administrators:F
Jitting and execution
To start the guest process, the x86-on-ARM64 CPU simulator has no other chances than interpreting or jitting the x86 code. Interpreting the guest code means translating and executing one machine instruction at time, which is a slow process, so the emulator supports only the jitting strategy: it dynamically compiles x86 code to ARM64 and stores the result in a guest “code block” until certain conditions happen:
■ An illegal opcode or a data or instruction breakpoint have been detected.
■ A branch instruction targeting an already-visited block has been encountered.
■ The block is bigger than a predetermined limit (512 bytes).
The simulation engine works by first checking in the local and XTA cache whether a code block (indexed by its RVA) already exists. If the block exists in the cache, the simulator directly executes it using a dispatcher routine, which builds the ARM64 context (containing the host registers values) and stores it in the 64-bit stack, switches to the 32-bit stack, and prepares it for the guest x86 thread state. Furthermore, it also prepares the ARM64 registers to run the jitted x86 code (storing the x86 context in them). Note that a well-defined non-standard calling convention exists: the dispatcher is similar to a pop thunk used for transferring the execution from a CHPE to an x86 context.
When the execution of the code block ends, the dispatcher does the opposite: It saves the new x86 context in the 32-bit stack, switches to the 64-bit stack, and restores the old ARM64 context containing the state of the simulator. When the dispatcher exits, the simulator knows the exact x86 virtual address where the execution was interrupted. It can then restart the emulation starting from that new memory address. Similar to cached entries, the simulator checks whether the target address points to a memory page containing CHPE code (it knows this information thanks to the global CHPE bitmap). If that is the case, the simulator resolves the pop thunk for the target function, adds its address to the thread’s local cache, and directly executes it.
In case one of the two described conditions verifies, the simulator can have performances similar to executing native images. Otherwise, it needs to invoke the compiler for building the native translated code block. The compilation process is split into three phases:
The parsing stage builds instructions descriptors for each opcode that needs to be added in the code block.
The optimization stage optimizes the instruction flow.
Finally, the code generation phase writes the final ARM64 machine code in the new code block.
The generated code block is then added to the per-thread local cache. Note that the simulator cannot add it in the XTA cache, mainly for security and performance reasons. Otherwise, an attacker would be allowed to pollute the cache of a higher-privileged process (as a result, the malicious code could have potentially been executed in the context of the higher-privileged process.) Furthermore, the simulator does not have enough CPU time to generate highly optimized code (even though there is an optimization stage) while maintaining the application’s responsiveness.
However, information about the compiled x86 blocks, together with the ID of the binary hosting the x86 code, are inserted into the list mapped by the shared Trace buffer. The lazy jitter of the XTA cache knows that it needs to compile the x86 code jitted by the simulator thanks to the Trace buffer. As a result, it generates optimized code blocks and adds them in the XTA cache file for the module, which will be directly executed by the simulator. Only the first execution of the x86 process is generally slower than the others.
System calls and exception dispatching
Under the x86-on-ARM64 CPU simulator, when an x86 thread performs a system call, it invokes the code located in the syscall page allocated by the simulator, which raises the exception 0x2E. Each x86 exception forces the code block to exit. The dispatcher, while exiting from the code block, dispatches the exception through an internal function that ends up in invoking the standard WoW64 exception handler or system call dispatcher (depending on the exception vector number.) Those have been already discussed in the previous X86 simulation on AMD64 platforms section of this chapter.
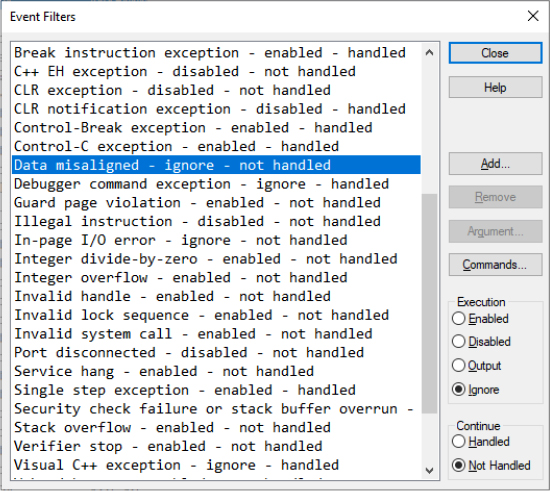
0:000> k
# Child-SP          RetAddr           Call Site
00 00000000`001eec70 00007ffb`bd47de00 ntdll!LdrpDoDebuggerBreak+0x2c
01 00000000`001eec90 00007ffb`bd47133c ntdll!LdrpInitializeProcess+0x1da8
02 00000000`001ef580 00007ffb`bd428180 ntdll!_LdrpInitialize+0x491ac
03 00000000`001ef660 00007ffb`bd428134 ntdll!LdrpInitialize+0x38
04 00000000`001ef680 00000000`00000000 ntdll!LdrInitializeThunk+0x14
00007ffb`bd47dde4 97fed31b bl ntdll!LdrpLoadWow64 (00007ffb`bd432a50)
0:000:x86> k
 #   Arch ChildEBP RetAddr
00    x86 00acf7b8 77006fb8 ntdll_76ec0000!LdrpDoDebuggerBreak+0x2b
01   CHPE 00acf7c0 77006fb8 ntdll_76ec0000!#LdrpDoDebuggerBreak$push_thunk+0x48
02   CHPE 00acf820 76f44054 ntdll_76ec0000!#LdrpInitializeProcess+0x20ec
03   CHPE 00acfad0 76f43e9c ntdll_76ec0000!#_LdrpInitialize+0x1a4
04   CHPE 00acfb60 76f43e34 ntdll_76ec0000!#LdrpInitialize+0x3c
05   CHPE 00acfb80 76ffc3cc ntdll_76ec0000!LdrInitializeThunk+0x14
0:000:x86> .effmach arm64
Effective machine: ARM 64-bit (AArch64) (arm64)
0:000> k
 # Child-SP          RetAddr           Call Site
00 00000000`00a8df30 00007ffb`bd3572a8 wow64!Wow64pNotifyDebugger+0x18f54
01 00000000`00a8df60 00007ffb`bd3724a4 wow64!Wow64pDispatchException+0x108
02 00000000`00a8e2e0 00000000`76e1e9dc wow64!Wow64RaiseException+0x84
03 00000000`00a8e400 00000000`76e0ebd8 xtajit!BTCpuSuspendLocalThread+0x24c
04 00000000`00a8e4c0 00000000`76de04c8 xtajit!BTCpuResetFloatingPoint+0x4828
05 00000000`00a8e530 00000000`76dd4bf8 xtajit!BTCpuUseChpeFile+0x9088
06 00000000`00a8e640 00007ffb`bd3552c4 xtajit!BTCpuSimulate+0x98
07 00000000`00a8e6b0 00007ffb`bd353788 wow64!RunCpuSimulation+0x14
08 00000000`00a8e6c0 00007ffb`bd47de38 wow64!Wow64LdrpInitialize+0x138
09 00000000`00a8e980 00007ffb`bd47133c ntdll!LdrpInitializeProcess+0x1de0
0a 00000000`00a8f270 00007ffb`bd428180 ntdll!_LdrpInitialize+0x491ac
0b 00000000`00a8f350 00007ffb`bd428134 ntdll!LdrpInitialize+0x38
0c 00000000`00a8f370 00000000`00000000 ntdll!LdrInitializeThunk+0x14
Object Manager
As mentioned in Chapter 2 of Part 1, “System architecture,” Windows implements an object model to provide consistent and secure access to the various internal services implemented in the executive. This section describes the Windows Object Manager, the executive component responsible for creating, deleting, protecting, and tracking objects. The Object Manager centralizes resource control operations that otherwise would be scattered throughout the operating system. It was designed to meet the goals listed after the experiment.
■ WinObj (available from Sysinternals) displays the internal Object Manager’s namespace and information about objects (such as the reference count, the number of open handles, security descriptors, and so forth). WinObjEx64, available on GitHub, is a similar tool with more advanced functionality and is open source but not endorsed or signed by Microsoft.
■ Process Explorer and Handle from Sysinternals, as well as Resource Monitor (introduced in Chapter 1 of Part 1) display the open handles for a process. Process Hacker is another tool that shows open handles and can show additional details for certain kinds of objects.
■ The kernel debugger !handle extension displays the open handles for a process, as does the Io.Handles data model object underneath a Process such as @$curprocess.
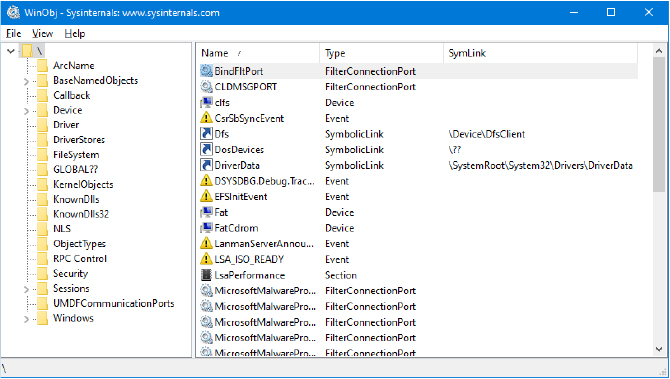
The Object Manager was designed to meet the following goals:
■ Provide a common, uniform mechanism for using system resources.
■ Isolate object protection to one location in the operating system to ensure uniform and consistent object access policy.
■ Provide a mechanism to charge processes for their use of objects so that limits can be placed on the usage of system resources.
■ Establish an object-naming scheme that can readily incorporate existing objects, such as the devices, files, and directories of a file system or other independent collections of objects.
■ Support the requirements of various operating system environments, such as the ability of a process to inherit resources from a parent process (needed by Windows and Subsystem for UNIX Applications) and the ability to create case-sensitive file names (needed by Subsystem for UNIX Applications). Although Subsystem for UNIX Applications no longer exists, these facilities were also useful for the later development of the Windows Subsystem for Linux.
■ Establish uniform rules for object retention (that is, for keeping an object available until all processes have finished using it).
■ Provide the ability to isolate objects for a specific session to allow for both local and global objects in the namespace.
■ Allow redirection of object names and paths through symbolic links and allow object owners, such as the file system, to implement their own type of redirection mechanisms (such as NTFS junction points). Combined, these redirection mechanisms compose what is called reparsing.
Internally, Windows has three primary types of objects: executive objects, kernel objects, and GDI/User objects. Executive objects are objects implemented by various components of the executive (such as the process manager, memory manager, I/O subsystem, and so on). Kernel objects are a more primitive set of objects implemented by the Windows kernel. These objects are not visible to user-mode code but are created and used only within the executive. Kernel objects provide fundamental capabilities, such as synchronization, on which executive objects are built. Thus, many executive objects contain (encapsulate) one or more kernel objects, as shown in Figure 8-30.
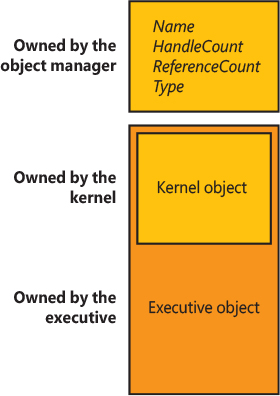
Figure 8-30 Executive objects that contain kernel objects.
![]() Note
Note
The vast majority of GDI/User objects, on the other hand, belong to the Windows subsystem (Win32k.sys) and do not interact with the kernel. For this reason, they are outside the scope of this book, but you can get more information on them from the Windows SDK. Two exceptions are the Desktop and Windows Station User objects, which are wrapped in executive objects, as well as the majority of DirectX objects (Shaders, Surfaces, Compositions), which are also wrapped as executive objects.
Details about the structure of kernel objects and how they are used to implement synchronization are given later in this chapter. The remainder of this section focuses on how the Object Manager works and on the structure of executive objects, handles, and handle tables. We just briefly describe how objects are involved in implementing Windows security access checking; Chapter 7 of Part 1 thoroughly covers that topic.
Executive objects
Each Windows environment subsystem projects to its applications a different image of the operating system. The executive objects and object services are primitives that the environment subsystems use to construct their own versions of objects and other resources.
Executive objects are typically created either by an environment subsystem on behalf of a user application or by various components of the operating system as part of their normal operation. For example, to create a file, a Windows application calls the Windows CreateFileW function, implemented in the Windows subsystem DLL Kernelbase.dll. After some validation and initialization, CreateFileW in turn calls the native Windows service NtCreateFile to create an executive file object.
The set of objects an environment subsystem supplies to its applications might be larger or smaller than the set the executive provides. The Windows subsystem uses executive objects to export its own set of objects, many of which correspond directly to executive objects. For example, the Windows mutexes and semaphores are directly based on executive objects (which, in turn, are based on corresponding kernel objects). In addition, the Windows subsystem supplies named pipes and mailslots, resources that are based on executive file objects. When leveraging Windows Subsystem for Linux (WSL), its subsystem driver (Lxcore.sys) uses executive objects and services as the basis for presenting Linux-style processes, pipes, and other resources to its applications.
Table 8-15 lists the primary objects the executive provides and briefly describes what they represent. You can find further details on executive objects in the chapters that describe the related executive components (or in the case of executive objects directly exported to Windows, in the Windows API reference documentation). You can see the full list of object types by running Winobj with elevated rights and navigating to the ObjectTypes directory.
Table 8-15 Executive objects exposed to the Windows API
Object Type |
Represents |
|---|---|
Process |
The virtual address space and control information necessary for the execution of a set of thread objects. |
Thread |
An executable entity within a process. |
Job |
A collection of processes manageable as a single entity through the job. |
Section |
A region of shared memory (known as a file-mapping object in Windows). |
File |
An instance of an opened file or an I/O device, such as a pipe or socket. |
Token |
The security profile (security ID, user rights, and so on) of a process or a thread. |
Event, KeyedEvent |
An object with a persistent state (signaled or not signaled) that can be used for synchronization or notification. The latter allows a global key to be used to reference the underlying synchronization primitive, avoiding memory usage, making it usable in low-memory conditions by avoiding an allocation. |
Semaphore |
A counter that provides a resource gate by allowing some maximum number of threads to access the resources protected by the semaphore. |
Mutex |
A synchronization mechanism used to serialize access to a resource. |
Timer, IRTimer |
A mechanism to notify a thread when a fixed period of time elapses. The latter objects, called Idle Resilient Timers, are used by UWP applications and certain services to create timers that are not affected by Connected Standby. |
IoCompletion, IoCompletionReserve |
A method for threads to enqueue and dequeue notifications of the completion of I/O operations (known as an I/O completion port in the Windows API). The latter allows preallocation of the port to combat low-memory situations. |
Key |
A mechanism to refer to data in the registry. Although keys appear in the Object Manager namespace, they are managed by the configuration manager, in a way like that in which file objects are managed by file system drivers. Zero or more key values are associated with a key object; key values contain data about the key. |
Directory |
A virtual directory in the Object Manager’s namespace responsible for containing other objects or object directories. |
SymbolicLink |
A virtual name redirection link between an object in the namespace and another object, such as C:, which is a symbolic link to DeviceHarddiskVolumeN. |
TpWorkerFactory |
A collection of threads assigned to perform a specific set of tasks. The kernel can manage the number of work items that will be performed on the queue, how many threads should be responsible for the work, and dynamic creation and termination of worker threads, respecting certain limits the caller can set. Windows exposes the worker factory object through thread pools. |
TmRm (Resource Manager), TmTx (Transaction), TmTm (Transaction Manager), TmEn (Enlistment) |
Objects used by the Kernel Transaction Manager (KTM) for various transactions and/or enlistments as part of a resource manager or transaction manager. Objects can be created through the CreateTransactionManager, CreateResourceManager, CreateTransaction, and CreateEnlistment APIs. |
RegistryTransaction |
Object used by the low-level lightweight registry transaction API that does not leverage the full KTM capabilities but still allows simple transactional access to registry keys. |
WindowStation |
An object that contains a clipboard, a set of global atoms, and a group of Desktop objects. |
Desktop |
An object contained within a window station. A desktop has a logical display surface and contains windows, menus, and hooks. |
PowerRequest |
An object associated with a thread that executes, among other things, a call to SetThreadExecutionState to request a given power change, such as blocking sleeps (due to a movie being played, for example). |
EtwConsumer |
Represents a connected ETW real-time consumer that has registered with the StartTrace API (and can call ProcessTrace to receive the events on the object queue). |
CoverageSampler |
Created by ETW when enabling code coverage tracing on a given ETW session. |
EtwRegistration |
Represents the registration object associated with a user-mode (or kernel-mode) ETW provider that registered with the EventRegister API. |
ActivationObject |
Represents the object that tracks foreground state for window handles that are managed by the Raw Input Manager in Win32k.sys. |
ActivityReference |
Tracks processes managed by the Process Lifetime Manager (PLM) and that should be kept awake during Connected Standby scenarios. |
ALPC Port |
Used mainly by the Remote Procedure Call (RPC) library to provide Local RPC (LRPC) capabilities when using the ncalrpc transport. Also available to internal services as a generic IPC mechanism between processes and/or the kernel. |
Composition, DxgkCompositionObject, DxgkCurrentDxgProcessObject, DxgkDisplayManagerObject, DxgkSharedBundleObject, DxgkSharedKeyedMutexObject, DxgkShartedProtectedSessionObject, DgxkSharedResource, DxgkSwapChainObject, DxgkSharedSyncObject |
Used by DirectX 12 APIs in user-space as part of advanced shader and GPGPU capabilities, these executive objects wrap the underlying DirectX handle(s). |
CoreMessaging |
Represents a CoreMessaging IPC object that wraps an ALPC port with its own customized namespace and capabilities; used primarily by the modern Input Manager but also exposed to any MinUser component on WCOS systems. |
EnergyTracker |
Exposed to the User Mode Power (UMPO) service to allow tracking and aggregation of energy usage across a variety of hardware and associating it on a per-application basis. |
FilterCommunicationPort, FilterConnectionPort |
Underlying objects backing the IRP-based interface exposed by the Filter Manager API, which allows communication between user-mode services and applications, and the mini-filters that are managed by Filter Manager, such as when using FilterSendMessage. |
Partition |
Enables the memory manager, cache manager, and executive to treat a region of physical memory as unique from a management perspective vis-à-vis the rest of system RAM, giving it its own instance of management threads, capabilities, paging, caching, etc. Used by Game Mode and Hyper-V, among others, to better distinguish the system from the underlying workloads. |
Profile |
Used by the profiling API that allows capturing time-based buckets of execution that track anything from the Instruction Pointer (IP) all the way to low-level processor caching information stored in the PMU counters. |
RawInputManager |
Represents the object that is bound to an HID device such as a mouse, keyboard, or tablet and allows reading and managing the window manager input that is being received by it. Used by modern UI management code such as when Core Messaging is involved. |
Session |
Object that represents the memory manager’s view of an interactive user session, as well as tracks the I/O manager’s notifications around connect/disconnect/logoff/logon for third-party driver usage. |
Terminal |
Only enabled if the terminal thermal manager (TTM) is enabled, this represents a user terminal on a device, which is managed by the user mode power manager (UMPO). |
TerminalEventQueue |
Only enabled on TTM systems, like the preceding object type, this represents events being delivered to a terminal on a device, which UMPO communicates with the kernel’s power manager about. |
UserApcReserve |
Similar to IoCompletionReserve in that it allows precreating a data structure to be reused during low-memory conditions, this object encapsulates an APC Kernel Object (KAPC) as an executive object. |
WaitCompletionPacket |
Used by the new asynchronous wait capabilities that were introduced in the user-mode Thread Pool API, this object wraps the completion of a dispatcher wait as an I/O packet that can be delivered to an I/O completion port. |
WmiGuid |
Used by the Windows Management Instrumentation (WMI) APIs when opening WMI Data Blocks by GUID, either from user mode or kernel mode, such as with IoWMIOpenBlock. |
![]() Note
Note
The executive implements a total of about 69 object types (depending on the Windows version). Some of these objects are for use only by the executive component that defines them and are not directly accessible by Windows APIs. Examples of these objects include Driver, Callback, and Adapter.
![]() Note
Note
Because Windows NT was originally supposed to support the OS/2 operating system, the mutex had to be compatible with the existing design of OS/2 mutual-exclusion objects, a design that required that a thread be able to abandon the object, leaving it inaccessible. Because this behavior was considered unusual for such an object, another kernel object—the mutant—was created. Eventually, OS/2 support was dropped, and the object became used by the Windows 32 subsystem under the name mutex (but it is still called mutant internally).
Object structure
As shown in Figure 8-31, each object has an object header, an object body, and potentially, an object footer. The Object Manager controls the object headers and footer, whereas the owning executive components control the object bodies of the object types they create. Each object header also contains an index to a special object, called the type object, that contains information common to each instance of the object. Additionally, up to eight optional subheaders exist: The name information header, the quota information header, the process information header, the handle information header, the audit information header, the padding information header, the extended information header, and the creator information header. If the extended information header is present, this means that the object has a footer, and the header will contain a pointer to it.

Figure 8-31 Structure of an object.
Object headers and bodies
The Object Manager uses the data stored in an object’s header to manage objects without regard to their type. Table 8-16 briefly describes the object header fields, and Table 8-17 describes the fields found in the optional object subheaders.
Table 8-16 Object header fields
Field |
Purpose |
|---|---|
Handle count |
Maintains a count of the number of currently opened handles to the object. |
Pointer count |
Maintains a count of the number of references to the object (including one reference for each handle), and the number of usage references for each handle (up to 32 for 32-bit systems, and 32,768 for 64-bit systems). Kernel-mode components can reference an object by pointer without using a handle. |
Security descriptor |
Determines who can use the object and what they can do with it. Note that unnamed objects, by definition, cannot have security. |
Object type index |
Contains the index to a type object that contains attributes common to objects of this type. The table that stores all the type objects is ObTypeIndexTable. Due to a security mitigation, this index is XOR’ed with a dynamically generated sentinel value stored in ObHeaderCookie and the bottom 8 bits of the address of the object header itself. |
Info mask |
Bitmask describing which of the optional subheader structures described in Table 8-17 are present, except for the creator information subheader, which, if present, always precedes the object. The bitmask is converted to a negative offset by using the ObpInfoMaskToOffset table, with each subheader being associated with a 1-byte index that places it relative to the other subheaders present. |
Flags |
Characteristics and object attributes for the object. See Table 8-20 for a list of all the object flags. |
Lock |
Per-object lock used when modifying fields belonging to this object header or any of its subheaders. |
Trace Flags |
Additional flags specifically related to tracing and debugging facilities, also described in Table 8-20. |
Object Create Info |
Ephemeral information about the creation of the object that is stored until the object is fully inserted into the namespace. This field converts into a pointer to the Quota Block after creation. |
In addition to the object header, which contains information that applies to any kind of object, the subheaders contain optional information regarding specific aspects of the object. Note that these structures are located at a variable offset from the start of the object header, the value of which depends on the number of subheaders associated with the main object header (except, as mentioned earlier, for creator information). For each subheader that is present, the InfoMask field is updated to reflect its existence. When the Object Manager checks for a given subheader, it checks whether the corresponding bit is set in the InfoMask and then uses the remaining bits to select the correct offset into the global ObpInfoMaskToOffset table, where it finds the offset of the subheader from the start of the object header.
These offsets exist for all possible combinations of subheader presence, but because the subheaders, if present, are always allocated in a fixed, constant order, a given header will have only as many possible locations as the maximum number of subheaders that precede it. For example, because the name information subheader is always allocated first, it has only one possible offset. On the other hand, the handle information subheader (which is allocated third) has three possible locations because it might or might not have been allocated after the quota subheader, itself having possibly been allocated after the name information. Table 8-17 describes all the optional object subheaders and their locations. In the case of creator information, a value in the object header flags determines whether the subheader is present. (See Table 8-20 for information about these flags.)
Table 8-17 Optional object subheaders
Name |
Purpose |
Bit |
Offset |
|---|---|---|---|
|
Creator information |
Links the object into a list for all the objects of the same type and records the process that created the object, along with a back trace. |
0 (0x1) |
ObpInfoMaskToOffset[0]) |
|
Name information |
Contains the object name, responsible for making an object visible to other processes for sharing, and a pointer to the object directory, which provides the hierarchical structure in which the object names are stored. |
1 (0x2) |
ObpInfoMaskToOffset[InfoMask & 0x3] |
|
Handle information |
Contains a database of entries (or just a single entry) for a process that has an open handle to the object (along with a per-process handle count). |
2 (0x4) |
ObpInfoMaskToOffset[InfoMask & 0x7] |
|
Quota information |
Lists the resource charges levied against a process when it opens a handle to the object. |
3 (0x8) |
ObpInfoMaskToOffset[InfoMask & 0xF] |
|
Process information |
Contains a pointer to the owning process if this is an exclusive object. More information on exclusive objects follows later in the chapter. |
4 (0x10) |
ObpInfoMaskToOffset[InfoMask & 0x1F] |
|
Audit information |
Contains a pointer to the original security descriptor that was used when first creating the object. This is used for File Objects when auditing is enabled to guarantee consistency. |
5 (0x20) |
ObpInfoMaskToOffset[InfoMask & 0x3F] |
|
Extended information |
Stores the pointer to the object footer for objects that require one, such as File and Silo Context Objects. |
6 (0x40) |
ObpInfoMaskToOffset[InfoMask & 0x7F] |
|
Padding information |
Stores nothing—empty junk space—but is used to align the object body on a cache boundary, if this was requested. |
7 (0x80) |
ObpInfoMaskToOffset[InfoMask & 0xFF] |
Each of these subheaders is optional and is present only under certain conditions, either during system boot or at object creation time. Table 8-18 describes each of these conditions.
Table 8-18 Conditions required for presence of object subheaders
Name |
Condition |
|---|---|
Creator information |
The object type must have enabled the maintain type list flag. Driver objects have this flag set if the Driver Verifier is enabled. However, enabling the maintain object type list global flag (discussed earlier) enables this for all objects, and Type objects always have the flag set. |
Name information |
The object must have been created with a name. |
Handle information |
The object type must have enabled the maintain handle count flag. File objects, ALPC objects, WindowStation objects, and Desktop objects have this flag set in their object type structure. |
Quota information |
The object must not have been created by the initial (or idle) system process. |
Process information |
The object must have been created with the exclusive object flag. (See Table 8-20 for information about object flags.) |
Audit Information |
The object must be a File Object, and auditing must be enabled for file object events. |
Extended information |
The object must need a footer, either due to handle revocation information (used by File and Key objects) or to extended user context info (used by Silo Context objects). |
Padding Information |
The object type must have enabled the cache aligned flag. Process and thread objects have this flag set. |
As indicated, if the extended information header is present, an object footer is allocated at the tail of the object body. Unlike object subheaders, the footer is a statically sized structure that is preallocated for all possible footer types. There are two such footers, described in Table 8-19.
Table 8-19 Conditions required for presence of object footer
Name |
Condition |
|---|---|
Handle Revocation Information |
The object must be created with ObCreateObjectEx, passing in AllowHandleRevocation in the OB_EXTENDED_CREATION_INFO structure. File and Key objects are created this way. |
Extended User Information |
The object must be created with ObCreateObjectEx, passing in AllowExtendedUserInfo in the OB_EXTENDED_CREATION_INFO structure. Silo Context objects are created this way. |
Finally, a number of attributes and/or flags determine the behavior of the object during creation time or during certain operations. These flags are received by the Object Manager whenever any new object is being created, in a structure called the object attributes. This structure defines the object name, the root object directory where it should be inserted, the security descriptor for the object, and the object attribute flags. Table 8-20 lists the various flags that can be associated with an object.
Table 8-20 Object flags
Attributes Flag |
Header Flag Bit |
Purpose |
|---|---|---|
OBJ_INHERIT |
Saved in the handle table entry |
Determines whether the handle to the object will be inherited by child processes and whether a process can use DuplicateHandle to make a copy. |
OBJ_PERMANENT |
PermanentObject |
Defines object retention behavior related to reference counts, described later. |
OBJ_EXCLUSIVE |
ExclusiveObject |
Specifies that the object can be used only by the process that created it. |
OBJ_CASE_INSENSITIVE |
Not stored, used at run time |
Specifies that lookups for this object in the namespace should be case insensitive. It can be overridden by the case insensitive flag in the object type. |
OBJ_OPENIF |
Not stored, used at run time |
Specifies that a create operation for this object name should result in an open, if the object exists, instead of a failure. |
OBJ_OPENLINK |
Not stored, used at run time |
Specifies that the Object Manager should open a handle to the symbolic link, not the target. |
OBJ_KERNEL_HANDLE |
KernelObject |
Specifies that the handle to this object should be a kernel handle (more on this later). |
OBJ_FORCE_ACCESS_CHECK |
Not stored, used at run time |
Specifies that even if the object is being opened from kernel mode, full access checks should be performed. |
OBJ_KERNEL_EXCLUSIVE |
KernelOnlyAccess |
Disables any user-mode process from opening a handle to the object; used to protect the DevicePhysicalMemory and Win32kSessionGlobals section objects. |
OBJ_IGNORE_IMPERSONATED_DEVICEMAP |
Not stored, used at run time |
Indicates that when a token is being impersonated, the DOS Device Map of the source user should not be used, and the current impersonating process’s DOS Device Map should be maintained for object lookup. This is a security mitigation for certain types of file-based redirection attacks. |
OBJ_DONT_REPARSE |
Not stored, used at run time |
Disables any kind of reparsing situation (symbolic links, NTFS reparse points, registry key redirection), and returns STATUS_REPARSE_POINT_ENCOUNTERED if any such situation occurs. This is a security mitigation for certain types of path redirection attacks. |
N/A |
DefaultSecurityQuota |
Specifies that the object’s security descriptor is using the default 2 KB quota. |
N/A |
SingleHandleEntry |
Specifies that the handle information subheader contains only a single entry and not a database. |
N/A |
NewObject |
Specifies that the object has been created but not yet inserted into the object namespace. |
N/A |
DeletedInline |
Specifies that the object is not being deleted through the deferred deletion worker thread but rather inline through a call to ObDereferenceObject(Ex). |
![]() Note
Note
When an object is being created through an API in the Windows subsystem (such as CreateEvent or CreateFile), the caller does not specify any object attributes—the subsystem DLL performs the work behind the scenes. For this reason, all named objects created through Win32 go in the BaseNamedObjects directory, either the global or per-session instance, because this is the root object directory that Kernelbase.dll specifies as part of the object attributes structure. More information on BaseNamedObjects and how it relates to the per-session namespace follows later in this chapter.
In addition to an object header, each object has an object body whose format and contents are unique to its object type; all objects of the same type share the same object body format. By creating an object type and supplying services for it, an executive component can control the manipulation of data in all object bodies of that type. Because the object header has a static and well-known size, the Object Manager can easily look up the object header for an object simply by subtracting the size of the header from the pointer of the object. As explained earlier, to access the subheaders, the Object Manager subtracts yet another well-known value from the pointer of the object header. For the footer, the extended information subheader is used to find the pointer to the object footer.
Because of the standardized object header, footer, and subheader structures, the Object Manager is able to provide a small set of generic services that can operate on the attributes stored in any object header and can be used on objects of any type (although some generic services don’t make sense for certain objects). These generic services, some of which the Windows subsystem makes available to Windows applications, are listed in Table 8-21.
Table 8-21 Generic object services
Service |
Purpose |
|---|---|
Close |
Closes a handle to an object, if allowed (more on this later). |
Duplicate |
Shares an object by duplicating a handle and giving it to another process (if allowed, as described later). |
Inheritance |
If a handle is marked as inheritable, and a child process is spawned with handle inheritance enabled, this behaves like duplication for those handles. |
Make permanent/temporary |
Changes the retention of an object (described later). |
Query object |
Gets information about an object’s standard attributes and other details managed at the Object Manager level. |
Query security |
Gets an object’s security descriptor. |
Set security |
Changes the protection on an object. |
Wait for a single object |
Associates a wait block with one object, which can then synchronize a thread’s execution or be associated with an I/O completion port through a wait completion packet. |
Signal an object and wait for another |
Signals the object, performing wake semantics on the dispatcher object backing it, and then waits on a single object as per above. The wake/wait operation is done atomically from the scheduler’s perspective.. |
Wait for multiple objects |
Associates a wait block with one or more objects, up to a limit (64), which can then synchronize a thread’s execution or be associated with an I/O completion port through a wait completion packet. |
Although all of these services are not generally implemented by most object types, they typically implement at least create, open, and basic management services. For example, the I/O system implements a create file service for its file objects, and the process manager implements a create process service for its process objects.
However, some objects may not directly expose such services and could be internally created as the result of some user operation. For example, when opening a WMI Data Block from user mode, a WmiGuid object is created, but no handle is exposed to the application for any kind of close or query services. The key thing to understand, however, is that there is no single generic creation routine.
Such a routine would have been quite complicated because the set of parameters required to initialize a file object, for example, differs markedly from what is required to initialize a process object. Also, the Object Manager would have incurred additional processing overhead each time a thread called an object service to determine the type of object the handle referred to and to call the appropriate version of the service.
Type objects
Object headers contain data that is common to all objects but that can take on different values for each instance of an object. For example, each object has a unique name and can have a unique security descriptor. However, objects also contain some data that remains constant for all objects of a particular type. For example, you can select from a set of access rights specific to a type of object when you open a handle to objects of that type. The executive supplies terminate and suspend access (among others) for thread objects and read, write, append, and delete access (among others) for file objects. Another example of an object-type-specific attribute is synchronization, which is described shortly.
To conserve memory, the Object Manager stores these static, object-type-specific attributes once when creating a new object type. It uses an object of its own, a type object, to record this data. As Figure 8-32 illustrates, if the object-tracking debug flag (described in the “Windows global flags” section later in this chapter) is set, a type object also links together all objects of the same type (in this case, the process type), allowing the Object Manager to find and enumerate them, if necessary. This functionality takes advantage of the creator information subheader discussed previously.

Figure 8-32 Process objects and the process type object.
Type objects can’t be manipulated from user mode because the Object Manager supplies no services for them. However, some of the attributes they define are visible through certain native services and through Windows API routines. The information stored in the type initializers is described in Table 8-22.
Table 8-22 Type initializer fields
Attribute |
Purpose |
|---|---|
Type name |
The name for objects of this type (Process, Event, ALPC Port, and so on). |
Pool type |
Indicates whether objects of this type should be allocated from paged or nonpaged memory. |
Default quota charges |
Default paged and non-paged pool values to charge to process quotas. |
Valid access mask |
The types of access a thread can request when opening a handle to an object of this type (read, write, terminate, suspend, and so on). |
Generic access rights mapping |
A mapping between the four generic access rights (read, write, execute, and all) to the type-specific access rights. |
Retain access |
Access rights that can never be removed by any third-party Object Manager callbacks (part of the callback list described earlier). |
Flags |
Indicate whether objects must never have names (such as process objects), whether their names are case-sensitive, whether they require a security descriptor, whether they should be cache aligned (requiring a padding subheader), whether they support object-filtering callbacks, and whether a handle database (handle information subheader) and/or a type-list linkage (creator information subheader) should be maintained. The use default object flag also defines the behavior for the default object field shown later in this table. Finally, the use extended parameters flag enables usage of the extended parse procedure method, described later. |
Object type code |
Used to describe the type of object this is (versus comparing with a well-known name value). File objects set this to 1, synchronization objects set this to 2, and thread objects set this to 4. This field is also used by ALPC to store handle attribute information associated with a message. |
Invalid attributes |
Specifies object attribute flags (shown earlier in Table 8-20) that are invalid for this object type. |
Default object |
Specifies the internal Object Manager event that should be used during waits for this object, if the object type creator requested one. Note that certain objects, such as File objects and ALPC port objects already contain embedded dispatcher objects; in this case, this field is a flag that indicates that the following wait object mask/offset/pointer fields should be used instead. |
Wait object flags, pointer, offset |
Allows the Object Manager to generically locate the underlying kernel dispatcher object that should be used for synchronization when one of the generic wait services shown earlier (WaitForSingleObject, etc.) is called on the object. |
Methods |
One or more routines that the Object Manager calls automatically at certain points in an object’s lifetime or in response to certain user-mode calls. |
Synchronization, one of the attributes visible to Windows applications, refers to a thread’s ability to synchronize its execution by waiting for an object to change from one state to another. A thread can synchronize with executive job, process, thread, file, event, semaphore, mutex, timer, and many other different kinds of objects. Yet, other executive objects don’t support synchronization. An object’s ability to support synchronization is based on three possibilities:
■ The executive object is a wrapper for a dispatcher object and contains a dispatcher header, a kernel structure that is covered in the section “Low-IRQL synchronization” later in this chapter.
■ The creator of the object type requested a default object, and the Object Manager provided one.
■ The executive object has an embedded dispatcher object, such as an event somewhere inside the object body, and the object’s owner supplied its offset (or pointer) to the Object Manager when registering the object type (described in Table 8-14).
Object methods
The last attribute in Table 8-22, methods, comprises a set of internal routines that are similar to C++ constructors and destructors—that is, routines that are automatically called when an object is created or destroyed. The Object Manager extends this idea by calling an object method in other situations as well, such as when someone opens or closes a handle to an object or when someone attempts to change the protection on an object. Some object types specify methods whereas others don’t, depending on how the object type is to be used.
When an executive component creates a new object type, it can register one or more methods with the Object Manager. Thereafter, the Object Manager calls the methods at well-defined points in the lifetime of objects of that type, usually when an object is created, deleted, or modified in some way. The methods that the Object Manager supports are listed in Table 8-23.
Table 8-23 Object methods
Method |
When Method Is Called |
|---|---|
Open |
When an object handle is created, opened, duplicated, or inherited |
Close |
When an object handle is closed |
Delete |
Before the Object Manager deletes an object |
Query name |
When a thread requests the name of an object |
Parse |
When the Object Manager is searching for an object name |
Dump |
Not used |
Okay to close |
When the Object Manager is instructed to close a handle |
Security |
When a process reads or changes the protection of an object, such as a file, that exists in a secondary object namespace |
One of the reasons for these object methods is to address the fact that, as you’ve seen, certain object operations are generic (close, duplicate, security, and so on). Fully generalizing these generic routines would have required the designers of the Object Manager to anticipate all object types. Not only would this add extreme complexity to the kernel, but the routines to create an object type are actually exported by the kernel! Because this enables external kernel components to create their own object types, the kernel would be unable to anticipate potential custom behaviors. Although this functionality is not documented for driver developers, it is internally used by Pcw.sys, Dxgkrnl.sys, Win32k.sys, FltMgr.sys, and others, to define WindowStation, Desktop, PcwObject, Dxgk*, FilterCommunication/ConnectionPort, NdisCmState, and other objects. Through object-method extensibility, these drivers can define routines for handling operations such as delete and query.
Another reason for these methods is simply to allow a sort of virtual constructor and destructor mechanism in terms of managing an object’s lifetime. This allows an underlying component to perform additional actions during handle creation and closure, as well as during object destruction. They even allow prohibiting handle closure and creation, when such actions are undesired—for example, the protected process mechanism described in Part 1, Chapter 3, leverages a custom handle creation method to prevent less protected processes from opening handles to more protected ones. These methods also provide visibility into internal Object Manager APIs such as duplication and inheritance, which are delivered through generic services.
Finally, because these methods also override the parse and query name functionality, they can be used to implement a secondary namespace outside of the purview of the Object Manager. In fact, this is how File and Key objects work—their namespace is internally managed by the file system driver and the configuration manager, and the Object Manager only ever sees the REGISTRY and DeviceHarddiskVolumeN object. A little later, we’ll provide details and examples for each of these methods.
The Object Manager only calls routines if their pointer is not set to NULL in the type initializer—with one exception: the security routine, which defaults to SeDefaultObjectMethod. This routine does not need to know the internal structure of the object because it deals only with the security descriptor for the object, and you’ve seen that the pointer to the security descriptor is stored in the generic object header, not inside the object body. However, if an object does require its own additional security checks, it can define a custom security routine, which again comes into play with File and Key objects that store security information in a way that’s managed by the file system or configuration manager directly.
The Object Manager calls the open method whenever it creates a handle to an object, which it does when an object is created, opened, duplicated, or inherited. For example, the WindowStation and Desktop objects provide an open method. Indeed, the WindowStation object type requires an open method so that Win32k.sys can share a piece of memory with the process that serves as a desktop-related memory pool.
An example of the use of a close method occurs in the I/O system. The I/O manager registers a close method for the file object type, and the Object Manager calls the close method each time it closes a file object handle. This close method checks whether the process that is closing the file handle owns any outstanding locks on the file and, if so, removes them. Checking for file locks isn’t something the Object Manager itself can or should do.
The Object Manager calls a delete method, if one is registered, before it deletes a temporary object from memory. The memory manager, for example, registers a delete method for the section object type that frees the physical pages being used by the section. It also verifies that any internal data structures the memory manager has allocated for a section are deleted before the section object is deleted. Once again, the Object Manager can’t do this work because it knows nothing about the internal workings of the memory manager. Delete methods for other types of objects perform similar functions.
The parse method (and similarly, the query name method) allows the Object Manager to relinquish control of finding an object to a secondary Object Manager if it finds an object that exists outside the Object Manager namespace. When the Object Manager looks up an object name, it suspends its search when it encounters an object in the path that has an associated parse method. The Object Manager calls the parse method, passing to it the remainder of the object name it is looking for. There are two namespaces in Windows in addition to the Object Manager’s: the registry namespace, which the configuration manager implements, and the file system namespace, which the I/O manager implements with the aid of file system drivers. (See Chapter 10 for more information on the configuration manager and Chapter 6 in Part 1 for more details about the I/O manager and file system drivers.)
For example, when a process opens a handle to the object named DeviceHarddiskVolume1docs esume.doc, the Object Manager traverses its name tree until it reaches the device object named HarddiskVolume1. It sees that a parse method is associated with this object, and it calls the method, passing to it the rest of the object name it was searching for—in this case, the string docs esume.doc. The parse method for device objects is an I/O routine because the I/O manager defines the device object type and registers a parse method for it. The I/O manager’s parse routine takes the name string and passes it to the appropriate file system, which finds the file on the disk and opens it.
The security method, which the I/O system also uses, is similar to the parse method. It is called whenever a thread tries to query or change the security information protecting a file. This information is different for files than for other objects because security information is stored in the file itself rather than in memory. The I/O system therefore must be called to find the security information and read or change it.
Finally, the okay-to-close method is used as an additional layer of protection around the malicious—or incorrect—closing of handles being used for system purposes. For example, each process has a handle to the Desktop object or objects on which its thread or threads have windows visible. Under the standard security model, it is possible for those threads to close their handles to their desktops because the process has full control of its own objects. In this scenario, the threads end up without a desktop associated with them—a violation of the windowing model. Win32k.sys registers an okay-to-close routine for the Desktop and WindowStation objects to prevent this behavior.
Object handles and the process handle table
When a process creates or opens an object by name, it receives a handle that represents its access to the object. Referring to an object by its handle is faster than using its name because the Object Manager can skip the name lookup and find the object directly. As briefly referenced earlier, processes can also acquire handles to objects by inheriting handles at process creation time (if the creator specifies the inherit handle flag on the CreateProcess call and the handle was marked as inheritable, either at the time it was created or afterward by using the Windows SetHandleInformation function) or by receiving a duplicated handle from another process. (See the Windows DuplicateHandle function.)
All user-mode processes must own a handle to an object before their threads can use the object. Using handles to manipulate system resources isn’t a new idea. C and C++ run-time libraries, for example, return handles to opened files. Handles serve as indirect pointers to system resources; this indirection keeps application programs from fiddling directly with system data structures.
Object handles provide additional benefits. First, except for what they refer to, there is no difference between a file handle, an event handle, and a process handle. This similarity provides a consistent interface to reference objects, regardless of their type. Second, the Object Manager has the exclusive right to create handles and to locate an object that a handle refers to. This means that the Object Manager can scrutinize every user-mode action that affects an object to see whether the security profile of the caller allows the operation requested on the object in question.
![]() Note
Note
Executive components and device drivers can access objects directly because they are running in kernel mode and therefore have access to the object structures in system memory. However, they must declare their usage of the object by incrementing the reference count so that the object won’t be deallocated while it’s still being used. (See the section “Object retention” later in this chapter for more details.) To successfully make use of this object, however, device drivers need to know the internal structure definition of the object, and this is not provided for most objects. Instead, device drivers are encouraged to use the appropriate kernel APIs to modify or read information from the object. For example, although device drivers can get a pointer to the Process object (EPROCESS), the structure is opaque, and the Ps* APIs must be used instead. For other objects, the type itself is opaque (such as most executive objects that wrap a dispatcher object—for example, events or mutexes). For these objects, drivers must use the same system calls that user-mode applications end up calling (such as ZwCreateEvent) and use handles instead of object pointers.
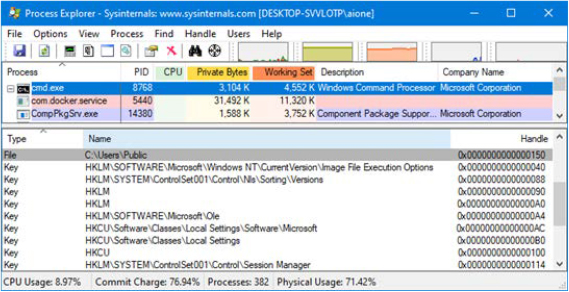
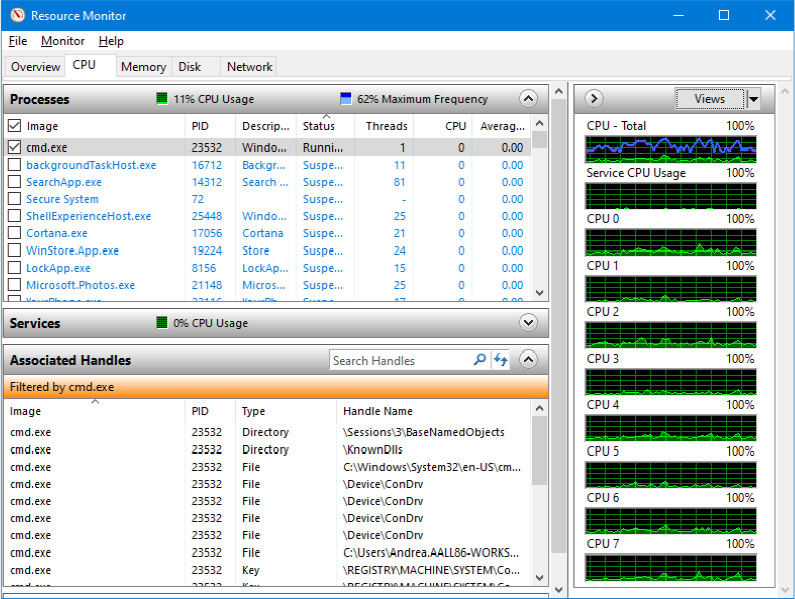
C:Usersaione>sysinthandle.exe -p 8768 -a users
Nthandle v4.22 - Handle viewer
Copyright (C) 1997-2019 Mark Russinovich
Sysinternals - www.sysinternals.com
cmd.exe            pid: 8768   type: File           150: C:UsersPublic
An object handle is an index into a process-specific handle table, pointed to by the executive process (EPROCESS) block (described in Chapter 3 of Part 1). The index is multiplied by 4 (shifted 2 bits) to make room for per-handle bits that are used by certain API behaviors—for example, inhibiting notifications on I/O completion ports or changing how process debugging works. Therefore, the first handle index is 4, the second 8, and so on. Using handle 5, 6, or 7 simply redirects to the same object as handle 4, while 9, 10, and 11 would reference the same object as handle 8.
A process’s handle table contains pointers to all the objects that the process currently has opened a handle to, and handle values are aggressively reused, such that the next new handle index will reuse an existing closed handle index if possible. Handle tables, as shown in Figure 8-33, are implemented as a three-level scheme, similar to the way that the legacy x86 memory management unit implemented virtual-to-physical address translation but with a cap of 24 bits for compatibility reasons, resulting in a maximum of 16,777,215 (224-1) handles per process. Figure 8-34 describes instead the handle table entry layout on Windows. To save on kernel memory costs, only the lowest-level handle table is allocated on process creation—the other levels are created as needed. The subhandle table consists of as many entries as will fit in a page minus one entry that is used for handle auditing. For example, for 64-bit systems, a page is 4096 bytes, divided by the size of a handle table entry (16 bytes), which is 256, minus 1, which is a total of 255 entries in the lowest-level handle table. The mid-level handle table contains a full page of pointers to subhandle tables, so the number of subhandle tables depends on the size of the page and the size of a pointer for the platform. Again using 64-bit systems as an example, this gives us 4096/8, or 512 entries. Due to the cap of 24 bits, only 32 entries are allowed in the top-level pointer table. If we multiply things together, we arrive at 32*512*255 or 16,711,680 handles.

Figure 8-33 Windows process handle table architecture.
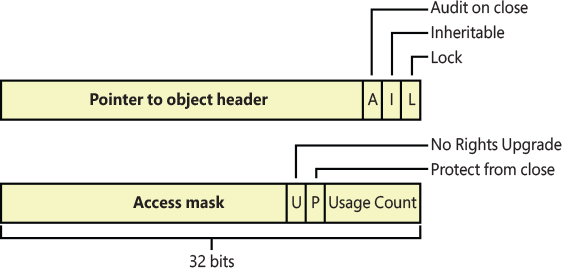
Figure 8-34 Structure of a 32-bit handle table entry.
As shown in Figure 8-34, on 32-bit systems, each handle entry consists of a structure with two 32-bit members: a pointer to the object (with three flags consuming the bottom 3 bits, due to the fact that all objects are 8-byte aligned, and these bits can be assumed to be 0), and the granted access mask (out of which only 25 bits are needed, since generic rights are never stored in the handle entry) combined with two more flags and the reference usage count, which we describe shortly.
On 64-bit systems, the same basic pieces of data are present but are encoded differently. For example, 44 bits are now needed to encode the object pointer (assuming a processor with four-level paging and 48-bits of virtual memory), since objects are 16-byte aligned, and thus the bottom four bits can now be assumed to be 0. This now allows encoding the “Protect from close” flag as part of the original three flags that were used on 32-bit systems as shown earlier, for a total of four flags. Another change is that the reference usage count is encoded in the remaining 16 bits next to the pointer, instead of next to the access mask. Finally, the “No rights upgrade” flag remains next to the access mask, but the remaining 6 bits are spare, and there are still 32-bits of alignment that are also currently spare, for a total of 16 bytes. And on LA57 systems with five levels of paging, things take yet another turn, where the pointer must now be 53 bits, reducing the usage count bits to only 7.
Since we mentioned a variety of flags, let’s see what these do. First, the first flag is a lock bit, indicating whether the entry is currently in use. Technically, it’s called “unlocked,” meaning that you should expect the bottom bit to normally be set. The second flag is the inheritance designation—that is, it indicates whether processes created by this process will get a copy of this handle in their handle tables. As already noted, handle inheritance can be specified on handle creation or later with the SetHandleInformation function. The third flag indicates whether closing the object should generate an audit message. (This flag isn’t exposed to Windows—the Object Manager uses it internally.) Next, the “Protect from close” bit indicates whether the caller is allowed to close this handle. (This flag can also be set with the SetHandleInformation function.) Finally, the “No rights upgrade” bit indicates whether access rights should be upgraded if the handle is duplicated to a process with higher privileges.
These last four flags are exposed to drivers through the OBJECT_HANDLE_INFORMATION structure that is passed in to APIs such as ObReferenceObjectByHandle, and map to OBJ_INHERIT (0x2), OBJ_AUDIT_OBJECT_CLOSE (0x4), OBJ_PROTECT_CLOSE (0x1), and OBJ_NO_RIGHTS_UPGRADE (0x8), which happen to match exactly with “holes” in the earlier OBJ_ attribute definitions that can be set when creating an object. As such, the object attributes, at runtime, end up encoding both specific behaviors of the object, as well as specific behaviors of a given handle to said object.
Finally, we mentioned the existence of a reference usage count in both the encoding of the pointer count field of the object’s header, as well as in the handle table entry. This handy feature encodes a cached number (based on the number of available bits) of preexisting references as part of each handle entry and then adds up the usage counts of all processes that have a handle to the object into the pointer count of the object’s header. As such, the pointer count is the number of handles, kernel references through ObReferenceObject, and the number of cached references for each handle.
Each time a process finishes to use an object, by dereferencing one of its handles—basically by calling any Windows API that takes a handle as input and ends up converting it into an object—the cached number of references is dropped, which is to say that the usage count decreases by 1, until it reaches 0, at which point it is no longer tracked. This allows one to infer exactly the number of times a given object has been utilized/accessed/managed through a specific process’s handle.
The debugger command !trueref, when executed with the -v flag, uses this feature as a way to show each handle referencing an object and exactly how many times it was used (if you count the number of consumed/dropped usage counts). In one of the next experiments, you’ll use this command to gain additional insight into an object’s usage.
System components and device drivers often need to open handles to objects that user-mode applications shouldn’t have access to or that simply shouldn’t be tied to a specific process to begin with. This is done by creating handles in the kernel handle table (referenced internally with the name ObpKernelHandleTable), which is associated with the System process. The handles in this table are accessible only from kernel mode and in any process context. This means that a kernel-mode function can reference the handle in any process context with no performance impact.
The Object Manager recognizes references to handles from the kernel handle table when the high bit of the handle is set—that is, when references to kernel-handle-table handles have values greater than 0x80000000 on 32-bit systems, or 0xFFFFFFFF80000000 on 64-bit systems (since handles are defined as pointers from a data type perspective, the compiler forces sign-extension).
The kernel handle table also serves as the handle table for the System and minimal processes, and as such, all handles created by the System process (such as code running in system threads) are implicitly kernel handles because the ObpKernelHandleTable symbol is set the as ObjectTable of the EPROCESS structure for these processes. Theoretically, this means that a sufficiently privileged user-mode process could use the DuplicateHandle API to extract a kernel handle out into user mode, but this attack has been mitigated since Windows Vista with the introduction of protected processes, which were described in Part 1.
Furthermore, as a security mitigation, any handle created by a kernel driver, with the previous mode set to KernelMode, is automatically turned into a kernel handle in recent versions of Windows to prevent handles from inadvertently leaking to user space applications.
Reserve Objects
Because objects represent anything from events to files to interprocess messages, the ability for applications and kernel code to create objects is essential to the normal and desired runtime behavior of any piece of Windows code. If an object allocation fails, this usually causes anything from loss of functionality (the process cannot open a file) to data loss or crashes (the process cannot allocate a synchronization object). Worse, in certain situations, the reporting of errors that led to object creation failure might themselves require new objects to be allocated. Windows implements two special reserve objects to deal with such situations: the User APC reserve object and the I/O Completion packet reserve object. Note that the reserve-object mechanism is fully extensible, and future versions of Windows might add other reserve object types—from a broad view, the reserve object is a mechanism enabling any kernel-mode data structure to be wrapped as an object (with an associated handle, name, and security) for later use.
As was discussed earlier in this chapter, APCs are used for operations such as suspension, termination, and I/O completion, as well as communication between user-mode applications that want to provide asynchronous callbacks. When a user-mode application requests a User APC to be targeted to another thread, it uses the QueueUserApc API in Kernelbase.dll, which calls the NtQueueApcThread system call. In the kernel, this system call attempts to allocate a piece of paged pool in which to store the KAPC control object structure associated with an APC. In low-memory situations, this operation fails, preventing the delivery of the APC, which, depending on what the APC was used for, could cause loss of data or functionality.
To prevent this, the user-mode application, can, on startup, use the NtAllocateReserveObject system call to request the kernel to preallocate the KAPC structure. Then the application uses a different system call, NtQueueApcThreadEx, that contains an extra parameter that is used to store the handle to the reserve object. Instead of allocating a new structure, the kernel attempts to acquire the reserve object (by setting its InUse bit to true) and uses it until the KAPC object is not needed anymore, at which point the reserve object is released back to the system. Currently, to prevent mismanagement of system resources by third-party developers, the reserve object API is available only internally through system calls for operating system components. For example, the RPC library uses reserved APC objects to guarantee that asynchronous callbacks will still be able to return in low-memory situations.
A similar scenario can occur when applications need failure-free delivery of an I/O completion port message or packet. Typically, packets are sent with the PostQueuedCompletionStatus API in Kernelbase.dll, which calls the NtSetIoCompletion API. Like the user APC, the kernel must allocate an I/O manager structure to contain the completion-packet information, and if this allocation fails, the packet cannot be created. With reserve objects, the application can use the NtAllocateReserveObject API on startup to have the kernel preallocate the I/O completion packet, and the NtSetIoCompletionEx system call can be used to supply a handle to this reserve object, guaranteeing a successful path. Just like User APC reserve objects, this functionality is reserved for system components and is used both by the RPC library and the Windows Peer-To-Peer BranchCache service to guarantee completion of asynchronous I/O operations.
Object security
When you open a file, you must specify whether you intend to read or to write. If you try to write to a file that is open for read access, you get an error. Likewise, in the executive, when a process creates an object or opens a handle to an existing object, the process must specify a set of desired access rights—that is, what it wants to do with the object. It can request either a set of standard access rights (such as read, write, and execute) that apply to all object types or specific access rights that vary depending on the object type. For example, the process can request delete access or append access to a file object. Similarly, it might require the ability to suspend or terminate a thread object.
When a process opens a handle to an object, the Object Manager calls the security reference monitor, the kernel-mode portion of the security system, sending it the process’s set of desired access rights. The security reference monitor checks whether the object’s security descriptor permits the type of access the process is requesting. If it does, the reference monitor returns a set of granted access rights that the process is allowed, and the Object Manager stores them in the object handle it creates. How the security system determines who gets access to which objects is explored in Chapter 7 of Part 1.
Thereafter, whenever the process’s threads use the handle through a service call, the Object Manager can quickly check whether the set of granted access rights stored in the handle corresponds to the usage implied by the object service the threads have called. For example, if the caller asked for read access to a section object but then calls a service to write to it, the service fails.
■ You can use WinObj or WinObjEx64 to navigate to any object on the system, including object directories, right-click the object, and select Properties. For example, select the BaseNamedObjects directory, select Properties, and click the Security tab. You should see a dialog box like the one shown next. Because WinObjEx64 supports a wider variety of object types, you’ll be able to use this dialog on a larger set of system resources.

■ Instead of using WinObj or WinObjEx64, you can view the handle table of a process using Process Explorer, as shown in the experiment “Viewing open handles” earlier in this chapter, or using Process Hacker, which has a similar view. Look at the handle table for the Explorer.exe process. You should notice a Directory object handle to the Sessions BaseNamedObjects directory (where n is an arbitrary session number defined at boot time. We describe the per-session namespace shortly.) You can double-click the object handle and then click the Security tab and see a similar dialog box (with more users and rights granted).
■ Finally, you can use AccessChk to query the security information of any object by using the –o switch as shown in the following output. Note that using AccessChk will also show you the integrity level of the object. (See Chapter 7 of Part 1, for more information on integrity levels and the security reference monitor.)
C:sysint>accesschk -o Sessions1BaseNamedObjects

Accesschk v6.13 - Reports effective permissions for securable objects
Copyright (C) 2006-2020 Mark Russinovich
Sysinternals - www.sysinternals.com

Sessions1BaseNamedObjects
  Type: Directory
  RW Window ManagerDWM-1
  RW NT AUTHORITYSYSTEM
  RW DESKTOP-SVVLOTPaione
  RW DESKTOP-SVVLOTPaione-S-1-5-5-0-841005
  RW BUILTINAdministrators
  R  Everyone
     NT AUTHORITYRESTRICTED
Windows also supports Ex (Extended) versions of the APIs—CreateEventEx, CreateMutexEx, CreateSemaphoreEx—that add another argument for specifying the access mask. This makes it possible for applications to use discretionary access control lists (DACLs) to properly secure their objects without breaking their ability to use the create object APIs to open a handle to them. You might be wondering why a client application would not simply use OpenEvent, which does support a desired access argument. Using the open object APIs leads to an inherent race condition when dealing with a failure in the open call—that is, when the client application has attempted to open the event before it has been created. In most applications of this kind, the open API is followed by a create API in the failure case. Unfortunately, there is no guaranteed way to make this create operation atomic—in other words, to occur only once.
Indeed, it would be possible for multiple threads and/or processes to have executed the create API concurrently, and all attempt to create the event at the same time. This race condition and the extra complexity required to try to handle it makes using the open object APIs an inappropriate solution to the problem, which is why the Ex APIs should be used instead.
Object retention
There are two types of objects: temporary and permanent. Most objects are temporary—that is, they remain while they are in use and are freed when they are no longer needed. Permanent objects remain until they are explicitly freed. Because most objects are temporary, the rest of this section describes how the Object Manager implements object retention—that is, retaining temporary objects only as long as they are in use and then deleting them.
Because all user-mode processes that access an object must first open a handle to it, the Object Manager can easily track how many of these processes, and which ones, are using an object. Tracking these handles represents one part of implementing retention. The Object Manager implements object retention in two phases. The first phase is called name retention, and it is controlled by the number of open handles to an object that exists. Every time a process opens a handle to an object, the Object Manager increments the open handle counter in the object’s header. As processes finish using the object and close their handles to it, the Object Manager decrements the open handle counter. When the counter drops to 0, the Object Manager deletes the object’s name from its global namespace. This deletion prevents processes from opening a handle to the object.
The second phase of object retention is to stop retaining the objects themselves (that is, to delete them) when they are no longer in use. Because operating system code usually accesses objects by using pointers instead of handles, the Object Manager must also record how many object pointers it has dispensed to operating system processes. As we saw, it increments a reference count for an object each time it gives out a pointer to the object, which is called the pointer count; when kernel-mode components finish using the pointer, they call the Object Manager to decrement the object’s reference count. The system also increments the reference count when it increments the handle count, and likewise decrements the reference count when the handle count decrements because a handle is also a reference to the object that must be tracked.
Finally, we also described usage reference count, which adds cached references to the pointer count and is decremented each time a process uses a handle. The usage reference count has been added since Windows 8 for performance reasons. When the kernel is asked to obtain the object pointer from its handle, it can do the resolution without acquiring the global handle table lock. This means that in newer versions of Windows, the handle table entry described in the “Object handles and the process handle table” section earlier in this chapter contains a usage reference counter, which is initialized the first time an application or a kernel driver uses the handle to the object. Note that in this context, the verb use refers to the act of resolving the object pointer from its handle, an operation performed in kernel by APIs like the ObReferenceObjectByHandle.
Let’s explain the three counts through an example, like the one shown in Figure 8-35. The image represents two event objects that are in use in a 64-bit system. Process A creates the first event, obtaining a handle to it. The event has a name, which implies that the Object Manager inserts it in the correct directory object (BaseNamedObjects, for example), assigning an initial reference count to 2 and the handle count to 1. After initialization is complete, Process A waits on the first event, an operation that allows the kernel to use (or reference) the handle to it, which assigns the handle’s usage reference count to 32,767 (0x7FFF in hexadecimal, which sets 15 bits to 1). This value is added to the first event object’s reference count, which is also increased by one, bringing the final value to 32,770 (while the handle count is still 1.)

Figure 8-35 Handles and reference counts.
Process B initializes, creates the second named event, and signals it. The last operation uses (references) the second event, allowing it also to reach a reference value of 32,770. Process B then opens the first event (allocated by process A). The operation lets the kernel create a new handle (valid only in the Process B address space), which adds both a handle count and reference count to the first event object, bringing its counters to 2 and 32,771. (Remember, the new handle table entry still has its usage reference count uninitialized.) Process B, before signaling the first event, uses its handle three times: the first operation initializes the handle’s usage reference count to 32,767. The value is added to the object reference count, which is further increased by 1 unit, and reaches the overall value of 65,539. Subsequent operations on the handle simply decreases the usage reference count without touching the object’s reference count. When the kernel finishes using an object, it always dereferences its pointer, though—an operation that releases a reference count on the kernel object. Thus, after the four uses (including the signaling operation), the first object reaches a handle count of 2 and reference count of 65,535. In addition, the first event is being referenced by some kernel-mode structure, which brings its final reference count to 65,536.
When a process closes a handle to an object (an operation that causes the NtClose routine to be executed in the kernel), the Object Manager knows that it needs to subtract the handle usage reference counter from the object’s reference counter. This allows the correct dereference of the handle. In the example, even if Processes A and B both close their handles to the first object, the object would continue to exist because its reference count will become 1 (while its handle count would be 0). However, when Process B closes its handle to the second event object, the object would be deallocated, because its reference count reaches 0.
This behavior means that even after an object’s open handle counter reaches 0, the object’s reference count might remain positive, indicating that the operating system is still using the object in some way. Ultimately, it is only when the reference count drops to 0 that the Object Manager deletes the object from memory. This deletion has to respect certain rules and also requires cooperation from the caller in certain cases. For example, because objects can be present both in paged or nonpaged pool memory (depending on the settings located in their object types), if a dereference occurs at an IRQL level of DISPATCH_LEVEL or higher and this dereference causes the pointer count to drop to 0, the system would crash if it attempted to immediately free the memory of a paged-pool object. (Recall that such access is illegal because the page fault will never be serviced.) In this scenario, the Object Manager performs a deferred delete operation, queuing the operation on a worker thread running at passive level (IRQL 0). We’ll describe more about system worker threads later in this chapter.
Another scenario that requires deferred deletion is when dealing with Kernel Transaction Manager (KTM) objects. In some scenarios, certain drivers might hold a lock related to this object, and attempting to delete the object will result in the system attempting to acquire this lock. However, the driver might never get the chance to release its lock, causing a deadlock. When dealing with KTM objects, driver developers must use ObDereferenceObjectDeferDelete to force deferred deletion regardless of IRQL level. Finally, the I/O manager also uses this mechanism as an optimization so that certain I/Os can complete more quickly, instead of waiting for the Object Manager to delete the object.
Because of the way object retention works, an application can ensure that an object and its name remain in memory simply by keeping a handle open to the object. Programmers who write applications that contain two or more cooperating processes need not be concerned that one process might delete an object before the other process has finished using it. In addition, closing an application’s object handles won’t cause an object to be deleted if the operating system is still using it. For example, one process might create a second process to execute a program in the background; it then immediately closes its handle to the process. Because the operating system needs the second process to run the program, it maintains a reference to its process object. Only when the background program finishes executing does the Object Manager decrement the second process’s reference count and then delete it.
Because object leaks can be dangerous to the system by leaking kernel pool memory and eventually causing systemwide memory starvation—and can break applications in subtle ways—Windows includes a number of debugging mechanisms that can be enabled to monitor, analyze, and debug issues with handles and objects. Additionally, WinDbg comes with two extensions that tap into these mechanisms and provide easy graphical analysis. Table 8-24 describes them.
Table 8-24 Debugging mechanisms for object handles
Mechanism |
Enabled By |
Kernel Debugger Extension |
|---|---|---|
Handle Tracing Database |
Kernel Stack Trace systemwide and/or per-process with the User Stack Trace option checked with Gflags.exe |
!htrace <handle value> <process ID> |
Object Reference Tracing |
Per-process-name(s), or per-object-type-pool-tag(s), with Gflags.exe, under Object Reference Tracing |
!obtrace <object pointer> |
Object Reference Tagging |
Drivers must call appropriate API |
N/A |
Enabling the handle-tracing database is useful when attempting to understand the use of each handle within an application or the system context. The !htrace debugger extension can display the stack trace captured at the time a specified handle was opened. After you discover a handle leak, the stack trace can pinpoint the code that is creating the handle, and it can be analyzed for a missing call to a function such as CloseHandle.
The object-reference-tracing !obtrace extension monitors even more by showing the stack trace for each new handle created as well as each time a handle is referenced by the kernel (and each time it is opened, duplicated, or inherited) and dereferenced. By analyzing these patterns, misuse of an object at the system level can be more easily debugged. Additionally, these reference traces provide a way to understand the behavior of the system when dealing with certain objects. Tracing processes, for example, display references from all the drivers on the system that have registered callback notifications (such as Process Monitor) and help detect rogue or buggy third-party drivers that might be referencing handles in kernel mode but never dereferencing them.
![]() Note
Note
When enabling object-reference tracing for a specific object type, you can obtain the name of its pool tag by looking at the key member of the OBJECT_TYPE structure when using the dx command. Each object type on the system has a global variable that references this structure—for example, PsProcessType. Alternatively, you can use the !object command, which displays the pointer to this structure.
Unlike the previous two mechanisms, object-reference tagging is not a debugging feature that must be enabled with global flags or the debugger but rather a set of APIs that should be used by device-driver developers to reference and dereference objects, including ObReferenceObjectWithTag and ObDereferenceObjectWithTag. Similar to pool tagging (see Chapter 5 in Part 1 for more information on pool tagging), these APIs allow developers to supply a four-character tag identifying each reference/dereference pair. When using the !obtrace extension just described, the tag for each reference or dereference operation is also shown, which avoids solely using the call stack as a mechanism to identify where leaks or under-references might occur, especially if a given call is performed thousands of times by the driver.
Resource accounting
Resource accounting, like object retention, is closely related to the use of object handles. A positive open handle count indicates that some process is using that resource. It also indicates that some process is being charged for the memory the object occupies. When an object’s handle count and reference count drop to 0, the process that was using the object should no longer be charged for it.
Many operating systems use a quota system to limit processes’ access to system resources. However, the types of quotas imposed on processes are sometimes diverse and complicated, and the code to track the quotas is spread throughout the operating system. For example, in some operating systems, an I/O component might record and limit the number of files a process can open, whereas a memory component might impose a limit on the amount of memory that a process’s threads can allocate. A process component might limit users to some maximum number of new processes they can create or a maximum number of threads within a process. Each of these limits is tracked and enforced in different parts of the operating system.
In contrast, the Windows Object Manager provides a central facility for resource accounting. Each object header contains an attribute called quota charges that records how much the Object Manager subtracts from a process’s allotted paged and/or nonpaged pool quota when a thread in the process opens a handle to the object.
Each process on Windows points to a quota structure that records the limits and current values for nonpaged-pool, paged-pool, and page-file usage. These quotas default to 0 (no limit) but can be specified by modifying registry values. (You need to add/edit NonPagedPoolQuota, PagedPoolQuota, and PagingFileQuota under HKLMSYSTEMCurrentControlSetControlSession ManagerMemory Management.) Note that all the processes in an interactive session share the same quota block (and there’s no documented way to create processes with their own quota blocks).
Object names
An important consideration in creating a multitude of objects is the need to devise a successful system for keeping track of them. The Object Manager requires the following information to help you do so:
■ A way to distinguish one object from another
■ A method for finding and retrieving a particular object
The first requirement is served by allowing names to be assigned to objects. This is an extension of what most operating systems provide—the ability to name selected resources, files, pipes, or a block of shared memory, for example. The executive, in contrast, allows any resource represented by an object to have a name. The second requirement, finding and retrieving an object, is also satisfied by object names. If the Object Manager stores objects by name, it can find an object by looking up its name.
Object names also satisfy a third requirement, which is to allow processes to share objects. The executive’s object namespace is a global one, visible to all processes in the system. One process can create an object and place its name in the global namespace, and a second process can open a handle to the object by specifying the object’s name. If an object isn’t meant to be shared in this way, its creator doesn’t need to give it a name.
To increase efficiency, the Object Manager doesn’t look up an object’s name each time someone uses the object. Instead, it looks up a name under only two circumstances. The first is when a process creates a named object: the Object Manager looks up the name to verify that it doesn’t already exist before storing the new name in the global namespace. The second is when a process opens a handle to a named object: The Object Manager looks up the name, finds the object, and then returns an object handle to the caller; thereafter, the caller uses the handle to refer to the object. When looking up a name, the Object Manager allows the caller to select either a case-sensitive or case-insensitive search, a feature that supports Windows Subsystem for Linux (WSL) and other environments that use case-sensitive file names.
Object directories
The object directory object is the Object Manager’s means for supporting this hierarchical naming structure. This object is analogous to a file system directory and contains the names of other objects, possibly even other object directories. The object directory object maintains enough information to translate these object names into pointers to the object headers of the objects themselves. The Object Manager uses the pointers to construct the object handles that it returns to user-mode callers. Both kernel-mode code (including executive components and device drivers) and user-mode code (such as subsystems) can create object directories in which to store objects.
Objects can be stored anywhere in the namespace, but certain object types will always appear in certain directories due to the fact they are created by a specialized component in a specific way. For example, the I/O manager creates an object directory named Driver, which contains the names of objects representing loaded non-file-system kernel-mode drivers. Because the I/O manager is the only component responsible for the creation of Driver objects (through the IoCreateDriver API), only Driver objects should exist there.
Table 8-25 lists the standard object directories found on all Windows systems and what types of objects you can expect to see stored there. Of the directories listed, only AppContainerNamedObjects, BaseNamedObjects, and Global?? are generically available for use by standard Win32 or UWP applications that stick to documented APIs. (See the “Session namespace” section later in this chapter for more information.)
Table 8-25 Standard object directories
Directory |
Types of Object Names Stored |
|---|---|
AppContainerNamedObjects |
Only present under the Sessions object directory for non-Session 0 interactive sessions; contains the named kernel objects created by Win32 or UWP APIs from within processes that are running in an App Container. |
ArcName |
Symbolic links mapping ARC-style paths to NT-style paths. |
BaseNamedObjects |
Global mutexes, events, semaphores, waitable timers, jobs, ALPC ports, symbolic links, and section objects. |
Callback |
Callback objects (which only drivers can create). |
Device |
Device objects owned by most drivers except file system and filter manager devices, plus the VolumesSafeForWriteAccess event, and certain symbolic links such as SystemPartition and BootPartition. Also contains the PhysicalMemory section object that allows direct access to RAM by kernel components. Finally, contains certain object directories, such as Http used by the Http.sys accelerator driver, and HarddiskN directories for each physical hard drive. |
Driver |
Driver objects whose type is not “File System Driver” or “File System Recognizer” (SERVICE_FILE_SYSTEM_DRIVER or SERVICE_RECOGNIZER_DRIVER). |
DriverStore(s) |
Symbolic links for locations where OS drivers can be installed and managed from. Typically, at least SYSTEM which points to SystemRoot, but can contain more entries on Windows 10X devices. |
FileSystem |
File-system driver objects (SERVICE_FILE_SYSTEM_DRIVER) and file-system recognizer (SERVICE_RECOGNIZER_DRIVER) driver and device objects. The Filter Manager also creates its own device objects under the Filters object directory. |
GLOBAL?? |
Symbolic link objects that represent MS-DOS device names. (The Sessions�DosDevices<LUID>Global directories are symbolic links to this directory.) |
KernelObjects |
Contains event objects that signal kernel pool resource conditions, the completion of certain operating system tasks, as well as Session objects (at least Session0) representing each interactive session, and Partition objects (at least MemoryPartition0) for each memory partition. Also contains the mutex used to synchronize access to the Boot Configuration Database (BC). Finally, contains dynamic symbolic links that use a custom callback to refer to the correct partition for physical memory and commit resource conditions, and for memory error detection. |
KnownDlls |
Section objects for the known DLLs mapped by SMSS at startup time, and a symbolic link containing the path for known DLLs. |
KnownDlls32 |
On a 64-bit Windows installation, KnownDlls contains the native 64-bit binaries, so this directory is used instead to store WoW64 32-bit versions of those DLLs. |
NLS |
Section objects for mapped national language support (NLS) tables. |
ObjectTypes |
Object type objects for each object type created by ObCreateObjectTypeEx. |
RPC Control |
ALPC ports created to represent remote procedure call (RPC) endpoints when Local RPC (ncalrpc) is used. This includes explicitly named endpoints, as well as auto-generated COM (OLEXXXXX) port names and unnamed ports (LRPC-XXXX, where XXXX is a randomly generated hexadecimal value). |
Security |
ALPC ports and events used by objects specific to the security subsystem. |
Sessions |
Per-session namespace directory. (See the next subsection.) |
Silo |
If at least one Windows Server Container has been created, such as by using Docker for Windows with non-VM containers, contains object directories for each Silo ID (the Job ID of the root job for the container), which then contain the object namespace local to that Silo. |
UMDFCommunicationPorts |
ALPC ports used by the User-Mode Driver Framework (UMDF). |
VmSharedMemory |
Section objects used by virtualized instances (VAIL) of Win32k.sys and other window manager components on Windows 10X devices when launching legacy Win32 applications. Also contains the Host object directory to represent the other side of the connection. |
Windows |
Windows subsystem ALPC ports, shared section, and window stations in the WindowStations object directory. Desktop Window Manager (DWM) also stores its ALPC ports, events, and shared sections in this directory, for non-Session 0 sessions. Finally, stores the Themes service section object. |
Object names are global to a single computer (or to all processors on a multiprocessor computer), but they’re not visible across a network. However, the Object Manager’s parse method makes it possible to access named objects that exist on other computers. For example, the I/O manager, which supplies file-object services, extends the functions of the Object Manager to remote files. When asked to open a remote file object, the Object Manager calls a parse method, which allows the I/O manager to intercept the request and deliver it to a network redirector, a driver that accesses files across the network. Server code on the remote Windows system calls the Object Manager and the I/O manager on that system to find the file object and return the information back across the network.
Because the kernel objects created by non-app-container processes, through the Win32 and UWP API, such as mutexes, events, semaphores, waitable timers, and sections, have their names stored in a single object directory, no two of these objects can have the same name, even if they are of a different type. This restriction emphasizes the need to choose names carefully so that they don’t collide with other names. For example, you could prefix names with a GUID and/or combine the name with the user’s security identifier (SID)—but even that would only help with a single instance of an application per user.
The issue with name collision may seem innocuous, but one security consideration to keep in mind when dealing with named objects is the possibility of malicious object name squatting. Although object names in different sessions are protected from each other, there’s no standard protection inside the current session namespace that can be set with the standard Windows API. This makes it possible for an unprivileged application running in the same session as a privileged application to access its objects, as described earlier in the object security subsection. Unfortunately, even if the object creator used a proper DACL to secure the object, this doesn’t help against the squatting attack, in which the unprivileged application creates the object before the privileged application, thus denying access to the legitimate application.
Windows exposes the concept of a private namespace to alleviate this issue. It allows user-mode applications to create object directories through the CreatePrivateNamespace API and associate these directories with boundary descriptors created by the CreateBoundaryDescriptor API, which are special data structures protecting the directories. These descriptors contain SIDs describing which security principals are allowed access to the object directory. In this manner, a privileged application can be sure that unprivileged applications will not be able to conduct a denial-of-service attack against its objects. (This doesn’t stop a privileged application from doing the same, however, but this point is moot.) Additionally, a boundary descriptor can also contain an integrity level, protecting objects possibly belonging to the same user account as the application based on the integrity level of the process. (See Chapter 7 of Part 1 for more information on integrity levels.)
One of the things that makes boundary descriptors effective mitigations against squatting attacks is that unlike objects, the creator of a boundary descriptor must have access (through the SID and integrity level) to the boundary descriptor. Therefore, an unprivileged application can only create an unprivileged boundary descriptor. Similarly, when an application wants to open an object in a private namespace, it must open the namespace using the same boundary descriptor that was used to create it. Therefore, a privileged application or service would provide a privileged boundary descriptor, which would not match the one created by the unprivileged application.
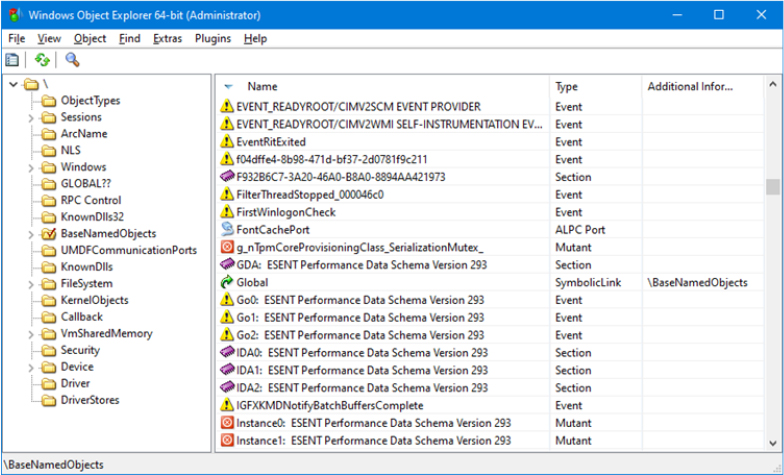
■ Mutexes are indicated with a stop sign.
■ Sections (Windows file-mapping objects) are shown as memory chips.
■ Events are shown as exclamation points.
■ Semaphores are indicated with an icon that resembles a traffic signal.
■ Symbolic links have icons that are curved arrows.
■ Folders indicate object directories.
■ Power/network plugs represent ALPC ports.
■ Timers are shown as Clocks.
■ Other icons such as various types of gears, locks, and chips are used for other object types.

Launch Windows Media Player and Process Explorer to view the handle table (by clicking View, Lower Pane View, and then Handles). You should see a handle whose name contains Microsoft_WMP_70_CheckForOtherInstanceMutex, as shown in the figure.

Right-click the handle and select Close Handle. Confirm the action when asked. Note that Process Explorer should be started as Administrator to be able to close a handle in another process.
Run Windows Media Player again. Notice that this time a second process is created.
Go ahead and play a different song in each instance. You can also use the Sound Mixer in the system tray (click the Volume icon) to select which of the two processes will have greater volume, effectively creating a mixing environment.
Symbolic links
In certain file systems (on NTFS, Linux, and macOS systems, for example), a symbolic link lets a user create a file name or a directory name that, when used, is translated by the operating system into a different file or directory name. Using a symbolic link is a simple method for allowing users to indirectly share a file or the contents of a directory, creating a cross-link between different directories in the ordinarily hierarchical directory structure.
The Object Manager implements an object called a symbolic link object, which performs a similar function for object names in its object namespace. A symbolic link can occur anywhere within an object name string. When a caller refers to a symbolic link object’s name, the Object Manager traverses its object namespace until it reaches the symbolic link object. It looks inside the symbolic link and finds a string that it substitutes for the symbolic link name. It then restarts its name lookup.
One place in which the executive uses symbolic link objects is in translating MS-DOS-style device names into Windows internal device names. In Windows, a user refers to hard disk drives using the names C:, D:, and so on, and serial ports as COM1, COM2, and so on. The Windows subsystem creates these symbolic link objects and places them in the Object Manager namespace under the Global?? directory, which can also be done for additional drive letters through the DefineDosDevice API.
In some cases, the underlying target of the symbolic link is not static and may depend on the caller’s context. For example, older versions of Windows had an event in the KernelObjects directory called LowMemoryCondition, but due to the introduction of memory partitions (described in Chapter 5 of Part 1), the condition that the event signals are now dependent on which partition the caller is running in (and should have visibility of). As such, there is now a LowMemoryCondition event for each memory partition, and callers must be redirected to the correct event for their partition. This is achieved with a special flag on the object, the lack of a target string, and the existence of a symbolic link callback executed each time the link is parsed by the Object Manager. With WinObjEx64, you can see the registered callback, as shown in the screenshot in Figure 8-36 (you could also use the debugger by doing a !object KernelObjectsLowMemoryCondition command and then dumping the _OBJECT_SYMBOLIC_LINK structure with the dx command.)
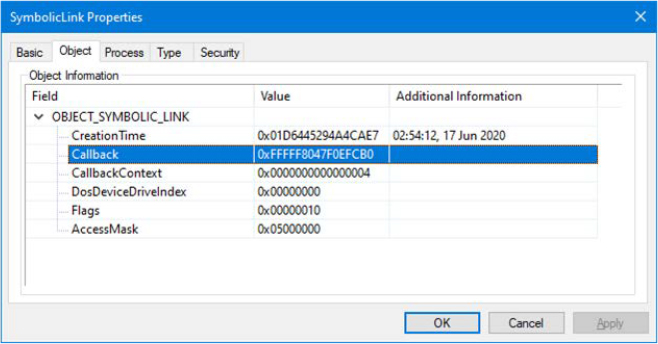
Figure 8-36 The LowMemoryCondition symbolic link redirection callback.
Session namespace
Services have full access to the global namespace, a namespace that serves as the first instance of the namespace. Regular user applications then have read-write (but not delete) access to the global namespace (minus some exceptions we explain soon.) In turn, however, interactive user sessions are then given a session-private view of the namespace known as a local namespace. This namespace provides full read/write access to the base named objects by all applications running within that session and is also used to isolate certain Windows subsystem-specific objects, which are still privileged. The parts of the namespace that are localized for each session include DosDevices, Windows, BaseNamedObjects, and AppContainerNamedObjects.
Making separate copies of the same parts of the namespace is known as instancing the namespace. Instancing DosDevices makes it possible for each user to have different network drive letters and Windows objects such as serial ports. On Windows, the global DosDevices directory is named Global?? and is the directory to which DosDevices points, and local DosDevices directories are identified by the logon session ID.
The Windows directory is where Win32k.sys inserts the interactive window station created by Winlogon, WinSta0. A Terminal Services environment can support multiple interactive users, but each user needs an individual version of WinSta0 to preserve the illusion that he is accessing the predefined interactive window station in Windows. Finally, regular Win32 applications and the system create shared objects in BaseNamedObjects, including events, mutexes, and memory sections. If two users are running an application that creates a named object, each user session must have a private version of the object so that the two instances of the application don’t interfere with one another by accessing the same object. If the Win32 application is running under an AppContainer, however, or is a UWP application, then the sandboxing mechanisms prevent it from accessing BaseNamedObjects, and the AppContainerNamedObjects object directory is used instead, which then has further subdirectories whose names correspond to the Package SID of the AppContainer (see Chapter 7 of Part 1, for more information on AppContainer and the Windows sandboxing model).
The Object Manager implements a local namespace by creating the private versions of the four directories mentioned under a directory associated with the user’s session under Sessionsn (where n is the session identifier). When a Windows application in remote session two creates a named event, for example, the Win32 subsystem (as part of the BaseGetNamedObjectDirectory API in Kernelbase.dll) transparently redirects the object’s name from BaseNamedObjects to Sessions2BaseNamedObjects, or, in the case of an AppContainer, to Sessions2AppContainerNamedObjects<PackageSID>.
One more way through which name objects can be accessed is through a security feature called Base Named Object (BNO) Isolation. Parent processes can launch a child with the ProcThreadAttributeBnoIsolation process attribute (see Chapter 3 of Part 1 for more information on a process’s startup attributes), supplying a custom object directory prefix. In turn, this makes KernelBase.dll create the directory and initial set of objects (such as symbolic links) to support it, and then have NtCreateUserProcess set the prefix (and related initial handles) in the Token object of the child process (specifically, in the BnoIsolationHandlesEntry field) through the data in the native version of process attribute.
Later, BaseGetNamedObjectDirectory queries the Token object to check if BNO Isolation is enabled, and if so, it appends this prefix to any named object operation, such that Sessions2BaseNamedObjects will, for example, become Sessions2BaseNamedObjectsIsolationExample. This can be used to create a sort of sandbox for a process without having to use the AppContainer functionality.
All object-manager functions related to namespace management are aware of the instanced directories and participate in providing the illusion that all sessions use the same namespace. Windows subsystem DLLs prefix names passed by Windows applications that reference objects in the DosDevices directory with ?? (for example, C:Windows becomes ??C:Windows). When the Object Manager sees the special ?? prefix, the steps it takes depend on the version of Windows, but it always relies on a field named DeviceMap in the executive process object (EPROCESS, which is described further in Chapter 3 of Part 1) that points to a data structure shared by other processes in the same session.
The DosDevicesDirectory field of the DeviceMap structure points at the Object Manager directory that represents the process’ local DosDevices. When the Object Manager sees a reference to ??, it locates the process’ local DosDevices by using the DosDevicesDirectory field of the DeviceMap. If the Object Manager doesn’t find the object in that directory, it checks the DeviceMap field of the directory object. If it’s valid, it looks for the object in the directory pointed to by the GlobalDosDevicesDirectory field of the DeviceMap structure, which is always Global??.
Under certain circumstances, session-aware applications need to access objects in the global session even if the application is running in another session. The application might want to do this to synchronize with instances of itself running in other remote sessions or with the console session (that is, session 0). For these cases, the Object Manager provides the special override Global that an application can prefix to any object name to access the global namespace. For example, an application in session two opening an object named GlobalApplicationInitialized is directed to BaseNamedObjectsApplicationInitialized instead of Sessions2BaseNamedObjectsApplicationInitialized.
An application that wants to access an object in the global DosDevices directory does not need to use the Global prefix as long as the object doesn’t exist in its local DosDevices directory. This is because the Object Manager automatically looks in the global directory for the object if it doesn’t find it in the local directory. However, an application can force checking the global directory by using GLOBALROOT.
Session directories are isolated from each other, but as mentioned earlier, regular user applications can create a global object with the Global prefix. However, an important security mitigation exists: Section and symbolic link objects cannot be globally created unless the caller is running in Session 0 or if the caller possesses a special privilege named create global object, unless the object’s name is part of an authorized list of “unsecured names,” which is stored in HKLMSYSTEMCurrentControlSetControlSession Managerkernel, under the ObUnsecureGlobalNames value. By default, these names are usually listed:
■ netfxcustomperfcounters.1.0
■ SharedPerfIPCBlock
■ Cor_Private_IPCBlock
■ Cor_Public_IPCBlock_
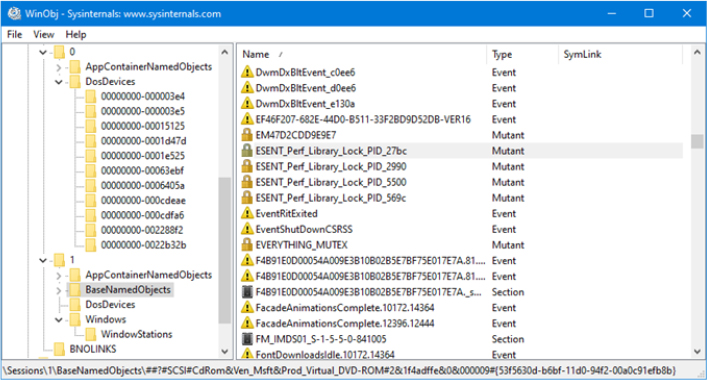

Object filtering
Windows includes a filtering model in the Object Manager, akin to the file system minifilter model and the registry callbacks mentioned in Chapter 10. One of the primary benefits of this filtering model is the ability to use the altitude concept that these existing filtering technologies use, which means that multiple drivers can filter Object Manager events at appropriate locations in the filtering stack. Additionally, drivers are permitted to intercept calls such as NtOpenThread and NtOpenProcess and even to modify the access masks being requested from the process manager. This allows protection against certain operations on an open handle—such as preventing a piece of malware from terminating a benevolent security process or stopping a password dumping application from obtaining read memory permissions on the LSA process. Note, however, that an open operation cannot be entirely blocked due to compatibility issues, such as making Task Manager unable to query the command line or image name of a process.
Furthermore, drivers can take advantage of both pre and post callbacks, allowing them to prepare for a certain operation before it occurs, as well as to react or finalize information after the operation has occurred. These callbacks can be specified for each operation (currently, only open, create, and duplicate are supported) and be specific for each object type (currently, only process, thread, and desktop objects are supported). For each callback, drivers can specify their own internal context value, which can be returned across all calls to the driver or across a pre/post pair. These callbacks can be registered with the ObRegisterCallbacks API and unregistered with the ObUnregisterCallbacks API—it is the responsibility of the driver to ensure deregistration happens.
Use of the APIs is restricted to images that have certain characteristics:
■ The image must be signed, even on 32-bit computers, according to the same rules set forth in the Kernel Mode Code Signing (KMCS) policy. The image must be compiled with the /integritycheck linker flag, which sets the IMAGE_DLLCHARACTERISTICS_FORCE_INTEGRITY value in the PE header. This instructs the memory manager to check the signature of the image regardless of any other defaults that might not normally result in a check.
■ The image must be signed with a catalog containing cryptographic per-page hashes of the executable code. This allows the system to detect changes to the image after it has been loaded in memory.
Before executing a callback, the Object Manager calls the MmVerifyCallbackFunction on the target function pointer, which in turn locates the loader data table entry associated with the module owning this address and verifies whether the LDRP_IMAGE_INTEGRITY_FORCED flag is set.
Synchronization
The concept of mutual exclusion is a crucial one in operating systems development. It refers to the guarantee that one, and only one, thread can access a particular resource at a time. Mutual exclusion is necessary when a resource doesn’t lend itself to shared access or when sharing would result in an unpredictable outcome. For example, if two threads copy a file to a printer port at the same time, their output could be interspersed. Similarly, if one thread reads a memory location while another one writes to it, the first thread will receive unpredictable data. In general, writable resources can’t be shared without restrictions, whereas resources that aren’t subject to modification can be shared. Figure 8-37 illustrates what happens when two threads running on different processors both write data to a circular queue.
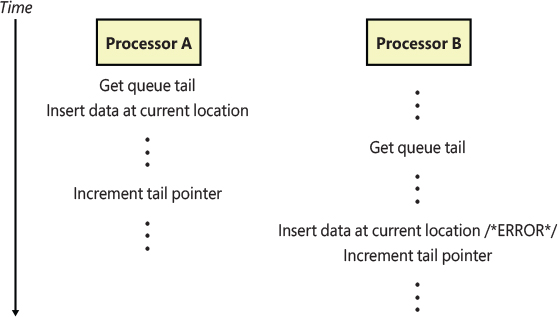
Figure 8-37 Incorrect sharing of memory.
Because the second thread obtained the value of the queue tail pointer before the first thread finished updating it, the second thread inserted its data into the same location that the first thread used, overwriting data and leaving one queue location empty. Even though Figure 8-37 illustrates what could happen on a multiprocessor system, the same error could occur on a single-processor system if the operating system performed a context switch to the second thread before the first thread updated the queue tail pointer.
Sections of code that access a nonshareable resource are called critical sections. To ensure correct code, only one thread at a time can execute in a critical section. While one thread is writing to a file, updating a database, or modifying a shared variable, no other thread can be allowed to access the same resource. The pseudocode shown in Figure 8-37 is a critical section that incorrectly accesses a shared data structure without mutual exclusion.
The issue of mutual exclusion, although important for all operating systems, is especially important (and intricate) for a tightly coupled, symmetric multiprocessing (SMP) operating system such as Windows, in which the same system code runs simultaneously on more than one processor, sharing certain data structures stored in global memory. In Windows, it is the kernel’s job to provide mechanisms that system code can use to prevent two threads from modifying the same data at the same time. The kernel provides mutual-exclusion primitives that it and the rest of the executive use to synchronize their access to global data structures.
Because the scheduler synchronizes access to its data structures at DPC/dispatch level IRQL, the kernel and executive cannot rely on synchronization mechanisms that would result in a page fault or reschedule operation to synchronize access to data structures when the IRQL is DPC/dispatch level or higher (levels known as an elevated or high IRQL). In the following sections, you’ll find out how the kernel and executive use mutual exclusion to protect their global data structures when the IRQL is high and what mutual-exclusion and synchronization mechanisms the kernel and executive use when the IRQL is low (below DPC/dispatch level).
High-IRQL synchronization
At various stages during its execution, the kernel must guarantee that one, and only one, processor at a time is executing within a critical section. Kernel critical sections are the code segments that modify a global data structure such as the kernel’s dispatcher database or its DPC queue. The operating system can’t function correctly unless the kernel can guarantee that threads access these data structures in a mutually exclusive manner.
The biggest area of concern is interrupts. For example, the kernel might be updating a global data structure when an interrupt occurs whose interrupt-handling routine also modifies the structure. Simple single-processor operating systems sometimes prevent such a scenario by disabling all interrupts each time they access global data, but the Windows kernel has a more sophisticated solution. Before using a global resource, the kernel temporarily masks the interrupts whose interrupt handlers also use the resource. It does so by raising the processor’s IRQL to the highest level used by any potential interrupt source that accesses the global data. For example, an interrupt at DPC/dispatch level causes the dispatcher, which uses the dispatcher database, to run. Therefore, any other part of the kernel that uses the dispatcher database raises the IRQL to DPC/dispatch level, masking DPC/dispatch-level interrupts before using the dispatcher database.
This strategy is fine for a single-processor system, but it’s inadequate for a multiprocessor configuration. Raising the IRQL on one processor doesn’t prevent an interrupt from occurring on another processor. The kernel also needs to guarantee mutually exclusive access across several processors.
Interlocked operations
The simplest form of synchronization mechanisms relies on hardware support for multiprocessor-safe manipulation of integer values and for performing comparisons. They include functions such as InterlockedIncrement, InterlockedDecrement, InterlockedExchange, and InterlockedCompareExchange. The InterlockedDecrement function, for example, uses the x86 and x64 lock instruction prefix (for example, lock xadd) to lock the multiprocessor bus during the addition operation so that another processor that’s also modifying the memory location being decremented won’t be able to modify it between the decrementing processor’s read of the original value and its write of the decremented value. This form of basic synchronization is used by the kernel and drivers. In today’s Microsoft compiler suite, these functions are called intrinsic because the code for them is generated in an inline assembler, directly during the compilation phase, instead of going through a function call (it’s likely that pushing the parameters onto the stack, calling the function, copying the parameters into registers, and then popping the parameters off the stack and returning to the caller would be a more expensive operation than the actual work the function is supposed to do in the first place.)
Spinlocks
The mechanism the kernel uses to achieve multiprocessor mutual exclusion is called a spinlock. A spinlock is a locking primitive associated with a global data structure, such as the DPC queue shown in Figure 8-38.
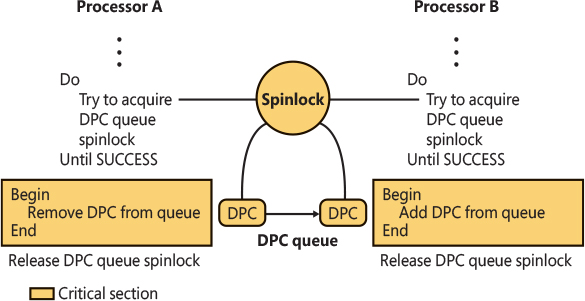
Figure 8-38 Using a spinlock.
Before entering either critical section shown in Figure 8-38, the kernel must acquire the spinlock associated with the protected DPC queue. If the spinlock isn’t free, the kernel keeps trying to acquire the lock until it succeeds. The spinlock gets its name from the fact that the kernel (and thus, the processor) waits, “spinning,” until it gets the lock.
Spinlocks, like the data structures they protect, reside in nonpaged memory mapped into the system address space. The code to acquire and release a spinlock is written in assembly language for speed and to exploit whatever locking mechanism the underlying processor architecture provides. On many architectures, spinlocks are implemented with a hardware-supported test-and-set operation, which tests the value of a lock variable and acquires the lock in one atomic instruction. Testing and acquiring the lock in one instruction prevents a second thread from grabbing the lock between the time the first thread tests the variable and the time it acquires the lock. Additionally, a hardware instruction such the lock instruction mentioned earlier can also be used on the test-and-set operation, resulting in the combined lock bts opcode on x86 and x64 processors, which also locks the multiprocessor bus; otherwise, it would be possible for more than one processor to perform the operation atomically. (Without the lock, the operation is guaranteed to be atomic only on the current processor.) Similarly, on ARM processors, instructions such as ldrex and strex can be used in a similar fashion.
All kernel-mode spinlocks in Windows have an associated IRQL that is always DPC/dispatch level or higher. Thus, when a thread is trying to acquire a spinlock, all other activity at the spinlock’s IRQL or lower ceases on that processor. Because thread dispatching happens at DPC/dispatch level, a thread that holds a spinlock is never preempted because the IRQL masks the dispatching mechanisms. This masking allows code executing in a critical section protected by a spinlock to continue executing so that it will release the lock quickly. The kernel uses spinlocks with great care, minimizing the number of instructions it executes while it holds a spinlock. Any processor that attempts to acquire the spinlock will essentially be busy, waiting indefinitely, consuming power (a busy wait results in 100% CPU usage) and performing no actual work.
On x86 and x64 processors, a special pause assembly instruction can be inserted in busy wait loops, and on ARM processors, yield provides a similar benefit. This instruction offers a hint to the processor that the loop instructions it is processing are part of a spinlock (or a similar construct) acquisition loop. The instruction provides three benefits:
■ It significantly reduces power usage by delaying the core ever so slightly instead of continuously looping.
■ On SMT cores, it allows the CPU to realize that the “work” being done by the spinning logical core is not terribly important and awards more CPU time to the second logical core instead.
■ Because a busy wait loop results in a storm of read requests coming to the bus from the waiting thread (which might be generated out of order), the CPU attempts to correct for violations of memory order as soon as it detects a write (that is, when the owning thread releases the lock). Thus, as soon as the spinlock is released, the CPU reorders any pending memory read operations to ensure proper ordering. This reordering results in a large penalty in system performance and can be avoided with the pause instruction.
If the kernel detects that it is running under a Hyper-V compatible hypervisor, which supports the spinlock enlightenment (described in Chapter 9), the spinlock facility can use the HvlNotifyLongSpinWait library function when it detects that the spinlock is currently owned by another CPU, instead of contiguously spinning and use the pause instruction. The function emits a HvCallNotifyLongSpinWait hypercall to indicate to the hypervisor scheduler that another VP should take over instead of emulating the spin.
The kernel makes spinlocks available to other parts of the executive through a set of kernel functions, including KeAcquireSpinLock and KeReleaseSpinLock. Device drivers, for example, require spinlocks to guarantee that device registers and other global data structures are accessed by only one part of a device driver (and from only one processor) at a time. Spinlocks are not for use by user programs—user programs should use the objects described in the next section. Device drivers also need to protect access to their own data structures from interrupts associated with themselves. Because the spinlock APIs typically raise the IRQL only to DPC/dispatch level, this isn’t enough to protect against interrupts. For this reason, the kernel also exports the KeAcquireInterruptSpinLock and KeReleaseInterruptSpinLock APIs that take as a parameter the KINTERRUPT object discussed at the beginning of this chapter. The system looks inside the interrupt object for the associated DIRQL with the interrupt and raises the IRQL to the appropriate level to ensure correct access to structures shared with the ISR.
Devices can also use the KeSynchronizeExecution API to synchronize an entire function with an ISR instead of just a critical section. In all cases, the code protected by an interrupt spinlock must execute extremely quickly—any delay causes higher-than-normal interrupt latency and will have significant negative performance effects.
Kernel spinlocks carry with them restrictions for code that uses them. Because spinlocks always have an IRQL of DPC/dispatch level or higher, as explained earlier, code holding a spinlock will crash the system if it attempts to make the scheduler perform a dispatch operation or if it causes a page fault.
Queued spinlocks
To increase the scalability of spinlocks, a special type of spinlock, called a queued spinlock, is used in many circumstances instead of a standard spinlock, especially when contention is expected, and fairness is required.
A queued spinlock works like this: When a processor wants to acquire a queued spinlock that is currently held, it places its identifier in a queue associated with the spinlock. When the processor that’s holding the spinlock releases it, it hands the lock over to the next processor identified in the queue. In the meantime, a processor waiting for a busy spinlock checks the status not of the spinlock itself but of a per-processor flag that the processor ahead of it in the queue sets to indicate that the waiting processor’s turn has arrived.
The fact that queued spinlocks result in spinning on per-processor flags rather than global spinlocks has two effects. The first is that the multiprocessor’s bus isn’t as heavily trafficked by interprocessor synchronization, and the memory location of the bit is not in a single NUMA node that then has to be snooped through the caches of each logical processor. The second is that instead of a random processor in a waiting group acquiring a spinlock, the queued spinlock enforces first-in, first-out (FIFO) ordering to the lock. FIFO ordering means more consistent performance (fairness) across processors accessing the same locks. While the reduction in bus traffic and increase in fairness are great benefits, queued spinlocks do require additional overhead, including extra interlocked operations, which do add their own costs. Developers must carefully balance the management overheard with the benefits to decide if a queued spinlock is worth it for them.
Windows uses two different types of queued spinlocks. The first are internal to the kernel only, while the second are available to external and third-party drivers as well. First, Windows defines a number of global queued spinlocks by storing pointers to them in an array contained in each processor’s processor control region (PCR). For example, on x64 systems, these are stored in the LockArray field of the KPCR data structure.
A global spinlock can be acquired by calling KeAcquireQueuedSpinLock with the index into the array at which the pointer to the spinlock is stored. The number of global spinlocks originally grew in each release of the operating system, but over time, more efficient locking hierarchies were used that do not require global per-processor locking. You can view the table of index definitions for these locks in the WDK header file Wdm.h under the KSPIN_LOCK_QUEUE_NUMBER enumeration, but note, however, that acquiring one of these queued spinlocks from a device driver is an unsupported and heavily frowned-upon operation. As we said, these locks are reserved for the kernel’s internal use.
In-stack queued spinlocks
Device drivers can use dynamically allocated queued spinlocks with the KeAcquireInStackQueued SpinLock and KeReleaseInStackQueuedSpinLock functions. Several components—including the cache manager, executive pool manager, and NTFS—take advantage of these types of locks instead of using global queued spinlocks.
KeAcquireInStackQueuedSpinLock takes a pointer to a spinlock data structure and a spinlock queue handle. The spinlock queue handle is actually a data structure in which the kernel stores information about the lock’s status, including the lock’s ownership and the queue of processors that might be waiting for the lock to become available. For this reason, the handle shouldn’t be a global variable. It is usually a stack variable, guaranteeing locality to the caller thread and is responsible for the InStack part of the spinlock and API name.
Reader/writer spin locks
While using queued spinlocks greatly improves latency in highly contended situations, Windows supports another kind of spinlock that can offer even greater benefits by potentially eliminating contention in many situations to begin with. The multi-reader, single-writer spinlock, also called the executive spinlock, is an enhancement on top of regular spinlocks, which is exposed through the ExAcquireSpinLockExclusive, ExAcquireSpinLockShared API, and their ExReleaseXxx counterparts. Additionally, ExTryAcquireSpinLockSharedAtDpcLevel and ExTryConvertSharedSpinLockToExclusive functions exist for more advanced use cases.
As the name suggests, this type of lock allows noncontended shared acquisition of a spinlock if no writer is present. When a writer is interested in the lock, readers must eventually release the lock, and no further readers will be allowed while the writer is active (nor additional writers). If a driver developer often finds themself iterating over a linked list, for example, while only rarely inserting or removing items, this type of lock can remove contention in the majority of cases, removing the need for the complexity of a queued spinlock.
Executive interlocked operations
The kernel supplies some simple synchronization functions constructed on spinlocks for more advanced operations, such as adding and removing entries from singly and doubly linked lists. Examples include ExInterlockedPopEntryList and ExInterlockedPushEntryList for singly linked lists, and ExInterlockedInsertHeadList and ExInterlockedRemoveHeadList for doubly linked lists. A few other functions, such as ExInterlockedAddUlong and ExInterlockedAddLargeInteger also exist. All these functions require a standard spinlock as a parameter and are used throughout the kernel and device drivers’ code.
Instead of relying on the standard APIs to acquire and release the spinlock parameter, these functions place the code required inline and also use a different ordering scheme. Whereas the Ke spinlock APIs first test and set the bit to see whether the lock is released and then atomically perform a locked test-and-set operation to make the acquisition, these routines disable interrupts on the processor and immediately attempt an atomic test-and-set. If the initial attempt fails, interrupts are enabled again, and the standard busy waiting algorithm continues until the test-and-set operation returns 0—in which case the whole function is restarted again. Because of these subtle differences, a spinlock used for the executive interlocked functions must not be used with the standard kernel APIs discussed previously. Naturally, noninterlocked list operations must not be mixed with interlocked operations.
![]() Note
Note
Certain executive interlocked operations silently ignore the spinlock when possible. For example, the ExInterlockedIncrementLong or ExInterlockedCompareExchange APIs use the same lock prefix used by the standard interlocked functions and the intrinsic functions. These functions were useful on older systems (or non-x86 systems) where the lock operation was not suitable or available. For this reason, these calls are now deprecated and are silently inlined in favor of the intrinsic functions.
Low-IRQL synchronization
Executive software outside the kernel also needs to synchronize access to global data structures in a multiprocessor environment. For example, the memory manager has only one page frame database, which it accesses as a global data structure, and device drivers need to ensure that they can gain exclusive access to their devices. By calling kernel functions, the executive can create a spinlock, acquire it, and release it.
Spinlocks only partially fill the executive’s needs for synchronization mechanisms, however. Because waiting for a spinlock literally stalls a processor, spinlocks can be used only under the following strictly limited circumstances:
■ The protected resource must be accessed quickly and without complicated interactions with other code.
■ The critical section code can’t be paged out of memory, can’t make references to pageable data, can’t call external procedures (including system services), and can’t generate interrupts or exceptions.
These restrictions are confining and can’t be met under all circumstances. Furthermore, the executive needs to perform other types of synchronization in addition to mutual exclusion, and it must also provide synchronization mechanisms to user mode.
There are several additional synchronization mechanisms for use when spinlocks are not suitable:
■ Kernel dispatcher objects (mutexes, semaphores, events, and timers)
■ Fast mutexes and guarded mutexes
■ Pushlocks
■ Executive resources
■ Run-once initialization (InitOnce)
Additionally, user-mode code, which also executes at low IRQL, must be able to have its own locking primitives. Windows supports various user-mode-specific primitives:
■ System calls that refer to kernel dispatcher objects (mutants, semaphores, events, and timers)
■ Condition variables (CondVars)
■ Slim Reader-Writer Locks (SRW Locks)
■ Address-based waiting
■ Run-once initialization (InitOnce)
■ Critical sections
We look at the user-mode primitives and their underlying kernel-mode support later; for now, we focus on kernel-mode objects. Table 8-26 compares and contrasts the capabilities of these mechanisms and their interaction with kernel-mode APC delivery.
Table 8-26 Kernel synchronization mechanisms
Exposed for Use by Device Drivers |
Disables Normal Kernel-Mode APCs |
Disables Special Kernel-Mode APCs |
Supports Recursive Acquisition |
Supports Shared and Exclusive Acquisition |
|
|---|---|---|---|---|---|
|
Kernel dispatcher mutexes |
Yes |
Yes |
No |
Yes |
No |
|
Kernel dispatcher semaphores, events, timers |
Yes |
No |
No |
No |
No |
Fast mutexes |
Yes |
Yes |
Yes |
No |
No |
Guarded mutexes |
Yes |
Yes |
Yes |
No |
No |
Pushlocks |
Yes |
No |
No |
No |
Yes |
Executive resources |
Yes |
No |
No |
Yes |
Yes |
Rundown protections |
Yes |
No |
No |
Yes |
No |
Kernel dispatcher objects
The kernel furnishes additional synchronization mechanisms to the executive in the form of kernel objects, known collectively as dispatcher objects. The Windows API-visible synchronization objects acquire their synchronization capabilities from these kernel dispatcher objects. Each Windows API-visible object that supports synchronization encapsulates at least one kernel dispatcher object. The executive’s synchronization semantics are visible to Windows programmers through the WaitForSingleObject and WaitForMultipleObjects functions, which the Windows subsystem implements by calling analogous system services that the Object Manager supplies. A thread in a Windows application can synchronize with a variety of objects, including a Windows process, thread, event, semaphore, mutex, waitable timer, I/O completion port, ALPC port, registry key, or file object. In fact, almost all objects exposed by the kernel can be waited on. Some of these are proper dispatcher objects, whereas others are larger objects that have a dispatcher object within them (such as ports, keys, or files). Table 8-27 (later in this chapter in the section “What signals an object?”) shows the proper dispatcher objects, so any other object that the Windows API allows waiting on probably internally contains one of those primitives.
Table 8-27 Definitions of the signaled state
Object Type |
Set to Signaled State When |
Effect on Waiting Threads |
|---|---|---|
Process |
Last thread terminates. |
All are released. |
Thread |
Thread terminates. |
All are released. |
Event (notification type) |
Thread sets the event. |
All are released. |
Event (synchronization type) |
Thread sets the event. |
One thread is released and might receive a boost; the event object is reset. |
Gate (locking type) |
Thread signals the gate. |
First waiting thread is released and receives a boost. |
Gate (signaling type) |
Thread signals the type. |
First waiting thread is released. |
Keyed event |
Thread sets event with a key. |
Thread that’s waiting for the key and which is of the same process as the signaler is released. |
Semaphore |
Semaphore count drops by 1. |
One thread is released. |
Timer (notification type) |
Set time arrives or time interval expires. |
All are released. |
Timer (synchronization type) |
Set time arrives or time interval expires. |
One thread is released. |
Mutex |
Thread releases the mutex. |
One thread is released and takes ownership of the mutex. |
Queue |
Item is placed on queue. |
One thread is released. |
Two other types of executive synchronization mechanisms worth noting are the executive resource and the pushlock. These mechanisms provide exclusive access (like a mutex) as well as shared read access (multiple readers sharing read-only access to a structure). However, they’re available only to kernel-mode code and thus are not accessible from the Windows API. They’re also not true objects—they have an API exposed through raw pointers and Ex APIs, and the Object Manager and its handle system are not involved. The remaining subsections describe the implementation details of waiting for dispatcher objects.
Waiting for dispatcher objects
The traditional way that a thread can synchronize with a dispatcher object is by waiting for the object’s handle, or, for certain types of objects, directly waiting on the object’s pointer. The NtWaitForXxx class of APIs (which is also what’s exposed to user mode) works with handles, whereas the KeWaitForXxx APIs deal directly with the dispatcher object.
Because the Nt API communicates with the Object Manager (ObWaitForXxx class of functions), it goes through the abstractions that were explained in the section on object types earlier in this chapter. For example, the Nt API allows passing in a handle to a File Object, because the Object Manager uses the information in the object type to redirect the wait to the Event field inside of FILE_OBJECT. The Ke API, on the other hand, only works with true dispatcher objects—that is to say, those that begin with a DISPATCHER_HEADER structure. Regardless of the approach taken, these calls ultimately cause the kernel to put the thread in a wait state.
A completely different, and more modern, approach to waiting on dispatcher objects is to rely on asynchronous waiting. This approach leverages the existing I/O completion port infrastructure to associate a dispatcher object with the kernel queue backing the I/O completion port, by going through an intermediate object called a wait completion packet. Thanks to this mechanism, a thread essentially registers a wait but does not directly block on the dispatcher object and does not enter a wait state. Instead, when the wait is satisfied, the I/O completion port will have the wait completion packet inserted, acting as a notification for anyone who is pulling items from, or waiting on, the I/O completion port. This allows one or more threads to register wait indications on various objects, which a separate thread (or pool of threads) can essentially wait on. As you’ve probably guessed, this mechanism is the linchpin of the Thread Pool API’s functionality supporting wait callbacks, in APIs such as CreateThreadPoolWait and SetThreadPoolWait.
Finally, an extension of the asynchronous waiting mechanism was built into more recent builds of Windows 10, through the DPC Wait Event functionality that is currently reserved for Hyper-V (although the API is exported, it is not yet documented). This introduces a final approach to dispatcher waits, reserved for kernel-mode drivers, in which a deferred procedure call (DPC, explained earlier in this chapter) can be associated with a dispatcher object, instead of a thread or I/O completion port. Similar to the mechanism described earlier, the DPC is registered with the object, and when the wait is satisfied, the DPC is then queued into the current processor’s queue (as if the driver had now just called KeInsertQueueDpc). When the dispatcher lock is dropped and the IRQL returns below DISPATCH_LEVEL, the DPC executes on the current processor, which is the driver-supplied callback that can now react to the signal state of the object.
Irrespective of the waiting mechanism, the synchronization object(s) being waited on can be in one of two states: signaled state or nonsignaled state. A thread can’t resume its execution until its wait is satisfied, a condition that occurs when the dispatcher object whose handle the thread is waiting for also undergoes a state change, from the nonsignaled state to the signaled state (when another thread sets an event object, for example).
To synchronize with an object, a thread calls one of the wait system services that the Object Manager supplies, passing a handle to the object it wants to synchronize with. The thread can wait for one or several objects and can also specify that its wait should be canceled if it hasn’t ended within a certain amount of time. Whenever the kernel sets an object to the signaled state, one of the kernel’s signal routines checks to see whether any threads are waiting for the object and not also waiting for other objects to become signaled. If there are, the kernel releases one or more of the threads from their waiting state so that they can continue executing.
To be asynchronously notified of an object becoming signaled, a thread creates an I/O completion port, and then calls NtCreateWaitCompletionPacket to create a wait completion packet object and receive a handle back to it. Then, it calls NtAssociateWaitCompletionPacket, passing in both the handle to the I/O completion port as well as the handle to the wait completion packet it just created, combined with a handle to the object it wants to be notified about. Whenever the kernel sets an object to the signaled state, the signal routines realize that no thread is currently waiting on the object, and instead check whether an I/O completion port has been associated with the wait. If so, it signals the queue object associated with the port, which causes any threads currently waiting on it to wake up and consume the wait completion packet (or, alternatively, the queue simply becomes signaled until a thread comes in and attempts to wait on it). Alternatively, if no I/O completion port has been associated with the wait, then a check is made to see whether a DPC is associated instead, in which case it will be queued on the current processor. This part handles the kernel-only DPC Wait Event mechanism described earlier.
The following example of setting an event illustrates how synchronization interacts with thread dispatching:
■ A user-mode thread waits for an event object’s handle.
■ The kernel changes the thread’s scheduling state to waiting and then adds the thread to a list of threads waiting for the event.
■ Another thread sets the event.
■ The kernel marches down the list of threads waiting for the event. If a thread’s conditions for waiting are satisfied (see the following note), the kernel takes the thread out of the waiting state. If it is a variable-priority thread, the kernel might also boost its execution priority. (For details on thread scheduling, see Chapter 4 of Part 1.)
![]() Note
Note
Some threads might be waiting for more than one object, so they continue waiting, unless they specified a WaitAny wait, which will wake them up as soon as one object (instead of all) is signaled.
What signals an object?
The signaled state is defined differently for different objects. A thread object is in the nonsignaled state during its lifetime and is set to the signaled state by the kernel when the thread terminates. Similarly, the kernel sets a process object to the signaled state when the process’s last thread terminates. In contrast, the timer object, like an alarm, is set to “go off” at a certain time. When its time expires, the kernel sets the timer object to the signaled state.
When choosing a synchronization mechanism, a programmer must take into account the rules governing the behavior of different synchronization objects. Whether a thread’s wait ends when an object is set to the signaled state varies with the type of object the thread is waiting for, as Table 8-27 illustrates.
When an object is set to the signaled state, waiting threads are generally released from their wait states immediately.
For example, a notification event object (called a manual reset event in the Windows API) is used to announce the occurrence of some event. When the event object is set to the signaled state, all threads waiting for the event are released. The exception is any thread that is waiting for more than one object at a time; such a thread might be required to continue waiting until additional objects reach the signaled state.
In contrast to an event object, a mutex object has ownership associated with it (unless it was acquired during a DPC). It is used to gain mutually exclusive access to a resource, and only one thread at a time can hold the mutex. When the mutex object becomes free, the kernel sets it to the signaled state and then selects one waiting thread to execute, while also inheriting any priority boost that had been applied. (See Chapter 4 of Part 1 for more information on priority boosting.) The thread selected by the kernel acquires the mutex object, and all other threads continue waiting.
A mutex object can also be abandoned, something that occurs when the thread currently owning it becomes terminated. When a thread terminates, the kernel enumerates all mutexes owned by the thread and sets them to the abandoned state, which, in terms of signaling logic, is treated as a signaled state in that ownership of the mutex is transferred to a waiting thread.
This brief discussion wasn’t meant to enumerate all the reasons and applications for using the various executive objects but rather to list their basic functionality and synchronization behavior. For information on how to put these objects to use in Windows programs, see the Windows reference documentation on synchronization objects or Jeffrey Richter and Christophe Nasarre’s book Windows via C/C++ from Microsoft Press.
Object-less waiting (thread alerts)
While the ability to wait for, or be notified about, an object becoming signaled is extremely powerful, and the wide variety of dispatcher objects at programmers’ disposal is rich, sometimes a much simpler approach is needed. One thread wants to wait for a specific condition to occur, and another thread needs to signal the occurrence of the condition. Although this can be achieved by tying an event to the condition, this requires resources (memory and handles, to name a couple), and acquisition and creation of resources can fail while also taking time and being complex. The Windows kernel provides two mechanisms for synchronization that are not tied to dispatcher objects:
■ Thread alerts
■ Thread alert by ID
Although their names are similar, the two mechanisms work in different ways. Let’s look at how thread alerts work. First, the thread wishing to synchronize enters an alertable sleep by using SleepEx (ultimately resulting in NtDelayExecutionThread). A kernel thread could also choose to use KeDelayExecutionThread. We previously explained the concept of alertability earlier in the section on software interrupts and APCs. In this case, the thread can either specify a timeout value or make the sleep infinite. Secondly, the other side uses the NtAlertThread (or KeAlertThread) API to alert the thread, which causes the sleep to abort, returning the status code STATUS_ALERTED. For the sake of completeness, it’s also worth noting that a thread can choose not to enter an alertable sleep state, but instead, at a later time of its choosing, call the NtTestAlert (or KeTestAlertThread) API. Finally, a thread could also avoid entering an alertable wait state by suspending itself instead (NtSuspendThread or KeSuspendThread). In this case, the other side can use NtAlertResumeThread to both alert the thread and then resume it.
Although this mechanism is elegant and simple, it does suffer from a few issues, beginning with the fact that there is no way to identify whether the alert was the one related to the wait—in other words, any other thread could’ve also alerted the waiting thread, which has no way of distinguishing between the alerts. Second, the alert API is not officially documented—meaning that while internal kernel and user services can leverage this mechanism, third-party developers are not meant to use alerts. Third, once a thread becomes alerted, any pending queued APCs also begin executing—such as user-mode APCs if these alert APIs are used by applications. And finally, NtAlertThread still requires opening a handle to the target thread—an operation that technically counts as acquiring a resource, an operation which can fail. Callers could theoretically open their handles ahead of time, guaranteeing that the alert will succeed, but that still does add the cost of a handle in the whole mechanism.
To respond to these issues, the Windows kernel received a more modern mechanism starting with Windows 8, which is the alert by ID. Although the system calls behind this mechanism—NtAlertThreadByThreadId and NtWaitForAlertByThreadId—are not documented, the Win32 user-mode wait API that we describe later is. These system calls are extremely simple and require zero resources, using only the Thread ID as input. Of course, since without a handle, this could be a security issue, the one disadvantage to these APIs is that they can only be used to synchronize with threads within the current process.
Explaining the behavior of this mechanism is fairly obvious: first, the thread blocks with the NtWaitForAlertByThreadId API, passing in an optional timeout. This makes the thread enter a real wait, without alertability being a concern. In fact, in spite of the name, this type of wait is non-alertable, by design. Next, the other thread calls the NtAlertThreadByThreadId API, which causes the kernel to look up the Thread ID, make sure it belongs to the calling process, and then check whether the thread is indeed blocking on a call to NtWaitForAlertByThreadId. If the thread is in this state, it’s simply woken up. This simple, elegant mechanism is the heart of a number of user-mode synchronization primitives later in this chapter and can be used to implement anything from barriers to more complex synchronization methods.
Data structures
Three data structures are key to tracking who is waiting, how they are waiting, what they are waiting for, and which state the entire wait operation is at. These three structures are the dispatcher header, the wait block, and the wait status register. The former two structures are publicly defined in the WDK include file Wdm.h, whereas the latter is not documented but is visible in public symbols with the type KWAIT_STATUS_REGISTER (and the Flags field corresponds to the KWAIT_STATE enumeration).
The dispatcher header is a packed structure because it needs to hold a lot of information in a fixed-size structure. (See the upcoming “EXPERIMENT: Looking at wait queues” section to see the definition of the dispatcher header data structure.) One of the main techniques used in its definition is to store mutually exclusive flags at the same memory location (offset) in the structure, which is called a union in programming theory. By using the Type field, the kernel knows which of these fields is relevant. For example, a mutex can be Abandoned, but a timer can be Relative. Similarly, a timer can be Inserted into the timer list, but debugging can only be Active for a process. Outside of these specific fields, the dispatcher header also contains information that’s meaningful regardless of the dispatcher object: the Signaled state and the Wait List Head for the wait blocks associated with the object.
These wait blocks are what represents that a thread (or, in the case of asynchronous waiting, an I/O completion port) is tied to an object. Each thread that is in a wait state has an array of up to 64 wait blocks that represent the object(s) the thread is waiting for (including, potentially, a wait block pointing to the internal thread timer that’s used to satisfy a timeout that the caller may have specified). Alternatively, if the alert-by-ID primitives are used, there is a single block with a special indication that this is not a dispatcher-based wait. The Object field is replaced by a Hint that is specified by the caller of NtWaitForAlertByThreadId. This array is maintained for two main purposes:
■ When a thread terminates, all objects that it was waiting on must be dereferenced, and the wait blocks deleted and disconnected from the object(s).
■ When a thread is awakened by one of the objects it’s waiting on (that is, by becoming signaled and satisfying the wait), all the other objects it may have been waiting on must be dereferenced and the wait blocks deleted and disconnected.
Just like a thread has this array of all the objects it’s waiting on, as we mentioned just a bit earlier, each dispatcher object also has a linked list of wait blocks tied to it. This list is kept so that when a dispatcher object is signaled, the kernel can quickly determine who is waiting on (or which I/O completion port is tied to) that object and apply the wait satisfaction logic we explain shortly.
Finally, because the balance set manager thread running on each CPU (see Chapter 5 of Part 1 for more information about the balance set manager) needs to analyze the time that each thread has been waiting for (to decide whether to page out the kernel stack), each PRCB has a list of eligible waiting threads that last ran on that processor. This reuses the Ready List field of the KTHREAD structure because a thread can’t both be ready and waiting at the same time. Eligible threads must satisfy the following three conditions:
■ The wait must have been issued with a wait mode of UserMode (KernelMode waits are assumed to be time-sensitive and not worth the cost of stack swapping).
■ The thread must have the EnableStackSwap flag set (kernel drivers can disable this with the KeSetKernelStackSwapEnable API).
■ The thread’s priority must be at or below the Win32 real-time priority range start (24—the default for a normal thread in the “real-time” process priority class).
The structure of a wait block is always fixed, but some of its fields are used in different ways depending on the type of wait. For example, typically, the wait block has a pointer to the object being waited on, but as we pointed out earlier, for an alert-by-ID wait, there is no object involved, so this represents the Hint that was specified by the caller. Similarly, while a wait block usually points back to the thread waiting on the object, it can also point to the queue of an I/O completion port, in the case where a wait completion packet was associated with the object as part of an asynchronous wait.
Two fields that are always maintained, however, are the wait type and the wait block state, and, depending on the type, a wait key can also be present. The wait type is very important during wait satisfaction because it determines which of the five possible types of satisfaction regimes to use: for a wait any, the kernel does not care about the state of any other object because at least one of them (the current one!) is now signaled. On the other hand, for a wait all, the kernel can only wake the thread if all the other objects are also in a signaled state at the same time, which requires iterating over the wait blocks and their associated objects.
Alternatively, a wait dequeue is a specialized case for situations where the dispatcher object is actually a queue (I/O completion port), and there is a thread waiting on it to have completion packets available (by calling KeRemoveQueue(Ex) or (Nt)IoRemoveIoCompletion). Wait blocks attached to queues function in a LIFO wake order (instead of FIFO like other dispatcher objects), so when a queue is signaled, this allows the correct actions to be taken (keep in mind that a thread could be waiting on multiple objects, so it could have other wait blocks, in a wait any or wait all state, that must still be handled regularly).
For a wait notification, the kernel knows that no thread is associated with the object at all and that this is an asynchronous wait with an associated I/O completion port whose queue will be signaled. (Because a queue is itself a dispatcher object, this causes a second order wait satisfaction for the queue and any threads potentially waiting on it.)
Finally, a wait DPC, which is the newest wait type introduced, lets the kernel know that there is no thread nor I/O completion port associated with this wait, but a DPC object instead. In this case, the pointer is to an initialized KDPC structure, which the kernel queues on the current processor for nearly immediate execution once the dispatcher lock is dropped.
The wait block also contains a volatile wait block state (KWAIT_BLOCK_STATE) that defines the current state of this wait block in the transactional wait operation it is currently engaged in. The different states, their meaning, and their effects in the wait logic code are explained in Table 8-28.
Table 8-28 Wait block states
State |
Meaning |
Effect |
|---|---|---|
WaitBlockActive (4) |
This wait block is actively linked to an object as part of a thread that is in a wait state. |
During wait satisfaction, this wait block will be unlinked from the wait block list. |
WaitBlockInactive (5) |
The thread wait associated with this wait block has been satisfied (or the timeout has already expired while setting it up). |
During wait satisfaction, this wait block will not be unlinked from the wait block list because the wait satisfaction must have already unlinked it during its active state. |
WaitBlockSuspended (6) |
The thread associated with this wait block is undergoing a lightweight suspend operation. |
Essentially treated the same as WaitBlockActive but only ever used when resuming a thread. Ignored during regular wait satisfaction (should never be seen, as suspended threads can’t be waiting on something too!). |
WaitBlockBypassStart (0) |
A signal is being delivered to the thread while the wait has not yet been committed. |
During wait satisfaction (which would be immediate, before the thread enters the true wait state), the waiting thread must synchronize with the signaler because there is a risk that the wait object might be on the stack—marking the wait block as inactive would cause the waiter to unwind the stack while the signaler might still be accessing it. |
WaitBlockBypassComplete (1) |
The thread wait associated with this wait block has now been properly synchronized (the wait satisfaction has completed), and the bypass scenario is now completed. |
The wait block is now essentially treated the same as an inactive wait block (ignored). |
WaitBlockSuspendBypassStart (2) |
A signal is being delivered to the thread while the lightweight suspend has not yet been committed. |
The wait block is treated essentially the same as a WaitBlockBypassStart. |
WaitBlockSuspendBypassComplete (3) |
The lightweight suspend associated with this wait block has now been properly synchronized. |
The wait block now behaves like a WaitBlockSuspended. |
Finally, we mentioned the existence of a wait status register. With the removal of the global kernel dispatcher lock in Windows 7, the overall state of the thread (or any of the objects it is being required to start waiting on) can now change while wait operations are still being set up. Since there’s no longer any global state synchronization, there is nothing to stop another thread—executing on a different logical processor—from signaling one of the objects being waited, or alerting the thread, or even sending it an APC. As such, the kernel dispatcher keeps track of a couple of additional data points for each waiting thread object: the current fine-grained wait state of the thread (KWAIT_STATE, not to be confused with the wait block state) and any pending state changes that could modify the result of an ongoing wait operation. These two pieces of data are what make up the wait status register (KWAIT_STATUS_REGISTER).
When a thread is instructed to wait for a given object (such as due to a WaitForSingleObject call), it first attempts to enter the in-progress wait state (WaitInProgress) by beginning the wait. This operation succeeds if there are no pending alerts to the thread at the moment (based on the alertability of the wait and the current processor mode of the wait, which determine whether the alert can preempt the wait). If there is an alert, the wait is not entered at all, and the caller receives the appropriate status code; otherwise, the thread now enters the WaitInProgress state, at which point the main thread state is set to Waiting, and the wait reason and wait time are recorded, with any timeout specified also being registered.
Once the wait is in progress, the thread can initialize the wait blocks as needed (and mark them as WaitBlockActive in the process) and then proceed to lock all the objects that are part of this wait. Because each object has its own lock, it is important that the kernel be able to maintain a consistent locking ordering scheme when multiple processors might be analyzing a wait chain consisting of many objects (caused by a WaitForMultipleObjects call). The kernel uses a technique known as address ordering to achieve this: because each object has a distinct and static kernel-mode address, the objects can be ordered in monotonically increasing address order, guaranteeing that locks are always acquired and released in the same order by all callers. This means that the caller-supplied array of objects will be duplicated and sorted accordingly.
The next step is to check for immediate satisfaction of the wait, such as when a thread is being told to wait on a mutex that has already been released or an event that is already signaled. In such cases, the wait is immediately satisfied, which involves unlinking the associated wait blocks (however, in this case, no wait blocks have yet been inserted) and performing a wait exit (processing any pending scheduler operations marked in the wait status register). If this shortcut fails, the kernel next attempts to check whether the timeout specified for the wait (if any) has already expired. In this case, the wait is not “satisfied” but merely “timed out,” which results in slightly faster processing of the exit code, albeit with the same result.
If none of these shortcuts were effective, the wait block is inserted into the thread’s wait list, and the thread now attempts to commit its wait. (Meanwhile, the object lock or locks have been released, allowing other processors to modify the state of any of the objects that the thread is now supposed to attempt waiting on.) Assuming a noncontended scenario, where other processors are not interested in this thread or its wait objects, the wait switches into the committed state as long as there are no pending changes marked by the wait status register. The commit operation links the waiting thread in the PRCB list, activates an extra wait queue thread if needed, and inserts the timer associated with the wait timeout, if any. Because potentially quite a lot of cycles have elapsed by this point, it is again possible that the timeout has already elapsed. In this scenario, inserting the timer causes immediate signaling of the thread and thus a wait satisfaction on the timer and the overall timeout of the wait. Otherwise, in the much more common scenario, the CPU now context-switches away to the next thread that is ready for execution. (See Chapter 4 of Part 1 for more information on scheduling.)
In highly contended code paths on multiprocessor machines, it is possible and likely that the thread attempting to commit its wait has experienced a change while its wait was still in progress. One possible scenario is that one of the objects it was waiting on has just been signaled. As touched upon earlier, this causes the associated wait block to enter the WaitBlockBypassStart state, and the thread’s wait status register now shows the WaitAborted wait state. Another possible scenario is for an alert or APC to have been issued to the waiting thread, which does not set the WaitAborted state but enables one of the corresponding bits in the wait status register. Because APCs can break waits (depending on the type of APC, wait mode, and alertability), the APC is delivered, and the wait is aborted. Other operations that modify the wait status register without generating a full abort cycle include modifications to the thread’s priority or affinity, which are processed when exiting the wait due to failure to commit, as with the previous cases mentioned.
As we briefly touched upon earlier, and in Chapter 4 of Part 1 in the scheduling section, recent versions of Windows implemented a lightweight suspend mechanism when SuspendThread and ResumeThread are used, which no longer always queues an APC that then acquires the suspend event embedded in the thread object. Instead, if the following conditions are true, an existing wait is instead converted into a suspend state:
■ KiDisableLightWeightSuspend is 0 (administrators can use the DisableLightWeightSuspend value in the HKLMSYSTEMCurrentControlSetSession ManagerKernel registry key to turn off this optimization).
■ The thread state is Waiting—that is, the thread is already in a wait state.
■ The wait status register is set to WaitCommitted—that is, the thread’s wait has been fully engaged.
■ The thread is not an UMS primary or scheduled thread (see Chapter 4 of Part 1 for more information on User Mode Scheduling) because these require additional logic implemented in the scheduler’s suspend APC.
■ The thread issued a wait while at IRQL 0 (passive level) because waits at APC_LEVEL require special handling that only the suspend APC can provide.
■ The thread does not have APCs currently disabled, nor is there an APC in progress, because these situations require additional synchronization that only the delivery of the scheduler’s suspend APC can achieve.
■ The thread is not currently attached to a different process due to a call to KeStackAttachProcess because this requires special handling just like the preceding bullet.
■ If the first wait block associated with the thread’s wait is not in a WaitBlockInactive block state, its wait type must be WaitAll; otherwise, this means that the there’s at least one active WaitAny block.
As the preceding list of criteria is hinting, this conversion happens by taking any currently active wait blocks and converting them to a WaitBlockSuspended state instead. If the wait block is currently pointing to an object, it is unlinked from its dispatcher header’s wait list (such that signaling the object will no longer wake up this thread). If the thread had a timer associated with it, it is canceled and removed from the thread’s wait block array, and a flag is set to remember that this was done. Finally, the original wait mode (Kernel or User) is also preserved in a flag as well.
Because it no longer uses a true wait object, this mechanism required the introduction the three additional wait block states shown in Table 8-28 as well as four new wait states: WaitSuspendInProgress, WaitSuspended, WaitResumeInProgress, and WaitResumeAborted. These new states behave in a similar manner to their regular counterparts but address the same possible race conditions described earlier during a lightweight suspend operation.
For example, when a thread is resumed, the kernel detects whether it was placed in a lightweight suspend state and essentially undoes the operation, setting the wait register to WaitResumeInProgress. Each wait block is then enumerated, and for any block in the WaitBlockSuspended state, it is placed in WaitBlockActive and linked back into the object’s dispatcher header’s wait block list, unless the object became signaled in the meantime, in which case it is made WaitBlockInactive instead, just like in a regular wake operation. Finally, if the thread had a timeout associated with its wait that was canceled, the thread’s timer is reinserted into the timer table, maintaining its original expiration (timeout) time.
Figure 8-39 shows the relationship of dispatcher objects to wait blocks to threads to PRCB (it assumes the threads are eligible for stack swapping). In this example, CPU 0 has two waiting (committed) threads: Thread 1 is waiting for object B, and thread 2 is waiting for objects A and B. If object A is signaled, the kernel sees that because thread 2 is also waiting for another object, thread 2 can’t be readied for execution. On the other hand, if object B is signaled, the kernel can ready thread 1 for execution right away because it isn’t waiting for any other objects. (Alternatively, if thread 1 was also waiting for other objects but its wait type was a WaitAny, the kernel could still wake it up.)
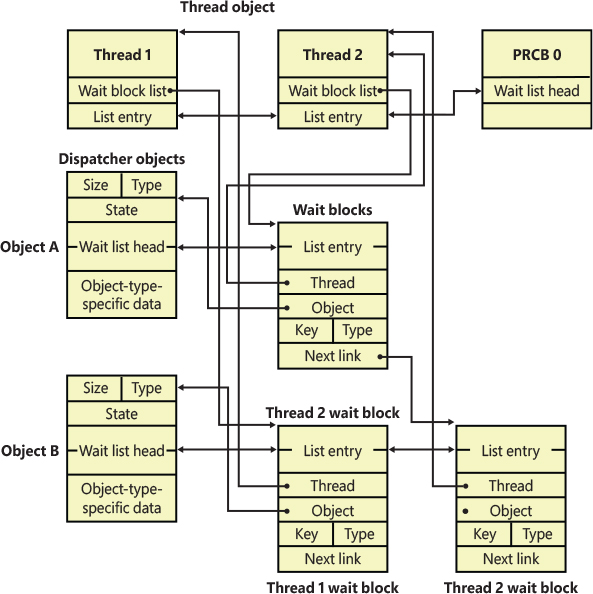
Figure 8-39 Wait data structures.
Keyed events
A synchronization object called a keyed event bears special mention because of the role it played in user-mode-exclusive synchronization primitives and the development of the alert-by-ID primitive, which you’ll shortly realize is Windows’ equivalent of the futex in the Linux operating system (a well-studied computer science concept). Keyed events were originally implemented to help processes deal with low-memory situations when using critical sections, which are user-mode synchronization objects that we’ll see more about shortly. A keyed event, which is not documented, allows a thread to specify a “key” for which it waits, where the thread wakes when another thread of the same process signals the event with the same key. As we pointed out, if this sounds familiar to the alerting mechanism, it is because keyed events were its precursor.
If there was contention, EnterCriticalSection would dynamically allocate an event object, and the thread wanting to acquire the critical section would wait for the thread that owns the critical section to signal it in LeaveCriticalSection. Clearly, this introduces a problem during low-memory conditions: critical section acquisition could fail because the system was unable to allocate the event object required. In a pathological case, the low-memory condition itself might have been caused by the application trying to acquire the critical section, so the system would deadlock in this situation. Low memory wasn’t the only scenario that could cause this to fail—a less likely scenario was handle exhaustion. If the process reached its handle limit, the new handle for the event object could fail.
It might seem that preallocating a global standard event object, similar to the reserve objects we talked about previously, would fix the issue. However, because a process can have multiple critical sections, each of which can have its own locking state, this would require an unknown number of preallocated event objects, and the solution doesn’t work. The main feature of keyed events, however, was that a single event could be reused among different threads, as long as each one provided a different key to distinguish itself. By providing the virtual address of the critical section itself as the key, this effectively allows multiple critical sections (and thus, waiters) to use the same keyed event handle, which can be preallocated at process startup time.
When a thread signals a keyed event or performs a wait on it, it uses a unique identifier called a key, which identifies the instance of the keyed event (an association of the keyed event to a single critical section). When the owner thread releases the keyed event by signaling it, only a single thread waiting on the key is woken up (the same behavior as synchronization events, in contrast to notification events). Going back to our use case of critical sections using their address as a key, this would imply that each process still needs its own keyed event because virtual addresses are obviously unique to a single process address space. However, it turns out that the kernel can wake only the waiters in the current process so that the key is even isolated across processes, meaning that there can be only a single keyed event object for the entire system.
As such, when EnterCriticalSection called NtWaitForKeyedEvent to perform a wait on the keyed event, it gave a NULL handle as parameter for the keyed event, telling the kernel that it was unable to create a keyed event. The kernel recognizes this behavior and uses a global keyed event named ExpCritSecOutOfMemoryEvent. The primary benefit is that processes don’t need to waste a handle for a named keyed event anymore because the kernel keeps track of the object and its references.
However, keyed events were more than just a fallback object for low-memory conditions. When multiple waiters are waiting on the same key and need to be woken up, the key is signaled multiple times, which requires the object to keep a list of all the waiters so that it can perform a “wake” operation on each of them. (Recall that the result of signaling a keyed event is the same as that of signaling a synchronization event.) However, a thread can signal a keyed event without any threads on the waiter list. In this scenario, the signaling thread instead waits on the event itself.
Without this fallback, a signaling thread could signal the keyed event during the time that the user-mode code saw the keyed event as unsignaled and attempt a wait. The wait might have come after the signaling thread signaled the keyed event, resulting in a missed pulse, so the waiting thread would deadlock. By forcing the signaling thread to wait in this scenario, it actually signals the keyed event only when someone is looking (waiting). This behavior made them similar, but not identical, to the Linux futex, and enabled their usage across a number of user-mode primitives, which we’ll see shortly, such as Slim Read Writer (SRW) Locks.
![]() Note
Note
When the keyed-event wait code needs to perform a wait, it uses a built-in semaphore located in the kernel-mode thread object (ETHREAD) called KeyedWaitSemaphore. (This semaphore shares its location with the ALPC wait semaphore.) See Chapter 4 of Part 1 for more information on thread objects.
Keyed events, however, did not replace standard event objects in the critical section implementation. The initial reason, during the Windows XP timeframe, was that keyed events did not offer scalable performance in heavy-usage scenarios. Recall that all the algorithms described were meant to be used only in critical, low-memory scenarios, when performance and scalability aren’t all that important. To replace the standard event object would’ve placed strain on keyed events that they weren’t implemented to handle. The primary performance bottleneck was that keyed events maintained the list of waiters described in a doubly linked list. This kind of list has poor traversal speed, meaning the time required to loop through the list. In this case, this time depended on the number of waiter threads. Because the object is global, dozens of threads could be on the list, requiring long traversal times every single time a key was set or waited on.
![]() Note
Note
The head of the list is kept in the keyed event object, whereas the threads are linked through the KeyedWaitChain field (which is shared with the thread’s exit time, stored as a LARGE_INTEGER, the same size as a doubly linked list) in the kernel-mode thread object (ETHREAD). See Chapter 4 of Part 1 for more information on this object.
Windows Vista improved keyed-event performance by using a hash table instead of a linked list to hold the waiter threads. This optimization is what ultimately allowed Windows to include the three new lightweight user-mode synchronization primitives (to be discussed shortly) that all depended on the keyed event. Critical sections, however, continued to use event objects, primarily for application compatibility and debugging, because the event object and internals are well known and documented, whereas keyed events are opaque and not exposed to the Win32 API.
With the introduction of the new alerting by Thread ID capabilities in Windows 8, however, this all changed again, removing the usage of keyed events across the system (save for one situation in init once synchronization, which we’ll describe shortly). And, as more time had passed, the critical section structure eventually dropped its usage of a regular event object and moved toward using this new capability as well (with an application compatibility shim that can revert to using the original event object if needed).
Fast mutexes and guarded mutexes
Fast mutexes, which are also known as executive mutexes, usually offer better performance than mutex objects because, although they are still built on a dispatcher object—an event—they perform a wait only if the fast mutex is contended. Unlike a standard mutex, which always attempts the acquisition through the dispatcher, this gives the fast mutex especially good performance in contended environments. Fast mutexes are used widely in device drivers.
This efficiency comes with costs, however, as fast mutexes are only suitable when all kernel-mode APC (described earlier in this chapter) delivery can be disabled, unlike regular mutex objects that block only normal APC delivery. Reflecting this, the executive defines two functions for acquiring them: ExAcquireFastMutex and ExAcquireFastMutexUnsafe. The former function blocks all APC delivery by raising the IRQL of the processor to APC level. The latter, “unsafe” function, expects to be called with all kernel-mode APC delivery already disabled, which can be done by raising the IRQL to APC level. ExTryToAcquireFastMutex performs similarly to the first, but it does not actually wait if the fast mutex is already held, returning FALSE instead. Another limitation of fast mutexes is that they can’t be acquired recursively, unlike mutex objects.
In Windows 8 and later, guarded mutexes are identical to fast mutexes but are acquired with KeAcquireGuardedMutex and KeAcquireGuardedMutexUnsafe. Like fast mutexes, a KeTryToAcquireGuardedMutex method also exists.
Prior to Windows 8, these functions did not disable APCs by raising the IRQL to APC level, but by entering a guarded region instead, which set special counters in the thread’s object structure to disable APC delivery until the region was exited, as we saw earlier. On older systems with a PIC (which we also talked about earlier in this chapter), this was faster than touching the IRQL. Additionally, guarded mutexes used a gate dispatcher object, which was slightly faster than an event—another difference that is no longer true.
Another problem related to the guarded mutex was the kernel function KeAreApcsDisabled. Prior to Windows Server 2003, this function indicated whether normal APCs were disabled by checking whether the code was running inside a critical section. In Windows Server 2003, this function was changed to indicate whether the code was in a critical or guarded region, changing the functionality to also return TRUE if special kernel APCs are also disabled.
Because there are certain operations that drivers should not perform when special kernel APCs are disabled, it made sense to call KeGetCurrentIrql to check whether the IRQL is APC level or not, which was the only way special kernel APCs could have been disabled. However, with the introduction of guarded regions and guarded mutexes, which were heavily used even by the memory manager, this check failed because guarded mutexes did not raise IRQL. Drivers then had to call KeAreAllApcsDisabled for this purpose, which also checked whether special kernel APCs were disabled through a guarded region. These idiosyncrasies, combined with fragile checks in Driver Verifier causing false positives, ultimately all led to the decision to simply make guarded mutexes revert to just being fast mutexes.
Executive resources
Executive resources are a synchronization mechanism that supports shared and exclusive access; like fast mutexes, they require that all kernel-mode APC delivery be disabled before they are acquired. They are also built on dispatcher objects that are used only when there is contention. Executive resources are used throughout the system, especially in file-system drivers, because such drivers tend to have long-lasting wait periods in which I/O should still be allowed to some extent (such as reads).
Threads waiting to acquire an executive resource for shared access wait for a semaphore associated with the resource, and threads waiting to acquire an executive resource for exclusive access wait for an event. A semaphore with unlimited count is used for shared waiters because they can all be woken and granted access to the resource when an exclusive holder releases the resource simply by signaling the semaphore. When a thread waits for exclusive access of a resource that is currently owned, it waits on a synchronization event object because only one of the waiters will wake when the event is signaled. In the earlier section on synchronization events, it was mentioned that some event unwait operations can actually cause a priority boost. This scenario occurs when executive resources are used, which is one reason why they also track ownership like mutexes do. (See Chapter 4 of Part 1 for more information on the executive resource priority boost.)
Because of the flexibility that shared and exclusive access offer, there are several functions for acquiring resources: ExAcquireResourceSharedLite, ExAcquireResourceExclusiveLite, ExAcquireSharedStarveExclusive, and ExAcquireShareWaitForExclusive. These functions are documented in the WDK.
Recent versions of Windows also added fast executive resources that use identical API names but add the word “fast,” such as ExAcquireFastResourceExclusive, ExReleaseFastResource, and so on. These are meant to be faster replacements due to different handling of lock ownership, but no component uses them other than the Resilient File System (ReFS). During highly contended file system access, ReFS has slightly better performance than NTFS, in part due to the faster locking.
Pushlocks
Pushlocks are another optimized synchronization mechanism built on event objects; like fast and guarded mutexes, they wait for an event only when there’s contention on the lock. They offer advantages over them, however, in that they can also be acquired in shared or exclusive mode, just like an executive resource. Unlike the latter, however, they provide an additional advantage due to their size: a resource object is 104 bytes, but a pushlock is pointer sized. Because of this, pushlocks do not require allocation nor initialization and are guaranteed to work in low-memory conditions. Many components inside of the kernel moved away from executive resources to pushlocks, and modern third-party drivers all use pushlocks as well.
There are four types of pushlocks: normal, cache-aware, auto-expand, and address-based. Normal pushlocks require only the size of a pointer in storage (4 bytes on 32-bit systems, and 8 bytes on 64-bit systems). When a thread acquires a normal pushlock, the pushlock code marks the pushlock as owned if it is not currently owned. If the pushlock is owned exclusively or the thread wants to acquire the thread exclusively and the pushlock is owned on a shared basis, the thread allocates a wait block on the thread’s stack, initializes an event object in the wait block, and adds the wait block to the wait list associated with the pushlock. When a thread releases a pushlock, the thread wakes a waiter, if any are present, by signaling the event in the waiter’s wait block.
Because a pushlock is only pointer-sized, it actually contains a variety of bits to describe its state. The meaning of those bits changes as the pushlock changes from being contended to noncontended. In its initial state, the pushlock contains the following structure:
■ One lock bit, set to 1 if the lock is acquired
■ One waiting bit, set to 1 if the lock is contended and someone is waiting on it
■ One waking bit, set to 1 if the lock is being granted to a thread and the waiter’s list needs to be optimized
■ One multiple shared bit, set to 1 if the pushlock is shared and currently acquired by more than one thread
■ 28 (on 32-bit Windows) or 60 (on 64-bit Windows) share count bits, containing the number of threads that have acquired the pushlock
As discussed previously, when a thread acquires a pushlock exclusively while the pushlock is already acquired by either multiple readers or a writer, the kernel allocates a pushlock wait block. The structure of the pushlock value itself changes. The share count bits now become the pointer to the wait block. Because this wait block is allocated on the stack, and the header files contain a special alignment directive to force it to be 16-byte aligned, the bottom 4 bits of any pushlock wait-block structure will be all zeros. Therefore, those bits are ignored for the purposes of pointer dereferencing; instead, the 4 bits shown earlier are combined with the pointer value. Because this alignment removes the share count bits, the share count is now stored in the wait block instead.
A cache-aware pushlock adds layers to the normal (basic) pushlock by allocating a pushlock for each processor in the system and associating it with the cache-aware pushlock. When a thread wants to acquire a cache-aware pushlock for shared access, it simply acquires the pushlock allocated for its current processor in shared mode; to acquire a cache-aware pushlock exclusively, the thread acquires the pushlock for each processor in exclusive mode.
As you can imagine, however, with Windows now supporting systems of up to 2560 processors, the number of potential cache-padded slots in the cache-aware pushlock would require immense fixed allocations, even on systems with few processors. Support for dynamic hot-add of processors makes the problem even harder because it would technically require the preallocation of all 2560 slots ahead of time, creating multi-KB lock structures. To solve this, modern versions of Windows also implement the auto-expand push lock. As the name suggests, this type of cache-aware pushlock can dynamically grow the number of cache slots as needed, both based on contention and processor count, while guaranteeing forward progress, leveraging the executive’s slot allocator, which pre-reserves paged or nonpaged pool (depending on flags that were passed in when allocating the auto-expand pushlock).
Unfortunately for third-party developers, cache-aware (and their newer cousins, auto-expand) pushlocks are not officially documented for use, although certain data structures, such as FCB Headers in Windows 10 21H1 and later, do opaquely use them (more information about the FCB structure is available in Chapter 11.) Internal parts of the kernel in which auto-expand pushlocks are used include the memory manager, where they are used to protect Address Windowing Extension (AWE) data structures.
Finally, another kind of nondocumented, but exported, push-lock is the address-based pushlock, which rounds out the implementation with a mechanism similar to the address-based wait we’ll shortly see in user mode. Other than being a different “kind” of pushlock, the address-based pushlock refers more to the interface behind its usage. On one end, a caller uses ExBlockOnAddressPushLock, passing in a pushlock, the virtual address of some variable of interest, the size of the variable (up to 8 bytes), and a comparison address containing the expected, or desired, value of the variable. If the variable does not currently have the expected value, a wait is initialized with ExTimedWaitForUnblockPushLock. This behaves similarly to contended pushlock acquisition, with the difference that a timeout value can be specified. On the other end, a caller uses ExUnblockOnAddressPushLockEx after making a change to an address that is being monitored to signal a waiter that the value has changed. This technique is especially useful when dealing with changes to data protected by a lock or interlocked operation, so that racing readers can wait for the writer’s notification that their change is complete, outside of a lock. Other than a much smaller memory footprint, one of the large advantages that pushlocks have over executive resources is that in the noncontended case they do not require lengthy accounting and integer operations to perform acquisition or release. By being as small as a pointer, the kernel can use atomic CPU instructions to perform these tasks. (For example, on x86 and x64 processors, lock cmpxchg is used, which atomically compares and exchanges the old lock with a new lock.) If the atomic compare and exchange fails, the lock contains values the caller did not expect (callers usually expect the lock to be unused or acquired as shared), and a call is then made to the more complex contended version.
To improve performance even further, the kernel exposes the pushlock functionality as inline functions, meaning that no function calls are ever generated during noncontended acquisition—the assembly code is directly inserted in each function. This increases code size slightly, but it avoids the slowness of a function call. Finally, pushlocks use several algorithmic tricks to avoid lock convoys (a situation that can occur when multiple threads of the same priority are all waiting on a lock and little actual work gets done), and they are also self-optimizing: the list of threads waiting on a pushlock will be periodically rearranged to provide fairer behavior when the pushlock is released.
One more performance optimization that is applicable to pushlock acquisition (including for address-based pushlocks) is the opportunistic spinlock-like behavior during contention, before performing the dispatcher object wait on the pushlock wait block’s event. If the system has at least one other unparked processor (see Chapter 4 of Part 1 for more information on core parking), the kernel enters a tight spin-based loop for ExpSpinCycleCount cycles just like a spinlock would, but without raising the IRQL, issuing a yield instruction (such as a pause on x86/x64) for each iteration. If during any of the iterations, the pushlock now appears to be released, an interlocked operation to acquire the pushlock is performed.
If the spin cycle times out, or the interlocked operation failed (due to a race), or if the system does not have at least one additional unparked processor, then KeWaitForSingleObject is used on the event object in the pushlock wait block. ExpSpinCycleCount is set to 10240 cycles on any machine with more than one logical processor and is not configurable. For systems with an AMD processor that implements the MWAITT (MWAIT Timer) specification, the monitorx and mwaitx instructions are used instead of a spin loop. This hardware-based feature enables waiting, at the CPU level, for the value at an address to change without having to enter a loop, but they allow providing a timeout value so that the wait is not indefinite (which the kernel supplies based on ExpSpinCycleCount).
On a final note, with the introduction of the AutoBoost feature (explained in Chapter 4 of Part 1), pushlocks also leverage its capabilities by default, unless callers use the newer ExXxxPushLockXxxEx, functions, which allow passing in the EX_PUSH_LOCK_FLAG_DISABLE_AUTOBOOST flag that disables the functionality (which is not officially documented). By default, the non-Ex functions now call the newer Ex functions, but without supplying the flag.
Address-based waits
Based on the lessons learned with keyed events, the key synchronization primitive that the Windows kernel now exposes to user mode is the alert-by-ID system call (and its counterpart to wait-on-alert-by-ID). With these two simple system calls, which require no memory allocations or handles, any number of process-local synchronizations can be built, which will include the addressed-based waiting mechanism we’re about to see, on top of which other primitives, such as critical sections and SRW locks, are based upon.
Address-based waiting is based on three documented Win32 API calls: WaitOnAddress, WakeByAddressSingle, and WakeByAddressAll. These functions in KernelBase.dll are nothing more than forwarders into Ntdll.dll, where the real implementations are present under similar names beginning with Rtl, standing for Run Time Library. The Wait API takes in an address pointing to a value of interest, the size of the value (up to 8 bytes), and the address of the undesired value, plus a timeout. The Wake APIs take in the address only.
First, RtlWaitOnAddress builds a local address wait block tracking the thread ID and address and inserts it into a per-process hash table located in the Process Environment Block (PEB). This mirrors the work done by ExBlockOnAddressPushLock as we saw earlier, except that a hash table wasn’t needed because the caller had to store a push lock pointer somewhere. Next, just like the kernel API, RtlWaitOnAddress checks whether the target address already has a value different than the undesirable one and, if so, removes the address wait block, returning FALSE. Otherwise, it will call an internal function to block.
If there is more than one unparked processor available, the blocking function will first attempt to avoid entering the kernel by spinning in user mode on the value of the address wait block bit indicating availability, based on the value of RtlpWaitOnAddressSpinCount, which is hardcoded to 1024 as long as the system has more than one processor. If the wait block still indicates contention, a system call is now made to the kernel using NtWaitForAlertByThreadId, passing in the address as the hint parameter, as well as the timeout.
If the function returns due to a timeout, a flag is set in the address wait block to indicate this, and the block is removed, with the function returning STATUS_TIMEOUT. However, there is a subtle race condition where the caller may have called the Wake function just a few cycles after the wait has timed out. Because the wait block flag is modified with a compare-exchange instruction, the code can detect this and actually calls NtWaitForAlertByThreadId a second time, this time without a timeout. This is guaranteed to return because the code knows that a wake is in progress. Note that in nontimeout cases, there’s no need to remove the wait block, because the waker has already done so.
On the writer’s side, both RtlWakeOnAddressSingle and RtlWakeOnAddressAll leverage the same helper function, which hashes the input address and looks it up in the PEB’s hash table introduced earlier in this section. Carefully synchronizing with compare-exchange instructions, it removes the address wait block from the hash table, and, if committed to wake up any waiters, it iterates over all matching wait blocks for the same address, calling NtAlertThreadByThreadId for each of them, in the All usage of the API, or only the first one, in the Single version of the API.
With this implementation, we essentially now have a user-mode implementation of keyed events that does not rely on any kernel object or handle, not even a single global one, completely removing any failures in low-resource conditions. The only thing the kernel is responsible for is putting the thread in a wait state or waking up the thread from that wait state.
The next few sections cover various primitives that leverage this functionality to provide synchronization during contention.
Critical sections
Critical sections are one of the main synchronization primitives that Windows provides to user-mode application developers on top of the kernel-based synchronization primitives. Critical sections and the other user-mode primitives you’ll see later have one major advantage over their kernel counterparts, which is saving a round trip to kernel mode in cases in which the lock is noncontended (which is typically 99 percent of the time or more). Contended cases still require calling the kernel, however, because it is the only piece of the system that can perform the complex waking and dispatching logic required to make these objects work.
Critical sections can remain in user mode by using a local bit to provide the main exclusive locking logic, much like a pushlock. If the bit is 0, the critical section can be acquired, and the owner sets the bit to 1. This operation doesn’t require calling the kernel but uses the interlocked CPU operations discussed earlier. Releasing the critical section behaves similarly, with bit state changing from 1 to 0 with an interlocked operation. On the other hand, as you can probably guess, when the bit is already 1 and another caller attempts to acquire the critical section, the kernel must be called to put the thread in a wait state.
Akin to pushlocks and address-based waits, critical sections implement a further optimization to avoid entering the kernel: spinning, much like a spinlock (albeit at IRQL 0—Passive Level) on the lock bit, hoping it clears up quickly enough to avoid the blocking wait. By default, this is set to 2000 cycles, but it can be configured differently by using the InitializeCriticalSectionEx or InitializeCriticalSectionAndSpinCount API at creation time, or later, by calling SetCriticalSectionSpinCount.
![]() Note
Note
As we discussed, because WaitForAddressSingle already implements a busy spin wait as an optimization, with a default 1024 cycles, technically there are 3024 cycles spent spinning by default—first on the critical sections’ lock bit and then on the wait address block’s lock bit, before actually entering the kernel.
When they do need to enter the true contention path, critical sections will, the first time they’re called, attempt to initialize their LockSemaphore field. On modern versions of Windows, this is only done if RtlpForceCSToUseEvents is set, which is the case if the KACF_ALLOCDEBUGINFOFORCRITSECTIONS (0x400000) flag is set through the Application Compatibility Database on the current process. If the flag is set, however, the underlying dispatcher event object will be created (even if the field refers to semaphore, the object is an event). Then, assuming that the event was created, a call to WaitForSingleObject is performed to block on the critical section (typically with a per-process configurable timeout value, to aid in the debugging of deadlocks, after which the wait is reattempted).
In cases where the application compatibility shim was not requested, or in extreme low-memory conditions where the shim was requested but the event could not be created, critical sections no longer use the event (nor any of the keyed event functionality described earlier). Instead, they directly leverage the address-based wait mechanism described earlier (also with the same deadlock detection timeout mechanism from the previous paragraph). The address of the local bit is supplied to the call to WaitOnAddress, and as soon as the critical section is released by LeaveCriticalSection, it either calls SetEvent on the event object or WakeAddressSingle on the local bit.
![]() Note
Note
Even though we’ve been referring to APIs by their Win32 name, in reality, critical sections are implemented by Ntdll.dll, and KernelBase.dll merely forwards the functions to identical functions starting with Rtl instead, as they are part of the Run Time Library. Therefore, RtlLeaveCriticalSection calls NtSetEvent. RtlWakeAddressSingle, and so on.
Finally, because critical sections are not kernel objects, they have certain limitations. The primary one is that you cannot obtain a kernel handle to a critical section; as such, no security, naming, or other Object Manager functionality can be applied to a critical section. Two processes cannot use the same critical section to coordinate their operations, nor can duplication or inheritance be used.
User-mode resources
User-mode resources also provide more fine-grained locking mechanisms than kernel primitives. A resource can be acquired for shared mode or for exclusive mode, allowing it to function as a multiple-reader (shared), single-writer (exclusive) lock for data structures such as databases. When a resource is acquired in shared mode and other threads attempt to acquire the same resource, no trip to the kernel is required because none of the threads will be waiting. Only when a thread attempts to acquire the resource for exclusive access, or the resource is already locked by an exclusive owner, is this required.
To make use of the same dispatching and synchronization mechanism you saw in the kernel, resources make use of existing kernel primitives. A resource data structure (RTL_RESOURCE) contains handles to two kernel semaphore objects. When the resource is acquired exclusively by more than one thread, the resource releases the exclusive semaphore with a single release count because it permits only one owner. When the resource is acquired in shared mode by more than one thread, the resource releases the shared semaphore with as many release counts as the number of shared owners. This level of detail is typically hidden from the programmer, and these internal objects should never be used directly.
Resources were originally implemented to support the SAM (or Security Account Manager, which is discussed in Chapter 7 of Part 1) and not exposed through the Windows API for standard applications. Slim Reader-Writer Locks (SRW Locks), described shortly, were later implemented to expose a similar but highly optimized locking primitive through a documented API, although some system components still use the resource mechanism.
Condition variables
Condition variables provide a Windows native implementation for synchronizing a set of threads that are waiting on a specific result to a conditional test. Although this operation was possible with other user-mode synchronization methods, there was no atomic mechanism to check the result of the conditional test and to begin waiting on a change in the result. This required that additional synchronization be used around such pieces of code.
A user-mode thread initializes a condition variable by calling InitializeConditionVariable to set up the initial state. When it wants to initiate a wait on the variable, it can call SleepConditionVariableCS, which uses a critical section (that the thread must have initialized) to wait for changes to the variable, or, even better, SleepConditionVariableSRW, which instead uses a Slim Reader/Writer (SRW) lock, which we describe next, giving the caller the advantage to do a shared (reader) of exclusive (writer) acquisition.
Meanwhile, the setting thread must use WakeConditionVariable (or WakeAllConditionVariable) after it has modified the variable. This call releases the critical section or SRW lock of either one or all waiting threads, depending on which function was used. If this sounds like address-based waiting, it’s because it is—with the additional guarantee of the atomic compare-and-wait operation. Additionally, condition variables were implemented before address-based waiting (and thus, before alert-by-ID) and had to rely on keyed events instead, which were only a close approximation of the desired behavior.
Before condition variables, it was common to use either a notification event or a synchronization event (recall that these are referred to as auto-reset or manual-reset in the Windows API) to signal the change to a variable, such as the state of a worker queue. Waiting for a change required a critical section to be acquired and then released, followed by a wait on an event. After the wait, the critical section had to be reacquired. During this series of acquisitions and releases, the thread might have switched contexts, causing problems if one of the threads called PulseEvent (a similar problem to the one that keyed events solve by forcing a wait for the signaling thread if there is no waiter). With condition variables, acquisition of the critical section or SRW lock can be maintained by the application while SleepConditionVariableCS/SRW is called and can be released only after the actual work is done. This makes writing work-queue code (and similar implementations) much simpler and predictable.
With both SRW locks and critical sections moving to the address-based wait primitives, however, conditional variables can now directly leverage NtWaitForAlertByThreadId and directly signal the thread, while building a conditional variable wait block that’s structurally similar to the address wait block we described earlier. The need for keyed events is thus completely elided, and they remain only for backward compatibility.
Slim Reader/Writer (SRW) locks
Although condition variables are a synchronization mechanism, they are not fully primitive locks because they do implicit value comparisons around their locking behavior and rely on higher-level abstractions to be provided (namely, a lock!). Meanwhile, address-based waiting is a primitive operation, but it provides only the basic synchronization primitive, not true locking. In between these two worlds, Windows has a true locking primitive, which is nearly identical to a pushlock: the Slim Reader/Writer lock (SRW lock).
Like their kernel counterparts, SRW locks are also pointer sized, use atomic operations for acquisition and release, rearrange their waiter lists, protect against lock convoys, and can be acquired both in shared and exclusive mode. Just like pushlocks, SRW locks can be upgraded, or converted, from shared to exclusive and vice versa, and they have the same restrictions around recursive acquisition. The only real difference is that SRW locks are exclusive to user-mode code, whereas pushlocks are exclusive to kernel-mode code, and the two cannot be shared or exposed from one layer to the other. Because SRW locks also use the NtWaitForAlertByThreadId primitive, they require no memory allocation and are guaranteed never to fail (other than through incorrect usage).
Not only can SRW locks entirely replace critical sections in application code, which reduces the need to allocate the large CRITICAL_SECTION structure (and which previously required the creation of an event object), but they also offer multiple-reader, single-writer functionality. SRW locks must first be initialized with InitializeSRWLock or can be statically initialized with a sentinel value, after which they can be acquired or released in either exclusive or shared mode with the appropriate APIs: AcquireSRWLockExclusive, ReleaseSRWLockExclusive, AcquireSRWLockShared, and ReleaseSRWLockShared. APIs also exist for opportunistically trying to acquire the lock, guaranteeing that no blocking operation will occur, as well as converting the lock from one mode to another.
![]() Note
Note
Unlike most other Windows APIs, the SRW locking functions do not return with a value—instead, they generate exceptions if the lock could not be acquired. This makes it obvious that an acquisition has failed so that code that assumes success will terminate instead of potentially proceeding to corrupt user data. Since SRW locks do not fail due to resource exhaustion, the only such exception possible is STATUS_RESOURCE_NOT_OWNED in the case that a nonshared SRW lock is incorrectly being released in shared mode.
The Windows SRW locks do not prefer readers or writers, meaning that the performance for either case should be the same. This makes them great replacements for critical sections, which are writer-only or exclusive synchronization mechanisms, and they provide an optimized alternative to resources. If SRW locks were optimized for readers, they would be poor exclusive-only locks, but this isn’t the case. This is why we earlier mentioned that conditional variables can also use SRW locks through the SleepConditionVariableSRW API. That being said, since keyed events are no longer used in one mechanism (SRW) but are still used in the other (CS), address-based waiting has muted most benefits other than code size—and the ability to have shared versus exclusive locking. Nevertheless, code targeting older versions of Windows should use SRW locks to guarantee the increased benefits are there on kernels that still used keyed events.
Run once initialization
The ability to guarantee the atomic execution of a piece of code responsible for performing some sort of initialization task—such as allocating memory, initializing certain variables, or even creating objects on demand—is a typical problem in multithreaded programming. In a piece of code that can be called simultaneously by multiple threads (a good example is the DllMain routine, which initializes a DLL), there are several ways of attempting to ensure the correct, atomic, and unique execution of initialization tasks.
For this scenario, Windows implements init once, or one-time initialization (also called run once initialization internally). The API exists both as a Win32 variant, which calls into Ntdll.dll’s Run Time Library (Rtl) as all the other previously seen mechanisms do, as well as the documented Rtl set of APIs, which are exposed to kernel programmers in Ntoskrnl.exe instead (obviously, user-mode developers could bypass Win32 and use the Rtl functions in Ntdll.dll too, but that is never recommended). The only difference between the two implementations is that the kernel ends up using an event object for synchronization, whereas user mode uses a keyed event instead (in fact, it passes in a NULL handle to use the low-memory keyed event that was previously used by critical sections).
![]() Note
Note
Since recent versions of Windows now implement an address-based pushlock in kernel mode, as well as the address-based wait primitive in user mode, the Rtl library could probably be updated to use RtlWakeAddressSingle and ExBlockOnAddressPushLock, and in fact a future version of Windows could always do that—the keyed event merely provided a more similar interface to a dispatcher event object in older Windows versions. As always, do not rely on the internal details presented in this book, as they are subject to change.
The init once mechanism allows for both synchronous (meaning that the other threads must wait for initialization to complete) execution of a certain piece of code, as well as asynchronous (meaning that the other threads can attempt to do their own initialization and race) execution. We look at the logic behind asynchronous execution after explaining the synchronous mechanism.
In the synchronous case, the developer writes the piece of code that would normally execute after double-checking the global variable in a dedicated function. Any information that this routine needs can be passed through the parameter variable that the init once routine accepts. Any output information is returned through the context variable. (The status of the initialization itself is returned as a Boolean.) All the developer has to do to ensure proper execution is call InitOnceExecuteOnce with the parameter, context, and run-once function pointer after initializing an INIT_ONCE object with InitOnceInitialize API. The system takes care of the rest.
For applications that want to use the asynchronous model instead, the threads call InitOnceBeginInitialize and receive a BOOLEAN pending status and the context described earlier. If the pending status is FALSE, initialization has already taken place, and the thread uses the context value for the result. (It’s also possible for the function to return FALSE, meaning that initialization failed.) However, if the pending status comes back as TRUE, the thread should race to be the first to create the object. The code that follows performs whatever initialization tasks are required, such as creating objects or allocating memory. When this work is done, the thread calls InitOnceComplete with the result of the work as the context and receives a BOOLEAN status. If the status is TRUE, the thread won the race, and the object that it created or allocated is the one that will be the global object. The thread can now save this object or return it to a caller, depending on the usage.
In the more complex scenario when the status is FALSE, this means that the thread lost the race. The thread must undo all the work it did, such as deleting objects or freeing memory, and then call InitOnceBeginInitialize again. However, instead of requesting to start a race as it did initially, it uses the INIT_ONCE_CHECK_ONLY flag, knowing that it has lost, and requests the winner’s context instead (for example, the objects or memory that were created or allocated by the winner). This returns another status, which can be TRUE, meaning that the context is valid and should be used or returned to the caller, or FALSE, meaning that initialization failed and nobody has been able to perform the work (such as in the case of a low-memory condition, perhaps).
In both cases, the mechanism for run-once initialization is similar to the mechanism for condition variables and SRW locks. The init once structure is pointer-size, and inline assembly versions of the SRW acquisition/release code are used for the noncontended case, whereas keyed events are used when contention has occurred (which happens when the mechanism is used in synchronous mode) and the other threads must wait for initialization. In the asynchronous case, the locks are used in shared mode, so multiple threads can perform initialization at the same time. Although not as highly efficient as the alert-by-ID primitive, the usage of a keyed event still guarantees that the init once mechanism will function even in most cases of memory exhaustion.
Advanced local procedure call
All modern operating systems require a mechanism for securely and efficiently transferring data between one or more processes in user mode, as well as between a service in the kernel and clients in user mode. Typically, UNIX mechanisms such as mailslots, files, named pipes, and sockets are used for portability, whereas in other cases, developers can use OS-specific functionality, such as the ubiquitous window messages used in Win32 graphical applications. In addition, Windows also implements an internal IPC mechanism called Advanced (or Asynchronous) Local Procedure Call, or ALPC, which is a high-speed, scalable, and secured facility for message passing arbitrary-size messages.
![]() Note
Note
ALPC is the replacement for an older IPC mechanism initially shipped with the very first kernel design of Windows NT, called LPC, which is why certain variables, fields, and functions might still refer to “LPC” today. Keep in mind that LPC is now emulated on top of ALPC for compatibility and has been removed from the kernel (legacy system calls still exist, which get wrapped into ALPC calls).
Although it is internal, and thus not available for third-party developers, ALPC is widely used in various parts of Windows:
■ Windows applications that use remote procedure call (RPC), a documented API, indirectly use ALPC when they specify local-RPC over the ncalrpc transport, a form of RPC used to communicate between processes on the same system. This is now the default transport for almost all RPC clients. In addition, when Windows drivers leverage kernel-mode RPC, this implicitly uses ALPC as well as the only transport permitted.
■ Whenever a Windows process and/or thread starts, as well as during any Windows subsystem operation, ALPC is used to communicate with the subsystem process (CSRSS). All subsystems communicate with the session manager (SMSS) over ALPC.
■ When a Windows process raises an exception, the kernel’s exception dispatcher communicates with the Windows Error Reporting (WER) Service by using ALPC. Processes also can communicate with WER on their own, such as from the unhandled exception handler. (WER is discussed later in Chapter 10.)
■ Winlogon uses ALPC to communicate with the local security authentication process, LSASS.
■ The security reference monitor (an executive component explained in Chapter 7 of Part 1) uses ALPC to communicate with the LSASS process.
■ The user-mode power manager and power monitor communicate with the kernel-mode power manager over ALPC, such as whenever the LCD brightness is changed.
■ The User-Mode Driver Framework (UMDF) enables user-mode drivers to communicate with the kernel-mode reflector driver by using ALPC.
■ The new Core Messaging mechanism used by CoreUI and modern UWP UI components use ALPC to both register with the Core Messaging Registrar, as well as to send serialized message objects, which replace the legacy Win32 window message model.
■ The Isolated LSASS process, when Credential Guard is enabled, communicates with LSASS by using ALPC. Similarly, the Secure Kernel transmits trustlet crash dump information through ALPC to WER.
■ As you can see from these examples, ALPC communication crosses all possible types of security boundaries—from unprivileged applications to the kernel, from VTL 1 trustlets to VTL 0 services, and everything in between. Therefore, security and performance were critical requirements in its design.
Connection model
Typically, ALPC messages are used between a server process and one or more client processes of that server. An ALPC connection can be established between two or more user-mode processes or between a kernel-mode component and one or more user-mode processes, or even between two kernel-mode components (albeit this would not be the most efficient way of communicating). ALPC exposes a single executive object called the port object to maintain the state needed for communication. Although this is just one object, there are several kinds of ALPC ports that it can represent:
■ Server connection port A named port that is a server connection request point. Clients can connect to the server by connecting to this port.
■ Server communication port An unnamed port a server uses to communicate with one of its clients. The server has one such port per active client.
■ Client communication port An unnamed port each client uses to communicate with its server.
■ Unconnected communication port An unnamed port a client can use to communicate locally with itself. This model was abolished in the move from LPC to ALPC but is emulated for Legacy LPC for compatibility reasons.
ALPC follows a connection and communication model that’s somewhat reminiscent of BSD socket programming. A server first creates a server connection port (NtAlpcCreatePort), whereas a client attempts to connect to it (NtAlpcConnectPort). If the server was in a listening state (by using NtAlpcSendWaitReceivePort), it receives a connection request message and can choose to accept it (NtAlpcAcceptConnectPort). In doing so, both the client and server communication ports are created, and each respective endpoint process receives a handle to its communication port. Messages are then sent across this handle (still by using NtAlpcSendWaitReceivePort), which the server continues to receive by using the same API. Therefore, in the simplest scenario, a single server thread sits in a loop calling NtAlpcSendWaitReceivePort and receives with connection requests, which it accepts, or messages, which it handles and potentially responds to. The server can differentiate between messages by reading the PORT_HEADER structure, which sits on top of every message and contains a message type. The various message types are shown in Table 8-30.
Table 8-30 ALPC message types
Type |
Meaning |
|---|---|
LPC_REQUEST |
A normal ALPC message, with a potential synchronous reply |
LPC_REPLY |
An ALPC message datagram, sent as an asynchronous reply to a previous datagram |
LPC_DATAGRAM |
An ALPC message datagram, which is immediately released and cannot be synchronously replied to |
LPC_LOST_REPLY |
Deprecated, used by Legacy LPC Reply API |
LPC_PORT_CLOSED |
Sent whenever the last handle of an ALPC port is closed, notifying clients and servers that the other side is gone |
LPC_CLIENT_DIED |
Sent by the process manager (PspExitThread) using Legacy LPC to the registered termination port(s) of the thread and the registered exception port of the process |
LPC_EXCEPTION |
Sent by the User-Mode Debugging Framework (DbgkForwardException) to the exception port through Legacy LPC |
LPC_DEBUG_EVENT |
Deprecated, used by the legacy user-mode debugging services when these were part of the Windows subsystem |
LPC_ERROR_EVENT |
Sent whenever a hard error is generated from user-mode (NtRaiseHardError) and sent using Legacy LPC to exception port of the target thread, if any, otherwise to the error port, typically owned by CSRSS |
LPC_CONNECTION_REQUEST |
An ALPC message that represents an attempt by a client to connect to the server’s connection port |
LPC_CONNECTION_REPLY |
The internal message that is sent by a server when it calls NtAlpcAcceptConnectPort to accept a client’s connection request |
LPC_CANCELED |
The received reply by a client or server that was waiting for a message that has now been canceled |
LPC_UNREGISTER_PROCESS |
Sent by the process manager when the exception port for the current process is swapped to a different one, allowing the owner (typically CSRSS) to unregister its data structures for the thread switching its port to a different one |
The server can also deny the connection, either for security reasons or simply due to protocol or versioning issues. Because clients can send a custom payload with a connection request, this is usually used by various services to ensure that the correct client, or only one client, is talking to the server. If any anomalies are found, the server can reject the connection and, optionally, return a payload containing information on why the client was rejected (allowing the client to take corrective action, if possible, or for debugging purposes).
Once a connection is made, a connection information structure (actually, a blob, as we describe shortly) stores the linkage between all the different ports, as shown in Figure 8-40.
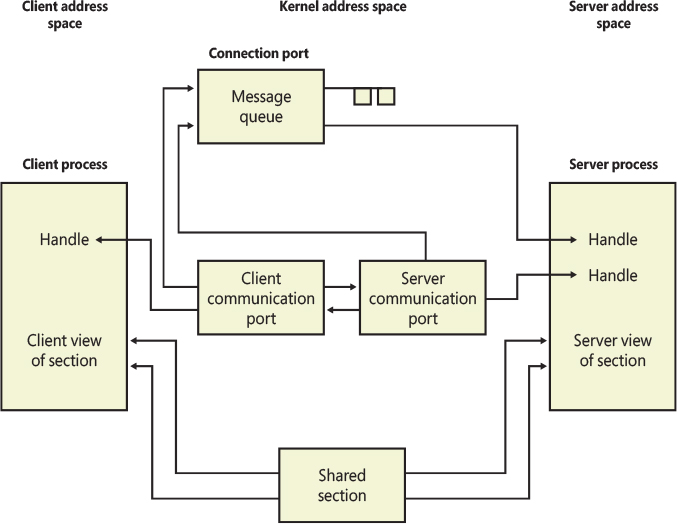
Figure 8-40 Use of ALPC ports.
Message model
Using ALPC, a client and thread using blocking messages each take turns performing a loop around the NtAlpcSendWaitReceivePort system call, in which one side sends a request and waits for a reply while the other side does the opposite. However, because ALPC supports asynchronous messages, it’s possible for either side not to block and choose instead to perform some other runtime task and check for messages later (some of these methods will be described shortly). ALPC supports the following three methods of exchanging payloads sent with a message:
■ A message can be sent to another process through the standard double-buffering mechanism, in which the kernel maintains a copy of the message (copying it from the source process), switches to the target process, and copies the data from the kernel’s buffer. For compatibility, if legacy LPC is being used, only messages of up to 256 bytes can be sent this way, whereas ALPC can allocate an extension buffer for messages up to 64 KB.
■ A message can be stored in an ALPC section object from which the client and server processes map views. (See Chapter 5 in Part 1 for more information on section mappings.)
An important side effect of the ability to send asynchronous messages is that a message can be canceled—for example, when a request takes too long or if the user has indicated that they want to cancel the operation it implements. ALPC supports this with the NtAlpcCancelMessage system call.
An ALPC message can be on one of five different queues implemented by the ALPC port object:
■ Main queue A message has been sent, and the client is processing it.
■ Pending queue A message has been sent and the caller is waiting for a reply, but the reply has not yet been sent.
■ Large message queue A message has been sent, but the caller’s buffer was too small to receive it. The caller gets another chance to allocate a larger buffer and request the message payload again.
■ Canceled queue A message that was sent to the port but has since been canceled.
■ Direct queue A message that was sent with a direct event attached.
Note that a sixth queue, called the wait queue, does not link messages together; instead, it links all the threads waiting on a message.


Asynchronous operation
The synchronous model of ALPC is tied to the original LPC architecture in the early NT design and is similar to other blocking IPC mechanisms, such as Mach ports. Although it is simple to design, a blocking IPC algorithm includes many possibilities for deadlock, and working around those scenarios creates complex code that requires support for a more flexible asynchronous (nonblocking) model. As such, ALPC was primarily designed to support asynchronous operation as well, which is a requirement for scalable RPC and other uses, such as support for pending I/O in user-mode drivers. A basic feature of ALPC, which wasn’t originally present in LPC, is that blocking calls can have a timeout parameter. This allows legacy applications to avoid certain deadlock scenarios.
However, ALPC is optimized for asynchronous messages and provides three different models for asynchronous notifications. The first doesn’t actually notify the client or server but simply copies the data payload. Under this model, it’s up to the implementor to choose a reliable synchronization method. For example, the client and the server can share a notification event object, or the client can poll for data arrival. The data structure used by this model is the ALPC completion list (not to be confused with the Windows I/O completion port). The ALPC completion list is an efficient, nonblocking data structure that enables atomic passing of data between clients, and its internals are described further in the upcoming “Performance” section.
The next notification model is a waiting model that uses the Windows completion-port mechanism (on top of the ALPC completion list). This enables a thread to retrieve multiple payloads at once, control the maximum number of concurrent requests, and take advantage of native completion-port functionality. The user-mode thread pool implementation provides internal APIs that processes use to manage ALPC messages within the same infrastructure as worker threads, which are implemented using this model. The RPC system in Windows, when using Local RPC (over ncalrpc), also makes use of this functionality to provide efficient message delivery by taking advantage of this kernel support, as does the kernel mode RPC runtime in Msrpc.sys.
Finally, because drivers can run in arbitrary context and typically do not like creating dedicated system threads for their operation, ALPC also provides a mechanism for a more basic, kernel-based notification using executive callback objects. A driver can register its own callback and context with NtSetInformationAlpcPort, after which it will get called whenever a message is received. The Power Dependency Coordinator (Pdc.sys) in the kernel employs this mechanism for communicating with its clients, for example. It’s worth noting that using an executive callback object has potential advantages—but also security risks—in terms of performance. Because the callbacks are executed in a blocking fashion (once signaled), and inline with the signaling code, they will always run in the context of an ALPC message sender (that is, inline with a user-mode thread calling NtAlpcSendWaitReceivePort). This means that the kernel component can have the chance to examine the state of its client without the cost of a context switch and can potentially consume the payload in the context of the sender.
The reason these are not absolute guarantees, however (and this becomes a risk if the implementor is unaware), is that multiple clients can send a message to the port at the same time and existing messages can be sent by a client before the server registers its executive callback object. It’s also possible for another client to send yet another message while the server is still processing the first message from a different client. In all these cases, the server will run in the context of one of the clients that sent a message but may be analyzing a message sent by a different client. The server should distinguish this situation (since the Client ID of the sender is encoded in the PORT_HEADER of the message) and attach/analyze the state of the correct sender (which now has a potential context switch cost).
Views, regions, and sections
Instead of sending message buffers between their two respective processes, a server and client can choose a more efficient data-passing mechanism that is at the core of the memory manager in Windows: the section object. (More information is available in Chapter 5 in Part 1.) This allows a piece of memory to be allocated as shared and for both client and server to have a consistent, and equal, view of this memory. In this scenario, as much data as can fit can be transferred, and data is merely copied into one address range and immediately available in the other. Unfortunately, shared-memory communication, such as LPC traditionally provided, has its share of drawbacks, especially when considering security ramifications. For one, because both client and server must have access to the shared memory, an unprivileged client can use this to corrupt the server’s shared memory and even build executable payloads for potential exploits. Additionally, because the client knows the location of the server’s data, it can use this information to bypass ASLR protections. (See Chapter 5 in Part 1 for more information.)
ALPC provides its own security on top of what’s provided by section objects. With ALPC, a specific ALPC section object must be created with the appropriate NtAlpcCreatePortSection API, which creates the correct references to the port, as well as allows for automatic section garbage collection. (A manual API also exists for deletion.) As the owner of the ALPC section object begins using the section, the allocated chunks are created as ALPC regions, which represent a range of used addresses within the section and add an extra reference to the message. Finally, within a range of shared memory, the clients obtain views to this memory, which represents the local mapping within their address space.
Regions also support a couple of security options. First, regions can be mapped either using a secure mode or an unsecure mode. In the secure mode, only two views (mappings) are allowed to the region. This is typically used when a server wants to share data privately with a single client process. Additionally, only one region for a given range of shared memory can be opened from within the context of a given port. Finally, regions can also be marked with write-access protection, which enables only one process context (the server) to have write access to the view (by using MmSecureVirtualMemoryAgainstWrites). Other clients, meanwhile, will have read-only access only. These settings mitigate many privilege-escalation attacks that could happen due to attacks on shared memory, and they make ALPC more resilient than typical IPC mechanisms.
Attributes
ALPC provides more than simple message passing; it also enables specific contextual information to be added to each message and have the kernel track the validity, lifetime, and implementation of that information. Users of ALPC can assign their own custom context information as well. Whether it’s system-managed or user-managed, ALPC calls this data attributes. There are seven attributes that the kernel manages:
■ The security attribute, which holds key information to allow impersonation of clients, as well as advanced ALPC security functionality (which is described later).
■ The data view attribute, responsible for managing the different views associated with the regions of an ALPC section. It is also used to set flags such as the auto-release flag, and when replying, to unmap a view manually.
■ The context attribute, which allows user-managed context pointers to be placed on a port, as well as on a specific message sent across the port. In addition, a sequence number, message ID, and callback ID are stored here and managed by the kernel, which allows uniqueness, message-based hashing, and sequencing to be implemented by users of ALPC.
■ The handle attribute, which contains information about which handles to associate with the message (which is described in more detail later in the “Handle passing” section).
■ The token attribute, which can be used to get the Token ID, Authentication ID, and Modified ID of the message sender, without using a full-blown security attribute (but which does not, on its own, allow impersonation to occur).
■ The direct attribute, which is used when sending direct messages that have a synchronization object associated with them (described later in the “Direct event” section).
■ The work-on-behalf-of attribute, which is used to encode a work ticket used for better power management and resource management decisions (see the “Power management” section later).
Some of these attributes are initially passed in by the server or client when the message is sent and converted into the kernel’s own internal ALPC representation. If the ALPC user requests this data back, it is exposed back securely. In a few cases, a server or client can always request an attribute, because it is ALPC that internally associates it with a message and always makes it available (such as the context or token attributes). By implementing this kind of model and combining it with its own internal handle table, described next, ALPC can keep critical data opaque between clients and servers while still maintaining the true pointers in kernel mode.
To define attributes correctly, a variety of APIs are available for internal ALPC consumers, such as AlpcInitializeMessageAttribute and AlpcGetMessageAttribute.
Blobs, handles, and resources
Although the ALPC subsystem exposes only one Object Manager object type (the port), it internally must manage a number of data structures that allow it to perform the tasks required by its mechanisms. For example, ALPC needs to allocate and track the messages associated with each port, as well as the message attributes, which it must track for the duration of their lifetime. Instead of using the Object Manager’s routines for data management, ALPC implements its own lightweight objects called blobs. Just like objects, blobs can automatically be allocated and garbage collected, reference tracked, and locked through synchronization. Additionally, blobs can have custom allocation and deallocation callbacks, which let their owners control extra information that might need to be tracked for each blob. Finally, ALPC also uses the executive’s handle table implementation (used for objects and PIDs/TIDs) to have an ALPC-specific handle table, which allows ALPC to generate private handles for blobs, instead of using pointers.
In the ALPC model, messages are blobs, for example, and their constructor generates a message ID, which is itself a handle into ALPC’s handle table. Other ALPC blobs include the following:
■ The connection blob, which stores the client and server communication ports, as well as the server connection port and ALPC handle table.
■ The security blob, which stores the security data necessary to allow impersonation of a client. It stores the security attribute.
■ The section, region, and view blobs, which describe ALPC’s shared-memory model. The view blob is ultimately responsible for storing the data view attribute.
■ The reserve blob, which implements support for ALPC Reserve Objects. (See the “Reserve objects” section earlier in this chapter.)
■ The handle data blob, which contains the information that enables ALPC’s handle attribute support.
Because blobs are allocated from pageable memory, they must carefully be tracked to ensure their deletion at the appropriate time. For certain kinds of blobs, this is easy: for example, when an ALPC message is freed, the blob used to contain it is also deleted. However, certain blobs can represent numerous attributes attached to a single ALPC message, and the kernel must manage their lifetime appropriately. For example, because a message can have multiple views associated with it (when many clients have access to the same shared memory), the views must be tracked with the messages that reference them. ALPC implements this functionality by using a concept of resources. Each message is associated with a resource list, and whenever a blob associated with a message (that isn’t a simple pointer) is allocated, it is also added as a resource of the message. In turn, the ALPC library provides functionality for looking up, flushing, and deleting associated resources. Security blobs, reserve blobs, and view blobs are all stored as resources.
Handle passing
A key feature of Unix Domain Sockets and Mach ports, which are the most complex and most used IPC mechanisms on Linux and macOS, respectively, is the ability to send a message that encodes a file descriptor which will then be duplicated in the receiving process, granting it access to a UNIX-style file (such as a pipe, socket, or actual file system location). With ALPC, Windows can now also benefit from this model, with the handle attribute exposed by ALPC. This attribute allows a sender to encode an object type, some information about how to duplicate the handle, and the handle index in the table of the sender. If the handle index matches the type of object the sender is claiming to send, a duplicated handle is created, for the moment, in the system (kernel) handle table. This first part guarantees that the sender truly is sending what it is claiming, and that at this point, any operation the sender might undertake does not invalidate the handle or the object beneath it.
Next, the receiver requests exposing the handle attribute, specifying the type of object they expect. If there is a match, the kernel handle is duplicated once more, this time as a user-mode handle in the table of the receiver (and the kernel copy is now closed). The handle passing has been completed, and the receiver is guaranteed to have a handle to the exact same object the sender was referencing and of the type the receiver expects. Furthermore, because the duplication is done by the kernel, it means a privileged server can send a message to an unprivileged client without requiring the latter to have any type of access to the sending process.
This handle-passing mechanism, when first implemented, was primarily used by the Windows subsystem (CSRSS), which needs to be made aware of any child processes created by existing Windows processes, so that they can successfully connect to CSRSS when it is their turn to execute, with CSRSS already knowing about their creation from the parent. It had several issues, however, such as the inability to send more than a single handle (and certainly not more than one type of object). It also forced receivers to always receive any handle associated with a message on the port without knowing ahead of time if the message should have a handle associated with it to begin with.
To rectify these issues, Windows 8 and later now implement the indirect handle passing mechanism, which allows sending multiple handles of different types and allows receivers to manually retrieve handles on a per-message basis. If a port accepts and enables such indirect handles (non-RPC-based ALPC servers typically do not use indirect handles), handles will no longer be automatically duplicated based on the handle attribute passed in when receiving a new message with NtAlpcSendWaitReceivePort—instead, ALPC clients and servers will have to manually query how many handles a given message contains, allocate sufficient data structures to receive the handle values and their types, and then request the duplication of all the handles, parsing the ones that match the expected types (while closing/dropping unexpected ones) by using NtAlpcQueryInformationMessage and passing in the received message.
This new behavior also introduces a security benefit—instead of handles being automatically duplicated as soon as the caller specifies a handle attribute with a matching type, they are only duplicated when requested on a per-message basis. Because a server might expect a handle for message A, but not necessarily for all other messages, nonindirect handles can be problematic if the server doesn’t think of closing any possible handle even while parsing message B or C. With indirect handles, the server would never call NtAlpcQueryInformationMessage for such messages, and the handles would never be duplicated (or necessitate closing them).
Due to these improvements, the ALPC handle-passing mechanism is now exposed beyond just the limited use-cases described and is integrated with the RPC runtime and IDL compiler. It is now possible to use the system_handle(sh_type) syntax to indicate more than 20 different handle types that the RPC runtime can marshal from a client to a server (or vice-versa). Furthermore, although ALPC provides the type checking from the kernel’s perspective, as described earlier, the RPC runtime itself also does additional type checking—for example, while both named pipes, sockets, and actual files are all “File Objects” (and thus handles of type “File”), the RPC runtime can do marshalling and unmarshalling checks to specifically detect whether a Socket handle is being passed when the IDL file indicates system_handle(sh_pipe), for example (this is done by calling APIs such as GetFileAttribute, GetDeviceType, and so on).
This new capability is heavily leveraged by the AppContainer infrastructure and is the key way through which the WinRT API transfers handles that are opened by the various brokers (after doing capability checks) and duplicated back into the sandboxed application for direct use. Other RPC services that leverage this functionality include the DNS Client, which uses it to populate the ai_resolutionhandle field in the GetAddrInfoEx API.
Security
ALPC implements several security mechanisms, full security boundaries, and mitigations to prevent attacks in case of generic IPC parsing bugs. At a base level, ALPC port objects are managed by the same Object Manager interfaces that manage object security, preventing nonprivileged applications from obtaining handles to server ports with ACL. On top of that, ALPC provides a SID-based trust model, inherited from the original LPC design. This model enables clients to validate the server they are connecting to by relying on more than just the port name. With a secured port, the client process submits to the kernel the SID of the server process it expects on the side of the endpoint. At connection time, the kernel validates that the client is indeed connecting to the expected server, mitigating namespace squatting attacks where an untrusted server creates a port to spoof a server.
ALPC also allows both clients and servers to atomically and uniquely identify the thread and process responsible for each message. It also supports the full Windows impersonation model through the NtAlpcImpersonateClientThread API. Other APIs give an ALPC server the ability to query the SIDs associated with all connected clients and to query the LUID (locally unique identifier) of the client’s security token (which is further described in Chapter 7 of Part 1).
ALPC port ownership
The concept of port ownership is important to ALPC because it provides a variety of security guarantees to interested clients and servers. First and foremost, only the owner of an ALPC connection port can accept connections on the port. This ensures that if a port handle were to be somehow duplicated or inherited into another process, it would not be able to illegitimately accept incoming connections. Additionally, when handle attributes are used (direct or indirect), they are always duplicated in the context of the port owner process, regardless of who may be currently parsing the message.
These checks are highly relevant when a kernel component might be communicating with a client using ALPC—the kernel component may currently be attached to a completely different process (or even be operating as part of the System process with a system thread consuming the ALPC port messages), and knowledge of the port owner means ALPC does not incorrectly rely on the current process.
Conversely, however, it may be beneficial for a kernel component to arbitrarily accept incoming connections on a port regardless of the current process. One poignant example of this issue is when an executive callback object is used for message delivery. In this scenario, because the callback is synchronously called in the context of one or more sender processes, whereas the kernel connection port was likely created while executing in the System context (such as in DriverEntry), there would be a mismatch between the current process and the port owner process during the acceptance of the connection. ALPC provides a special port attribute flag—which only kernel callers can use—that marks a connection port as a system port; in such a case, the port owner checks are ignored.
Another important use case of port ownership is when performing server SID validation checks if a client has requested it, as was described in the “Security” section. This validation is always done by checking against the token of the owner of the connection port, regardless of who may be listening for messages on the port at this time.
Performance
ALPC uses several strategies to enhance performance, primarily through its support of completion lists, which were briefly described earlier. At the kernel level, a completion list is essentially a user Memory Descriptor List (MDL) that’s been probed and locked and then mapped to an address. (For more information on MDLs, see Chapter 5 in Part 1.) Because it’s associated with an MDL (which tracks physical pages), when a client sends a message to a server, the payload copy can happen directly at the physical level instead of requiring the kernel to double-buffer the message, as is common in other IPC mechanisms.
The completion list itself is implemented as a 64-bit queue of completed entries, and both user-mode and kernel-mode consumers can use an interlocked compare-exchange operation to insert and remove entries from the queue. Furthermore, to simplify allocations, once an MDL has been initialized, a bitmap is used to identify available areas of memory that can be used to hold new messages that are still being queued. The bitmap algorithm also uses native lock instructions on the processor to provide atomic allocation and deallocation of areas of physical memory that can be used by completion lists. Completion lists can be set up with NtAlpcSetInformationPort.
A final optimization worth mentioning is that instead of copying data as soon as it is sent, the kernel sets up the payload for a delayed copy, capturing only the needed information, but without any copying. The message data is copied only when the receiver requests the message. Obviously, if shared memory is being used, there’s no advantage to this method, but in asynchronous, kernel-buffer message passing, this can be used to optimize cancellations and high-traffic scenarios.
Power management
As we’ve seen previously, when used in constrained power environments, such as mobile platforms, Windows uses a number of techniques to better manage power consumption and processor availability, such as by doing heterogenous processing on architectures that support it (such as ARM64’s big.LITTLE) and by implementing Connected Standby as a way to further reduce power on user systems when under light use.
To play nice with these mechanisms, ALPC implements two additional features: the ability for ALPC clients to push wake references onto their ALPC server’s wake channel and the introduction of the Work On Behalf Of Attribute. The latter is an attribute that a sender can choose to associate with a message when it wants to associate the request with the current work ticket that it is associated with, or to create a new work ticket that describes the sending thread.
Such work tickets are used, for example, when the sender is currently part of a Job Object (either due to being in a Silo/Windows Container or by being part of a heterogenous scheduling system and/or Connected Standby system) and their association with a thread will cause various parts of the system to attribute CPU cycles, I/O request packets, disk/network bandwidth attribution, and energy estimation to be associated to the “behalf of” thread and not the acting thread.
Additionally, foreground priority donation and other scheduling steps are taken to avoid big.LITTLE priority inversion issues, where an RPC thread is stuck on the small core simply by virtue of being a background service. With a work ticket, the thread is forcibly scheduled on the big core and receives a foreground boost as a donation.
Finally, wake references are used to avoid deadlock situations when the system enters a connected standby (also called Modern Standby) state, as was described in Chapter 6 of Part 1, or when a UWP application is targeted for suspension. These references allow the lifetime of the process owning the ALPC port to be pinned, preventing the force suspend/deep freeze operations that the Process Lifetime Manager (PLM) would attempt (or the Power Manager, even for Win32 applications). Once the message has been delivered and processed, the wake reference can be dropped, allowing the process to be suspended if needed. (Recall that termination is not a problem because sending a message to a terminated process/closed port immediately wakes up the sender with a special PORT_CLOSED reply, instead of blocking on a response that will never come.)
ALPC direct event attribute
Recall that ALPC provides two mechanisms for clients and servers to communicate: requests, which are bidirectional, requiring a response, and datagrams, which are unidirectional and can never be synchronously replied to. A middle ground would be beneficial—a datagram-type message that cannot be replied to but whose receipt could be acknowledged in such a way that the sending party would know that the message was acted upon, without the complexity of having to implement response processing. In fact, this is what the direct event attribute provides.
By allowing a sender to associate a handle to a kernel event object (through CreateEvent) with the ALPC message, the direct event attribute captures the underlying KEVENT and adds a reference to it, tacking it onto the KALPC_MESSAGE structure. Then, when the receiving process gets the message, it can expose this direct event attribute and cause it to be signaled. A client could either have a Wait Completion Packet associated with an I/O completion port, or it could be in a synchronous wait call such as with WaitForSingleObject on the event handle and would now receive a notification and/or wait satisfaction, informing it of the message’s successful delivery.
This functionality was previously manually provided by the RPC runtime, which allows clients calling RpcAsyncInitializeHandle to pass in RpcNotificationTypeEvent and associate a HANDLE to an event object with an asynchronous RPC message. Instead of forcing the RPC runtime on the other side to respond to a request message, such that the RPC runtime on the sender’s side would then signal the event locally to signal completion, ALPC now captures it into a Direct Event attribute, and the message is placed on a Direct Message Queue instead of the regular Message Queue. The ALPC subsystem will signal the message upon delivery, efficiently in kernel mode, avoiding an extra hop and context-switch.
Debugging and tracing
On checked builds of the kernel, ALPC messages can be logged. All ALPC attributes, blobs, message zones, and dispatch transactions can be individually logged, and undocumented !alpc commands in WinDbg can dump the logs. On retail systems, IT administrators and troubleshooters can enable the ALPC events of the NT kernel logger to monitor ALPC messages, (Event Tracing for Windows, also known as ETW, is discussed in Chapter 10.) ETW events do not include payload data, but they do contain connection, disconnection, and send/receive and wait/unblock information. Finally, even on retail systems, certain !alpc commands obtain information on ALPC ports and messages.
Windows Notification Facility
The Windows Notification Facility, or WNF, is the core underpinning of a modern registrationless publisher/subscriber mechanism that was added in Windows 8 as a response to a number of architectural deficiencies when it came to notifying interested parties about the existence of some action, event, or state, and supplying a data payload associated with this state change.
To illustrate this, consider the following scenario: Service A wants to notify potential clients B, C, and D that the disk has been scanned and is safe for write access, as well as the number of bad sectors (if any) that were detected during the scan. There is no guarantee that B, C, D start after A—in fact, there’s a good chance they might start earlier. In this case, it is unsafe for them to continue their execution, and they should wait for A to execute and report the disk is safe for write access. But if A isn’t even running yet, how does one wait for it in the first place?
A typical solution would be for B to create an event “CAN_I_WAIT_FOR_A_YET” and then have A look for this event once started, create the “A_SAYS_DISK_IS_SAFE” event and then signal “CAN_I_WAIT_FOR_A_YET,” allowing B to know it’s now safe to wait for “A_SAYS_DISK_IS_SAFE”. In a single client scenario, this is feasible, but things become even more complex once we think about C and D, which might all be going through this same logic and could race the creation of the “CAN_I_WAIT_FOR_A_YET” event, at which point they would open the existing event (in our example, created by B) and wait on it to be signaled. Although this can be done, what guarantees that this event is truly created by B? Issues around malicious “squatting” of the name and denial of service attacks around the name now arise. Ultimately, a safe protocol can be designed, but this requires a lot of complexity for the developer(s) of A, B, C, and D—and we haven’t even discussed how to get the number of bad sectors.
WNF features
The scenario described in the preceding section is a common one in operating system design—and the correct pattern for solving it clearly shouldn’t be left to individual developers. Part of a job of an operating system is to provide simple, scalable, and performant solutions to common architectural challenges such as these, and this is what WNF aims to provide on modern Windows platforms, by providing:
■ The ability to define a state name that can be subscribed to, or published to by arbitrary processes, secured by a standard Windows security descriptor (with a DACL and SACL)
■ The ability to associate such a state name with a payload of up to 4 KB, which can be retrieved along with the subscription to a change in the state (and published with the change)
■ The ability to have well-known state names that are provisioned with the operating system and do not need to be created by a publisher while potentially racing with consumers—thus consumers will block on the state change notification even if a publisher hasn’t started yet
■ The ability to persist state data even between reboots, such that consumers may be able to see previously published data, even if they were not yet running
■ The ability to assign state change timestamps to each state name, such that consumers can know, even across reboots, if new data was published at some point without the consumer being active (and whether to bother acting on previously published data)
■ The ability to assign scope to a given state name, such that multiple instances of the same state name can exist either within an interactive session ID, a server silo (container), a given user token/SID, or even within an individual process.
■ Finally, the ability to do all of the publishing and consuming of WNF state names while crossing the kernel/user boundary, such that components can interact with each other on either side.
WNF users
As the reader can tell, providing all these semantics allows for a rich set of services and kernel components to leverage WNF to provide notifications and other state change signals to hundreds of clients (which could be as fine-grained as individual APIs in various system libraries to large scale processes). In fact, several key system components and infrastructure now use WNF, such as
■ The Power Manager and various related components use WNF to signal actions such as closing and opening the lid, battery charging state, turning the monitor off and on, user presence detection, and more.
■ The Shell and its components use WNF to track application launches, user activity, lock screen behavior, taskbar behavior, Cortana usage, and Start menu behavior.
■ The System Events Broker (SEB) is an entire infrastructure that is leveraged by UWP applications and brokers to receive notifications about system events such as the audio input and output.
■ The Process Manager uses per-process temporary WNF state names to implement the wake channel that is used by the Process Lifetime Manager (PLM) to implement part of the mechanism that allows certain events to force-wake processes that are marked for suspension (deep freeze).
Enumerating all users of WNF would take up this entire book because more than 6000 different well-known state names are used, in addition to the various temporary names that are created (such as the per-process wake channels). However, a later experiment showcases the use of the wnfdump utility part of the book tools, which allows the reader to enumerate and interact with all of their system’s WNF events and their data. The Windows Debugging Tools also provide a !wnf extension that is shown in a future experiment and can also be used for this purpose. Meanwhile, the Table 8-31 explains some of the key WNF state name prefixes and their uses. You will encounter many Windows components and codenames across a vast variety of Windows SKUs, from Windows Phone to XBOX, exposing the richness of the WNF mechanism and its pervasiveness.
Table 8-31 WNF state name prefixes
Prefix |
# of Names |
Usage |
|---|---|---|
9P |
2 |
Plan 9 Redirector |
A2A |
1 |
App-to-App |
AAD |
2 |
Azure Active Directory |
AA |
3 |
Assigned Access |
ACC |
1 |
Accessibility |
ACHK |
1 |
Boot Disk Integrity Check (Autochk) |
ACT |
1 |
Activity |
AFD |
1 |
Ancillary Function Driver (Winsock) |
AI |
9 |
Application Install |
AOW |
1 |
Android-on-Windows (Deprecated) |
ATP |
1 |
Microsoft Defender ATP |
AUDC |
15 |
Audio Capture |
AVA |
1 |
Voice Activation |
AVLC |
3 |
Volume Limit Change |
BCST |
1 |
App Broadcast Service |
BI |
16 |
Broker Infrastructure |
BLTH |
14 |
Bluetooth |
BMP |
2 |
Background Media Player |
BOOT |
3 |
Boot Loader |
BRI |
1 |
Brightness |
BSC |
1 |
Browser Configuration (Legacy IE, Deprecated) |
CAM |
66 |
Capability Access Manager |
CAPS |
1 |
Central Access Policies |
CCTL |
1 |
Call Control Broker |
CDP |
17 |
Connected Devices Platform (Project “Rome”/Application Handoff) |
CELL |
78 |
Cellular Services |
CERT |
2 |
Certificate Cache |
CFCL |
3 |
Flight Configuration Client Changes |
CI |
4 |
Code Integrity |
CLIP |
6 |
Clipboard |
CMFC |
1 |
Configuration Management Feature Configuration |
CMPT |
1 |
Compatibility |
CNET |
10 |
Cellular Networking (Data) |
CONT |
1 |
Containers |
CSC |
1 |
Client Side Caching |
CSHL |
1 |
Composable Shell |
CSH |
1 |
Custom Shell Host |
CXH |
6 |
Cloud Experience Host |
DBA |
1 |
Device Broker Access |
DCSP |
1 |
Diagnostic Log CSP |
DEP |
2 |
Deployment (Windows Setup) |
DEVM |
3 |
Device Management |
DICT |
1 |
Dictionary |
DISK |
1 |
Disk |
DISP |
2 |
Display |
DMF |
4 |
Data Migration Framework |
DNS |
1 |
DNS |
DO |
2 |
Delivery Optimization |
DSM |
2 |
Device State Manager |
DUMP |
2 |
Crash Dump |
DUSM |
2 |
Data Usage Subscription Management |
DWM |
9 |
Desktop Window Manager |
DXGK |
2 |
DirectX Kernel |
DX |
24 |
DirectX |
EAP |
1 |
Extensible Authentication Protocol |
EDGE |
4 |
Edge Browser |
EDP |
15 |
Enterprise Data Protection |
EDU |
1 |
Education |
EFS |
2 |
Encrypted File Service |
EMS |
1 |
Emergency Management Services |
ENTR |
86 |
Enterprise Group Policies |
EOA |
8 |
Ease of Access |
ETW |
1 |
Event Tracing for Windows |
EXEC |
6 |
Execution Components (Thermal Monitoring) |
FCON |
1 |
Feature Configuration |
FDBK |
1 |
Feedback |
FLTN |
1 |
Flighting Notifications |
FLT |
2 |
Filter Manager |
FLYT |
1 |
Flight ID |
FOD |
1 |
Features on Demand |
FSRL |
2 |
File System Runtime (FsRtl) |
FVE |
15 |
Full Volume Encryption |
GC |
9 |
Game Core |
GIP |
1 |
Graphics |
GLOB |
3 |
Globalization |
GPOL |
2 |
Group Policy |
HAM |
1 |
Host Activity Manager |
HAS |
1 |
Host Attestation Service |
HOLO |
32 |
Holographic Services |
HPM |
1 |
Human Presence Manager |
HVL |
1 |
Hypervisor Library (Hvl) |
HYPV |
2 |
Hyper-V |
IME |
4 |
Input Method Editor |
IMSN |
7 |
Immersive Shell Notifications |
IMS |
1 |
Entitlements |
INPUT |
5 |
Input |
IOT |
2 |
Internet of Things |
ISM |
4 |
Input State Manager |
IUIS |
1 |
Immersive UI Scale |
KSR |
2 |
Kernel Soft Reboot |
KSV |
5 |
Kernel Streaming |
LANG |
2 |
Language Features |
LED |
1 |
LED Alert |
LFS |
12 |
Location Framework Service |
LIC |
9 |
Licensing |
LM |
7 |
License Manager |
LOC |
3 |
Geolocation |
LOGN |
8 |
Logon |
MAPS |
3 |
Maps |
MBAE |
1 |
MBAE |
MM |
3 |
Memory Manager |
MON |
1 |
Monitor Devices |
MRT |
5 |
Microsoft Resource Manager |
MSA |
7 |
Microsoft Account |
MSHL |
1 |
Minimal Shell |
MUR |
2 |
Media UI Request |
MU |
1 |
Unknown |
NASV |
5 |
Natural Authentication Service |
NCB |
1 |
Network Connection Broker |
NDIS |
2 |
Kernel NDIS |
NFC |
1 |
Near Field Communication (NFC) Services |
NGC |
12 |
Next Generation Crypto |
NLA |
2 |
Network Location Awareness |
NLM |
6 |
Network Location Manager |
NLS |
4 |
Nationalization Language Services |
NPSM |
1 |
Now Playing Session Manager |
NSI |
1 |
Network Store Interface Service |
OLIC |
4 |
OS Licensing |
OOBE |
4 |
Out-Of-Box-Experience |
OSWN |
8 |
OS Storage |
OS |
2 |
Base OS |
OVRD |
1 |
Window Override |
PAY |
1 |
Payment Broker |
PDM |
2 |
Print Device Manager |
PFG |
2 |
Pen First Gesture |
PHNL |
1 |
Phone Line |
PHNP |
3 |
Phone Private |
PHN |
2 |
Phone |
PMEM |
1 |
Persistent Memory |
PNPA-D |
13 |
Plug-and-Play Manager |
PO |
54 |
Power Manager |
PROV |
6 |
Runtime Provisioning |
PS |
1 |
Kernel Process Manager |
PTI |
1 |
Push to Install Service |
RDR |
1 |
Kernel SMB Redirector |
RM |
3 |
Game Mode Resource Manager |
RPCF |
1 |
RPC Firewall Manager |
RTDS |
2 |
Runtime Trigger Data Store |
RTSC |
2 |
Recommended Troubleshooting Client |
SBS |
1 |
Secure Boot State |
SCH |
3 |
Secure Channel (SChannel) |
SCM |
1 |
Service Control Manager |
SDO |
1 |
Simple Device Orientation Change |
SEB |
61 |
System Events Broker |
SFA |
1 |
Secondary Factor Authentication |
SHEL |
138 |
Shell |
SHR |
3 |
Internet Connection Sharing (ICS) |
SIDX |
1 |
Search Indexer |
SIO |
2 |
Sign-In Options |
SYKD |
2 |
SkyDrive (Microsoft OneDrive) |
SMSR |
3 |
SMS Router |
SMSS |
1 |
Session Manager |
SMS |
1 |
SMS Messages |
SPAC |
2 |
Storage Spaces |
SPCH |
4 |
Speech |
SPI |
1 |
System Parameter Information |
SPLT |
4 |
Servicing |
SRC |
1 |
System Radio Change |
SRP |
1 |
System Replication |
SRT |
1 |
System Restore (Windows Recovery Environment) |
SRUM |
1 |
Sleep Study |
SRV |
2 |
Server Message Block (SMB/CIFS) |
STOR |
3 |
Storage |
SUPP |
1 |
Support |
SYNC |
1 |
Phone Synchronization |
SYS |
1 |
System |
TB |
1 |
Time Broker |
TEAM |
4 |
TeamOS Platform |
TEL |
5 |
Microsoft Defender ATP Telemetry |
TETH |
2 |
Tethering |
THME |
1 |
Themes |
TKBN |
24 |
Touch Keyboard Broker |
TKBR |
3 |
Token Broker |
TMCN |
1 |
Tablet Mode Control Notification |
TOPE |
1 |
Touch Event |
TPM |
9 |
Trusted Platform Module (TPM) |
TZ |
6 |
Time Zone |
UBPM |
4 |
User Mode Power Manager |
UDA |
1 |
User Data Access |
UDM |
1 |
User Device Manager |
UMDF |
2 |
User Mode Driver Framework |
UMGR |
9 |
User Manager |
USB |
8 |
Universal Serial Bus (USB) Stack |
USO |
16 |
Update Orchestrator |
UTS |
2 |
User Trusted Signals |
UUS |
1 |
Unknown |
UWF |
4 |
Unified Write Filter |
VAN |
1 |
Virtual Area Networks |
VPN |
1 |
Virtual Private Networks |
VTSV |
2 |
Vault Service |
WAAS |
2 |
Windows-as-a-Service |
WBIO |
1 |
Windows Biometrics |
WCDS |
1 |
Wireless LAN |
WCM |
6 |
Windows Connection Manager |
WDAG |
2 |
Windows Defender Application Guard |
WDSC |
1 |
Windows Defender Security Settings |
WEBA |
2 |
Web Authentication |
WER |
3 |
Windows Error Reporting |
WFAS |
1 |
Windows Firewall Application Service |
WFDN |
3 |
WiFi Display Connect (MiraCast) |
WFS |
5 |
Windows Family Safety |
WHTP |
2 |
Windows HTTP Library |
WIFI |
15 |
Windows Wireless Network (WiFi) Stack |
WIL |
20 |
Windows Instrumentation Library |
WNS |
1 |
Windows Notification Service |
WOF |
1 |
Windows Overlay Filter |
WOSC |
9 |
Windows One Setting Configuration |
WPN |
5 |
Windows Push Notifications |
WSC |
1 |
Windows Security Center |
WSL |
1 |
Windows Subsystem for Linux |
WSQM |
1 |
Windows Software Quality Metrics (SQM) |
WUA |
6 |
Windows Update |
WWAN |
5 |
Wireless Wire Area Network (WWAN) Service |
XBOX |
116 |
XBOX Services |
WNF state names and storage
WNF state names are represented as random-looking 64-bit identifiers such as 0xAC41491908517835 and then defined to a friendly name using C preprocessor macros such as WNF_AUDC_CAPTURE_ACTIVE. In reality, however, these numbers are used to encode a version number (1), a lifetime (persistent versus temporary), a scope (process-instanced, container-instanced, user-instanced, session-instanced, or machine-instanced), a permanent data flag, and, for well-known state names, a prefix identifying the owner of the state name followed by a unique sequence number. Figure 8-41 below shows this format.
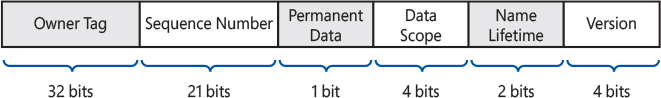
Figure 8-41 Format of a WNF state name.
As mentioned earlier, state names can be well-known, which means that they are preprovisioned for arbitrary out-of-order use. WNF achieves this by using the registry as a backing store, which will encode the security descriptor, maximum data size, and type ID (if any) under the HKLMSYSTEMCurrentControlSetControlNotifications registry key. For each state name, the information is stored under a value matching the 64-bit encoded WNF state name identifier.
Additionally, WNF state names can also be registered as persistent, meaning that they will remain registered for the duration of the system’s uptime, regardless of the registrar’s process lifetime. This mimics permanent objects that were shown in the “Object Manager” section of this chapter, and similarly, the SeCreatePermanentPrivilege privilege is required to register such state names. These WNF state names also live in the registry, but under the HKLMSOFTWAREMicrosoftWindows NTCurrentVersionVolatileNotifications key, and take advantage of the registry’s volatile flag to simply disappear once the machine is rebooted. You might be confused to see “volatile” registry keys being used for “persistent” WNF data—keep in mind that, as we just indicated, the persistence here is within a boot session (versus attached to process lifetime, which is what WNF calls temporary, and which we’ll see later).
Furthermore, a WNF state name can be registered as permanent, which endows it with the ability to persist even across reboots. This is the type of “persistence” you may have been expecting earlier. This is done by using yet another registry key, this time without the volatile flag set, present at HKLMSOFTWAREMicrosoftWindows NTCurrentVersionNotifications. Suffice it to say, the SeCreatePermanentPrivilege is needed for this level of persistence as well. For these types of WNF states, there is an additional registry key found below the hierarchy, called Data, which contains, for each 64-bit encoded WNF state name identifier, the last change stamp, and the binary data. Note that if the WNF state name was never written to on your machine, the latter information might be missing.

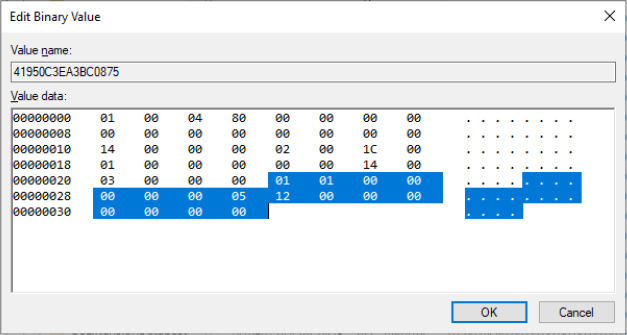
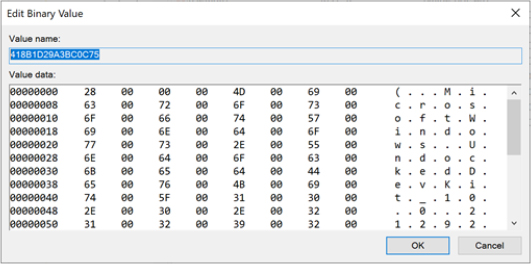
Finally, a completely arbitrary state name can be registered as a temporary name. Such names have a few distinctions from what was shown so far. First, because their names are not known in advance, they do require the consumers and producers to have some way of passing the identifier between each other. Normally, whoever either attempts to consume the state data first or to produce state data instead ends up internally creating and/or using the matching registry key to store the data. However, with temporary WNF state names, this isn’t possible because the name is based on a monotonically increasing sequence number.
Second, and related to this fact, no registry keys are used to encode temporary state names—they are tied to the process that registered a given instance of a state name, and all the data is stored in kernel pool only. These types of names, for example, are used to implement the per-process wake channels described earlier. Other uses include power manager notifications, and direct service triggers used by the SCM.
WNF publishing and subscription model
When publishers leverage WNF, they do so by following a standard pattern of registering the state name (in the case of non-well-known state names) and publishing some data that they want to expose. They can also choose not to publish any data but simply provide a 0-byte buffer, which serves as a way to “light up” the state and signals the subscribers anyway, even though no data was stored.
Consumers, on the other hand, use WNF’s registration capabilities to associate a callback with a given WNF state name. Whenever a change is published, this callback is activated, and, for kernel mode, the caller is expected to call the appropriate WNF API to retrieve the data associated with the state name. (The buffer size is provided, allowing the caller to allocate some pool, if needed, or perhaps choose to use the stack.) For user mode, on the other hand, the underlying WNF notification mechanism inside of Ntdll.dll takes care of allocating a heap-backed buffer and providing a pointer to this data directly to the callback registered by the subscriber.
In both cases, the callback also provides the change stamp, which acts as a unique monotonic sequence number that can be used to detect missed published data (if a subscriber was inactive, for some reason, and the publisher continued to produce changes). Additionally, a custom context can be associated with the callback, which is useful in C++ situations to tie the static function pointer to its class.
![]() Note
Note
WNF provides an API for querying whether a given WNF state name has been registered yet (allowing a consumer to implement special logic if it detects the producer must not yet be active), as well as an API for querying whether there are any subscriptions currently active for a given state name (allowing a publisher to implement special logic such as perhaps delaying additional data publication, which would override the previous state data).
WNF manages what might be thousands of subscriptions by associating a data structure with each kernel and/or user-mode subscription and tying all the subscriptions for a given WNF state name together. This way, when a state name is published to, the list of subscriptions is parsed, and, for user mode, a delivery payload is added to a linked list followed by the signaling of a per-process notification event—this instructs the WNF delivery code in Ntdll.dll to call the API to consume the payload (and any other additional delivery payloads that were added to the list in the meantime). For kernel mode, the mechanism is simpler—the callback is synchronously executed in the context of the publisher.
Note that it’s also possible to subscribe to notifications in two modes: data-notification mode, and meta-notification mode. The former does what one might expect—executing the callback when new data has been associated with a WNF state name. The latter is more interesting because it sends notifications when a new consumer has become active or inactive, as well as when a publisher has terminated (in the case of a volatile state name, where such a concept exists).
Finally, it’s worth pointing out that user-mode subscriptions have an additional wrinkle: Because Ntdll.dll manages the WNF notifications for the entire process, it’s possible for multiple components (such as dynamic libraries/DLLs) to have requested their own callback for the same WNF state name (but for different reasons and with different contexts). In this situation, the Ntdll.dll library needs to associate registration contexts with each module, so that the per-process delivery payload can be translated into the appropriate callback and only delivered if the requested delivery mode matches the notification type of the subscriber.
WNF event aggregation
Although WNF on its own provides a powerful way for clients and services to exchange state information and be notified of each other’s statuses, there may be situations where a given client/subscriber is interested in more than a single WNF state name.
For example, there may be a WNF state name that is published whenever the screen backlight is off, another when the wireless card is powered off, and yet another when the user is no longer physically present. A subscriber may want to be notified when all of these WNF state names have been published—yet another may require a notification when either the first two or the latter has been published.
Unfortunately, the WNF system calls and infrastructure provided by Ntdll.dll to user-mode clients (and equally, the API surface provided by the kernel) only operate on single WNF state names. Therefore, the kinds of examples given would require manual handling through a state machine that each subscriber would need to implement.
To facilitate this common requirement, a component exists both in user mode as well as in kernel mode that handles the complexity of such a state machine and exposes a simple API: the Common Event Aggregator (CEA) implemented in CEA.SYS for kernel-mode callers and EventAggregation.dll for user-mode callers. These libraries export a set of APIs (such as EaCreateAggregatedEvent and EaSignalAggregatedEvent), which allow an interrupt-type behavior (a start callback while a WNF state is true, and a stop callback once the WNF state if false) as well as the combination of conditions with operators such as AND, OR, and NOT.
Users of CEA include the USB Stack as well as the Windows Driver Foundation (WDF), which exposes a framework callback for WNF state name changes. Further, the Power Delivery Coordinator (Pdc.sys) uses CEA to build power state machines like the example at the beginning of this subsection. The Unified Background Process Manager (UBPM) described in Chapter 9 also relies on CEA to implement capabilities such as starting and stopping services based on low power and/or idle conditions.
Finally, WNF is also integral to a service called the System Event Broker (SEB), implemented in SystemEventsBroker.dll and whose client library lives in SystemEventsBrokerClient.dll. The latter exports APIs such as SebRegisterPrivateEvent, SebQueryEventData, and SebSignalEvent, which are then passed through an RPC interface to the service. In user mode, SEB is a cornerstone of the Universal Windows Platform (UWP) and the various APIs that interrogate system state, and services that trigger themselves based on certain state changes that WNF exposes. Especially on OneCore-derived systems such as Windows Phone and XBOX (which, as was shown earlier, make up more than a few hundred of the well-known WNF state names), SEB is a central powerhouse of system notification capabilities, replacing the legacy role that the Window Manager provided through messages such as WM_DEVICEARRIVAL, WM_SESSIONENDCHANGE, WM_POWER, and others.
SEB pipes into the Broker Infrastructure (BI) used by UWP applications and allows applications, even when running under an AppContainer, to access WNF events that map to systemwide state. In turn, for WinRT applications, the Windows.ApplicationModel.Background namespace exposes a SystemTrigger class, which implements IBackgroundTrigger, that pipes into the SEB’s RPC services and C++ API, for certain well-known system events, which ultimately transforms to WNF_SEB_XXX event state names. It serves as a perfect example of how something highly undocumented and internal, such as WNF, can ultimately be at the heart of a high-level documented API for Modern UWP application development. SEB is only one of the many brokers that UWP exposes, and at the end of the chapter, we cover background tasks and the Broker Infrastructure in full detail.
User-mode debugging
Support for user-mode debugging is split into three different modules. The first one is located in the executive itself and has the prefix Dbgk, which stands for Debugging Framework. It provides the necessary internal functions for registering and listening for debug events, managing the debug object, and packaging the information for consumption by its user-mode counterpart. The user-mode component that talks directly to Dbgk is located in the native system library, Ntdll.dll, under a set of APIs that begin with the prefix DbgUi. These APIs are responsible for wrapping the underlying debug object implementation (which is opaque), and they allow all subsystem applications to use debugging by wrapping their own APIs around the DbgUi implementation. Finally, the third component in user-mode debugging belongs to the subsystem DLLs. It is the exposed, documented API (located in KernelBase.dll for the Windows subsystem) that each subsystem supports for performing debugging of other applications.
Kernel support
The kernel supports user-mode debugging through an object mentioned earlier: the debug object. It provides a series of system calls, most of which map directly to the Windows debugging API, typically accessed through the DbgUi layer first. The debug object itself is a simple construct, composed of a series of flags that determine state, an event to notify any waiters that debugger events are present, a doubly linked list of debug events waiting to be processed, and a fast mutex used for locking the object. This is all the information that the kernel requires for successfully receiving and sending debugger events, and each debugged process has a debug port member in its executive process structure pointing to this debug object.
Once a process has an associated debug port, the events described in Table 8-32 can cause a debug event to be inserted into the list of events.
Table 8-32 Kernel-mode debugging events
Event Identifier |
Meaning |
Triggered By |
|---|---|---|
DbgKmExceptionApi |
An exception has occurred. |
KiDispatchException during an exception that occurred in user mode. |
DbgKmCreateThreadApi |
A new thread has been created. |
Startup of a user-mode thread. |
DbgKmCreateProcessApi |
A new process has been created. |
Startup of a user-mode thread that is the first thread in the process, if the CreateReported flag is not already set in EPROCESS. |
DbgKmExitThreadApi |
A thread has exited. |
Death of a user-mode thread, if the ThreadInserted flag is set in ETHREAD. |
DbgKmExitProcessApi |
A process has exited. |
Death of a user-mode thread that was the last thread in the process, if the ThreadInserted flag is set in ETHREAD. |
DbgKmLoadDllApi |
A DLL was loaded. |
NtMapViewOfSection when the section is an image file (could be an EXE as well), if the SuppressDebugMsg flag is not set in the TEB. |
DbgKmUnloadDllApi |
A DLL was unloaded. |
NtUnmapViewOfSection when the section is an image file (could be an EXE as well), if the SuppressDebugMsg flag is not set in the TEB. |
DbgKmErrorReportApi |
A user-mode exception must be forwarded to WER. |
This special case message is sent over ALPC, not the debug object, if the DbgKmExceptionApi message returned DBG_EXCEPTION_NOT_HANDLED, so that WER can now take over exception processing. |
Apart from the causes mentioned in the table, there are a couple of special triggering cases outside the regular scenarios that occur at the time a debugger object first becomes associated with a process. The first create process and create thread messages will be manually sent when the debugger is attached, first for the process itself and its main thread and followed by create thread messages for all the other threads in the process. Finally, load dll events for the executable being debugged, starting with Ntdll.dll and then all the current DLLs loaded in the debugged process will be sent. Similarly, if a debugger is already attached, but a cloned process (fork) is created, the same events will also be sent for the first thread in the clone (as instead of just Ntdll.dll, all other DLLs are also present in the cloned address space).
There also exists a special flag that can be set on a thread, either during creation or dynamically, called hide from debugger. When this flag is turned on, which results in the HideFromDebugger flag in the TEB to be set, all operations done by the current thread, even if the debug port has a debug port, will not result in a debugger message.
Once a debugger object has been associated with a process, the process enters the deep freeze state that is also used for UWP applications. As a reminder, this suspends all threads and prevents any new remote thread creation. At this point, it is the debugger’s responsibility to start requesting that debug events be sent through. Debuggers usually request that debug events be sent back to user mode by performing a wait on the debug object. This call loops the list of debug events. As each request is removed from the list, its contents are converted from the internal DBGK structure to the native structure that the next layer up understands. As you’ll see, this structure is different from the Win32 structure as well, and another layer of conversion has to occur. Even after all pending debug messages have been processed by the debugger, the kernel does not automatically resume the process. It is the debugger’s responsibility to call the ContinueDebugEvent function to resume execution.
Apart from some more complex handling of certain multithreading issues, the basic model for the framework is a simple matter of producers—code in the kernel that generates the debug events in the previous table—and consumers—the debugger waiting on these events and acknowledging their receipt.
Native support
Although the basic protocol for user-mode debugging is quite simple, it’s not directly usable by Windows applications—instead, it’s wrapped by the DbgUi functions in Ntdll.dll. This abstraction is required to allow native applications, as well as different subsystems, to use these routines (because code inside Ntdll.dll has no dependencies). The functions that this component provides are mostly analogous to the Windows API functions and related system calls. Internally, the code also provides the functionality required to create a debug object associated with the thread. The handle to a debug object that is created is never exposed. It is saved instead in the thread environment block (TEB) of the debugger thread that performs the attachment. (For more information on the TEB, see Chapter 4 of Part 1.) This value is saved in the DbgSsReserved[1] field.
When a debugger attaches to a process, it expects the process to be broken into—that is, an int 3 (breakpoint) operation should have happened, generated by a thread injected into the process. If this didn’t happen, the debugger would never actually be able to take control of the process and would merely see debug events flying by. Ntdll.dll is responsible for creating and injecting that thread into the target process. Note that this thread is created with a special flag, which the kernel sets on the TEB, which results in the SkipThreadAttach flag to be set, avoiding DLL_THREAD_ATTACH notifications and TLS slot usage, which could cause unwanted side effects each time a debugger would break into the process.
Finally, Ntdll.dll also provides APIs to convert the native structure for debug events into the structure that the Windows API understands. This is done by following the conversions in Table 8-33.
Table 8-33 Native to Win32 conversions
Native State Change |
Win32 State Change |
Details |
|---|---|---|
DbgCreateThreadStateChange |
CREATE_THREAD_DEBUG_EVENT |
|
DbgCreateProcessStateChange |
CREATE_PROCESS_DEBUG_EVENT |
lpImageName is always NULL, and fUnicode is always TRUE. |
DbgExitThreadStateChange |
EXIT_THREAD_DEBUG_EVENT |
|
DbgExitProcessStateChange |
EXIT_PROCESS_DEBUG_EVENT |
|
DbgExceptionStateChange DbgBreakpointStateChange DbgSingleStepStateChange |
OUTPUT_DEBUG_STRING_EVENT, RIP_EVENT, or EXCEPTION_DEBUG_EVENT |
Determination is based on the Exception Code (which can be DBG_PRINTEXCEPTION_C / DBG_PRINTEXCEPTION_WIDE_C, DBG_RIPEXCEPTION, or something else). |
DbgLoadDllStateChange |
LOAD_DLL_DEBUG_EVENT |
fUnicode is always TRUE |
DbgUnloadDllStateChange |
UNLOAD_DLL_DEBUG_EVENT |
Run WinDbg, and then click File, Open Executable.
Navigate to the WindowsSystem32 directory and choose Notepad.exe.
You’re not going to do any debugging, so simply ignore whatever might come up. You can type g in the command window to instruct WinDbg to continue executing Notepad.

ERROR: WaitForEvent failed, NTSTATUS 0xC0000354
This usually indicates that the debuggee has been
killed out from underneath the debugger.
You can use .tlist to see if the debuggee still exists.
As you can see, the native DbgUi interface doesn’t do much work to support the framework except for this abstraction. The most complicated task it does is the conversion between native and Win32 debugger structures. This involves several additional changes to the structures.
Windows subsystem support
The final component responsible for allowing debuggers such as Microsoft Visual Studio or WinDbg to debug user-mode applications is in KernelBase.dll. It provides the documented Windows APIs. Apart from this trivial conversion of one function name to another, there is one important management job that this side of the debugging infrastructure is responsible for: managing the duplicated file and thread handles.
Recall that each time a load DLL event is sent, a handle to the image file is duplicated by the kernel and handed off in the event structure, as is the case with the handle to the process executable during the create process event. During each wait call, KernelBase.dll checks whether this is an event that results in a new duplicated process and/or thread handles from the kernel (the two create events). If so, it allocates a structure in which it stores the process ID, thread ID, and the thread and/or process handle associated with the event. This structure is linked into the first DbgSsReserved array index in the TEB, where we mentioned the debug object handle is stored. Likewise, KernelBase.dll also checks for exit events. When it detects such an event, it “marks” the handles in the data structure.
Once the debugger is finished using the handles and performs the continue call, KernelBase.dll parses these structures, looks for any handles whose threads have exited, and closes the handles for the debugger. Otherwise, those threads and processes would never exit because there would always be open handles to them if the debugger were running.
Packaged applications
Starting with Windows 8, there was a need for some APIs that run on different kind of devices, from a mobile phone, up to an Xbox and to a fully-fledged personal computer. Windows was indeed starting to be designed even for new device types, which use different platforms and CPU architectures (ARM is a good example). A new platform-agnostic application architecture, Windows Runtime (also known as “WinRT”) was first introduced in Windows 8. WinRT supported development in C++, JavaScript, and managed languages (C#, VB.Net, and so on), was based on COM, and supported natively both x86, AMD64, and ARM processors. Universal Windows Platform (UWP) is the evolution of WinRT. It has been designed to overcome some limitations of WinRT and it is built on the top of it. UWP applications no longer need to indicate which OS version has been developed for in their manifest, but instead they target one or more device families.
UWP provides Universal Device Family APIs, which are guaranteed to be present in all device families, and Extension APIs, which are device specific. A developer can target one device type, adding the extension SDK in its manifest; furthermore, she can conditionally test the presence of an API at runtime and adapt the app’s behavior accordingly. In this way, a UWP app running on a smartphone may start behaving the way it would if it were running on a PC when the phone is connected to a desktop computer or a suitable docking station.
UWP provides multiple services to its apps:
■ Adaptive controls and input—the graphical elements respond to the size and DPI of the screen by adjusting their layout and scale. Furthermore, the input handling is abstracted to the underlying app. This means that a UWP app works well on different screens and with different kinds of input devices, like touch, a pen, a mouse, keyboard, or an Xbox controller
■ One centralized store for every UWP app, which provides a seamless install, uninstall, and upgrade experience
■ A unified design system, called Fluent (integrated in Visual Studio)
■ A sandbox environment, which is called AppContainer
AppContainers were originally designed for WinRT and are still used for UWP applications. We already covered the security aspects of AppContainers in Chapter 7 of Part 1.
To properly execute and manage UWP applications, a new application model has been built in Windows, which is internally called AppModel and stands for “Modern Application Model.” The Modern Application Model has evolved and has been changed multiple times during each release of the OS. In this book, we analyze the Windows 10 Modern Application Model. Multiple components are part of the new model and cooperate to correctly manage the states of the packaged application and its background activities in an energy-efficient manner.
■ Host Activity Manager (HAM) The Host activity manager is a new component, introduced in Windows 10, which replaces and integrates many of the old components that control the life (and the states) of a UWP application (Process Lifetime Manager, Foreground Manager, Resource Policy, and Resource Manager). The Host Activity Manager lives in the Background Task Infrastructure service (BrokerInfrastructure), not to be confused with the Background Broker Infrastructure component, and works deeply tied to the Process State Manager. It is implemented in two different libraries, which represent the client (Rmclient.dll) and server (PsmServiceExtHost.dll) interface.
■ Process State Manager (PSM) PSM has been partly replaced by HAM and is considered part of the latter (actually PSM became a HAM client). It maintains and stores the state of each host of the packaged application. It is implemented in the same service of the HAM (BrokerInfrastructure), but in a different DLL: Psmsrv.dll.
■ Application Activation Manager (AAM) AAM is the component responsible in the different kinds and types of activation of a packaged application. It is implemented in the ActivationManager.dll library, which lives in the User Manager service. Application Activation Manager is a HAM client.
■ View Manager (VM) VM detects and manages UWP user interface events and activities and talks with HAM to keep the UI application in the foreground and in a nonsuspended state. Furthermore, VM helps HAM in detecting when a UWP application goes into background state. View Manager is implemented in the CoreUiComponents.dll .Net managed library, which depends on the Modern Execution Manager client interface (ExecModelClient.dll) to properly register with HAM. Both libraries live in the User Manager service, which runs in a Sihost process (the service needs to proper manage UI events)
■ Background Broker Infrastructure (BI) BI manages the applications background tasks, their execution policies, and events. The core server is implemented mainly in the bisrv.dll library, manages the events that the brokers generate, and evaluates the policies used to decide whether to run a background task. The Background Broker Infrastructure lives in the BrokerInfrastructure service and, at the time of this writing, is not used for Centennial applications.
There are some other minor components that compose the new application model that we have not mentioned here and are beyond the scope of this book.
With the goal of being able to run even standard Win32 applications on secure devices like Windows 10 S, and to enable the conversion of old application to the new model, Microsoft has designed the Desktop Bridge (internally called Centennial). The bridge is available to developers through Visual Studio or the Desktop App Converter. Running a Win32 application in an AppContainer, even if possible, is not recommended, simply because the standard Win32 applications are designed to access a wider system API surface, which is much reduced in AppContainers.
UWP applications
We already covered an introduction of UWP applications and described the security environment in which they run in Chapter 7 of Part 1. To better understand the concepts expressed in this chapter, it is useful to define some basic properties of the modern UWP applications. Windows 8 introduced significant new properties for processes:
■ Package identity
■ Application identity
■ AppContainer
■ Modern UI
We have already extensively analyzed the AppContainer (see Chapter 7 in Part 1). When the user downloads a modern UWP application, the application usually came encapsulated in an AppX package. A package can contain different applications that are published by the same author and are linked together. A package identity is a logical construct that uniquely defines a package. It is composed of five parts: name, version, architecture, resource id, and publisher. The package identity can be represented in two ways: by using a Package Full Name (formerly known as Package Moniker), which is a string composed of all the single parts of the package identity, concatenated by an underscore character; or by using a Package Family name, which is another string containing the package name and publisher. The publisher is represented in both cases by using a Base32-encoded string of the full publisher name. In the UWP world, the terms “Package ID” and “Package full name” are equivalent. For example, the Adobe Photoshop package is distributed with the following full name:
AdobeSystemsIncorporated.AdobePhotoshopExpress_2.6.235.0_neutral_split.scale-125_ynb6jyjzte8ga, where
■ AdobeSystemsIncorporated.AdobePhotoshopExpress is the name of the package.
■ 2.6.235.0 is the version.
■ neutral is the targeting architecture.
■ split_scale is the resource id.
■ ynb6jyjzte8ga is the base32 encoding (Crockford’s variant, which excludes the letters i, l, u, and o to avoid confusion with digits) of the publisher.
Its package family name is the simpler “AdobeSystemsIncorporated.AdobePhotoshopExpress_ynb6jyjzte8ga” string.
Every application that composes the package is represented by an application identity. An application identity uniquely identifies the collection of windows, processes, shortcuts, icons, and functionality that form a single user-facing program, regardless of its actual implementation (so this means that in the UWP world, a single application can be composed of different processes that are still part of the same application identity). The application identity is represented by a simple string (in the UWP world, called Package Relative Application ID, often abbreviated as PRAID). The latter is always combined with the package family name to compose the Application User Model ID (often abbreviated as AUMID). For example, the Windows modern Start menu application has the following AUMID: Microsoft.Windows.ShellExperienceHost_cw5n1h2txyewy!App, where the App part is the PRAID.
Both the package full name and the application identity are located in the WIN://SYSAPPID Security attribute of the token that describes the modern application security context. For an extensive description of the security environment in which the UWP applications run, refer to Chapter 7 in Part 1.
Centennial applications
Starting from Windows 10, the new application model became compatible with standard Win32 applications. The only procedure that the developer needs to do is to run the application installer program with a special Microsoft tool called Desktop App Converter. The Desktop App Converter launches the installer under a sandboxed server Silo (internally called Argon Container) and intercepts all the file system and registry I/O that is needed to create the application package, storing all its files in VFS (virtualized file system) private folders. Entirely describing the Desktop App Converter application is outside the scope of this book. You can find more details of Windows Containers and Silos in Chapter 3 of Part 1.
The Centennial runtime, unlike UWP applications, does not create a sandbox where Centennial processes are run, but only applies a thin virtualization layer on the top of them. As result, compared to standard Win32 programs, Centennial applications don’t have lower security capabilities, nor do they run with a lower integrity-level token. A Centennial application can even be launched under an administrative account. This kind of application runs in application silos (internally called Helium Container), which, with the goal of providing State separation while maintaining compatibility, provides two forms of “jails”: Registry Redirection and Virtual File System (VFS). Figure 8-42 shows an example of a Centennial application: Kali Linux.

Figure 8-42 Kali Linux distributed on the Windows Store is a typical example of Centennial application.
At package activation, the system applies registry redirection to the application and merges the main system hives with the Centennial Application registry hives. Each Centennial application can include three different registry hives when installed in the user workstation: registry.dat, user.dat, and (optionally) userclasses.dat. The registry files generated by the Desktop Convert represent “immutable” hives, which are written at installation time and should not change. At application startup, the Centennial runtime merges the immutable hives with the real system registry hives (actually, the Centennial runtime executes a “detokenizing” procedure because each value stored in the hive contains relative values).
The registry merging and virtualization services are provided by the Virtual Registry Namespace Filter driver (WscVReg), which is integrated in the NT kernel (Configuration Manager). At package activation time, the user mode AppInfo service communicates with the VRegDriver device with the goal of merging and redirecting the registry activity of the Centennial applications. In this model, if the app tries to read a registry value that is present in the virtualized hives, the I/O is actually redirected to the package hives. A write operation to this kind of value is not permitted. If the value does not already exist in the virtualized hive, it is created in the real hive without any kind of redirection at all. A different kind of redirection is instead applied to the entire HKEY_CURRENT_USER root key. In this key, each new subkey or value is stored only in the package hive that is stored in the following path: C:ProgramDataPackages<PackageName><UserSid>SystemAppDataHeliumCache. Table 8-34 shows a summary of the Registry virtualization applied to Centennial applications:
Table 8-34 Registry virtualization applied to Centennial applications
Operation |
Result |
|---|---|
Read or enumeration of HKEY_LOCAL_MACHINESoftware |
The operation returns a dynamic merge of the package hives with the local system counterpart. Registry keys and values that exist in the package hives always have precedence with respect to keys and values that already exist in the local system. |
All writes to HKEY_CURRENT_USER |
Redirected to the Centennial package virtualized hive. |
All writes inside the package |
Writes to HKEY_LOCAL_MACHINESoftware are not allowed if a registry value exists in one of the package hives. |
All writes outside the package |
Writes to HKEY_LOCAL_MACHINESoftware are allowed as long as the value does not already exist in one of the package hives. |
When the Centennial runtime sets up the Silo application container, it walks all the file and directories located into the VFS folder of the package. This procedure is part of the Centennial Virtual File System configuration that the package activation provides. The Centennial runtime includes a list of mapping for each folder located in the VFS directory, as shown in Table 8-35.
Table 8-35 List of system folders that are virtualized for Centennial apps
Folder Name |
Redirection Target |
Architecture |
|---|---|---|
SystemX86 |
C:WindowsSysWOW64 |
32-bit/64-bit |
System |
C:WindowsSystem32 |
32-bit/64-bit |
SystemX64 |
C:WindowsSystem32 |
64-bit only |
ProgramFilesX86 |
C:Program Files (x86) |
32-bit/64-bit |
ProgramFilesX64 |
C:Program Files |
64-bit only |
ProgramFilesCommonX86 |
C:Program Files (x86)Common Files |
32-bit/64-bit |
ProgramFilesCommonX64 |
C:Program FilesCommon Files |
64-bit only |
Windows |
C:Windows |
Neutral |
CommonAppData |
C:ProgramData |
Neutral |
The File System Virtualization is provided by three different drivers, which are heavily used for Argon containers:
■ Windows Bind minifilter driver (BindFlt) Manages the redirection of the Centennial application’s files. This means that if the Centennial app wants to read or write to one of its existing virtualized files, the I/O is redirected to the file’s original position. When the application creates instead a file on one of the virtualized folders (for example, in C:Windows), and the file does not already exist, the operation is allowed (assuming that the user has the needed permissions) and the redirection is not applied.
■ Windows Container Isolation minifilter driver (Wcifs) Responsible for merging the content of different virtualized folders (called layers) and creating a unique view. Centennial applications use this driver to merge the content of the local user’s application data folder (usually C:Users<UserName>AppData) with the app’s application cache folder, located in C:User<UserName>AppdataLocalPackages<Package Full NameLocalCache. The driver is even able to manage the merge of multiple packages, meaning that each package can operate on its own private view of the merged folders. To support this feature, the driver stores a Layer ID of each package in the Reparse point of the target folder. In this way, it can construct a layer map in memory and is able to operate on different private areas (internally called Scratch areas). This advanced feature, at the time of this writing, is configured only for related set, a feature described later in the chapter.
■ Windows Container Name Virtualization minifilter driver (Wcnfs) While Wcifs driver merges multiple folders, Wcnfs is used by Centennial to set up the name redirection of the local user application data folder. Unlike from the previous case, when the app creates a new file or folder in the virtualized application data folder, the file is stored in the application cache folder, and not in the real one, regardless of whether the file already exists.
One important concept to keep in mind is that the BindFlt filter operates on single files, whereas Wcnfs and Wcifs drivers operate on folders. Centennial uses minifilters’ communication ports to correctly set up the virtualized file system infrastructure. The setup process is completed using a message-based communication system (where the Centennial runtime sends a message to the minifilter and waits for its response). Table 8-36 shows a summary of the file system virtualization applied to Centennial applications.
Table 8-36 File system virtualization applied to Centennial applications
Operation |
Result |
|---|---|
Read or enumeration of a well-known Windows folder |
The operation returns a dynamic merge of the corresponding VFS folder with the local system counterpart. File that exists in the VFS folder always had precedence with respect to files that already exist in the local system one. |
Writes on the application data folder |
All the writes on the application data folder are redirected to the local Centennial application cache. |
All writes inside the package folder |
Forbidden, read-only. |
All writes outside the package folder |
Allowed if the user has permission. |
The Host Activity Manager
Windows 10 has unified various components that were interacting with the state of a packaged application in a noncoordinated way. As a result, a brand-new component, called Host Activity Manager (HAM) became the central component and the only one that manages the state of a packaged application and exposes a unified API set to all its clients.
Unlike its predecessors, the Host Activity Manager exposes activity-based interfaces to its clients. A host is the object that represents the smallest unit of isolation recognized by the Application model. Resources, suspend/resume and freeze states, and priorities are managed as a single unit, which usually corresponds to a Windows Job object representing the packaged application. The job object may contain only a single process for simple applications, but it could contain even different processes for applications that have multiple background tasks (such as multimedia players, for example).
In the new Modern Application Model, there are three job types:
■ Mixed A mix of foreground and background activities but typically associated with the foreground part of the application. Applications that include background tasks (like music playing or printing) use this kind of job type.
■ Pure A host that is used for purely background work.
■ System A host that executes Windows code on behalf of the application (for example, background downloads).
An activity always belongs to a host and represents the generic interface for client-specific concepts such as windows, background tasks, task completions, and so on. A host is considered “Active” if its job is unfrozen and it has at least one running activity. The HAM clients are components that interact and control the lifetime of activities. Multiple components are HAM clients: View Manager, Broker Infrastructure, various Shell components (like the Shell Experience Host), AudioSrv, Task completions, and even the Windows Service Control Manager.
The Modern application’s lifecycle consists of four states: running, suspending, suspend-complete, and suspended (states and their interactions are shown in Figure 8-43.)
■ Running The state where an application is executing part of its code, other than when it’s suspending. An application could be in “running” state not only when it is in a foreground state but even when it is running background tasks, playing music, printing, or any number of other background scenarios.
■ Suspending This state represents a time-limited transition state that happens where HAM asks the application to suspend. HAM can do this for different reasons, like when the application loses the foreground focus, when the system has limited resources or is entering a battery-safe mode, or simply because an app is waiting for some UI event. When this happens, an app has a limited amount of time to go to the suspended state (usually 5 seconds maximum); otherwise, it will be terminated.
■ SuspendComplete This state represents an application that has finished suspending and notifies the system that it is done. Therefore, its suspend procedure is considered completed.
■ Suspended Once an app completes suspension and notifies the system, the system freezes the application’s job object using the NtSetInformationJobObject API call (through the JobObjectFreezeInformation information class) and, as a result, none of the app code can run.

Figure 8-43 Scheme of the lifecycle of a packaged application.
With the goal of preserving system efficiency and saving system resources, the Host Activity Manager by default will always require an application to suspend. HAM clients need to require keeping an application alive to HAM. For foreground applications, the component responsible in keeping the app alive is the View Manager. The same applies for background tasks: Broker Infrastructure is the component responsible for determining which process hosting the background activity should remain alive (and will request to HAM to keep the application alive).
Packaged applications do not have a Terminated state. This means that an application does not have a real notion of an Exit or Terminate state and should not try to terminate itself. The actual model for terminating a Packaged application is that first it gets suspended, and then HAM, if required, calls NtTerminateJobObject API on the application’s job object. HAM automatically manages the app lifetime and destroys the process only as needed. HAM does not decide itself to terminate the application; instead, its clients are required to do so (the View Manager or the Application Activation Manager are good examples). A packaged application can’t distinguish whether it has been suspended or terminated. This allows Windows to automatically restore the previous state of the application even if it has been terminated or if the system has been rebooted. As a result, the packaged application model is completely different from the standard Win32 application model.
To properly suspend and resume a Packaged application, the Host Activity manager uses the new PsFreezeProcess and PsThawProcess kernel APIs. The process Freeze and Thaw operations are similar to suspend and resume, with the following two major differences:
■ A new thread that is injected or created in a context of a deep-frozen process will not run even in case the CREATE_SUSPENDED flag is not used at creation time or in case the NtResumeProcess API is called to start the thread.
■ A new Freeze counter is implemented in the EPROCESS data structures. This means that a process could be frozen multiple times. To allow a process to be thawed, the total number of thaw requests must be equal to the number of freeze requests. Only in this case are all the nonsuspended threads allowed to run.
The State Repository
The Modern Application Model introduces a new way for storing packaged applications’ settings, package dependencies, and general application data. The State Repository is the new central store that contains all this kind of data and has an important central rule in the management of all modern applications: Every time an application is downloaded from the store, installed, activated, or removed, new data is read or written to the repository. The classical usage example of the State Repository is represented by the user clicking on a tile in the Start menu. The Start menu resolves the full path of the application’s activation file (which could be an EXE or a DLL, as already seen in Chapter 7 of Part 1), reading from the repository. (This is actually simplified, because the ShellExecutionHost process enumerates all the modern applications at initialization time.)
The State Repository is implemented mainly in two libraries: Windows.StateRepository.dll and Windows.StateRepositoryCore.dll. Although the State Repository Service runs the server part of the repository, UWP applications talk with the repository using the Windows.StateRepositoryClient.dll library. (All the repository APIs are full trust, so WinRT clients need a Proxy to correctly communicate with the server. This is the rule of another DLL, named Windows.StateRepositoryPs.dll.) The root location of the State Repository is stored in the HKLMSOFTWAREMicrosoftWindowsCurrentVersionAppx PackageRepositoryRoot registry value, which usually points to the C:ProgramDataMicrosoftWindows AppRepository path.
The State Repository is implemented across multiple databases, called partitions. Tables in the database are called entities. Partitions have different access and lifetime constraints:
■ Machine This database includes package definitions, an application’s data and identities, and primary and secondary tiles (used in the Start menu), and it is the master registry that defines who can access which package. This data is read extensively by different components (like the TileDataRepository library, which is used by Explorer and the Start menu to manage the different tiles), but it’s written primarily by the AppX deployment (rarely by some other minor components). The Machine partition is usually stored in a file called StateRepository-Machine.srd located into the state repository root folder.
■ Deployment Stores machine-wide data mostly used only by the deployment service (AppxSvc) when a new package is registered or removed from the system. It includes the applications file list and a copy of each modern application’s manifest file. The Deployment partition is usually stored in a file called StateRepository-Deployment.srd.
All partitions are stored as SQLite databases. Windows compiles its own version of SQLite into the StateRepository.Core.dll library. This library exposes the State Repository Data Access Layer (also known as DAL) APIs that are mainly wrappers to the internal database engine and are called by the State Repository service.
Sometimes various components need to know when some data in the State Repository is written or modified. In Windows 10 Anniversary update, the State Repository has been updated to support changes and events tracking. It can manage different scenarios:
■ A component wants to subscribe for data changes for a certain entity. The component receives a callback when the data is changed and implemented using a SQL transaction. Multiple SQL transactions are part of a Deployment operation. At the end of each database transaction, the State Repository determines if a Deployment operation is completed, and, if so, calls each registered listener.
■ A process is started or wakes from Suspend and needs to discover what data has changed since it was last notified or looked at. State Repository could satisfy this request using the ChangeId field, which, in the tables that supports this feature, represents a unique temporal identifier of a record.
■ A process retrieves data from the State Repository and needs to know if the data has changed since it was last examined. Data changes are always recorded in compatible entities via a new table called Changelog. The latter always records the time, the change ID of the event that created the data, and, if applicable, the change ID of the event that deleted the data.
The modern Start menu uses the changes and events tracking feature of the State Repository to work properly. Every time the ShellExperienceHost process starts, it requests the State Repository to notify its controller (NotificationController.dll) every time a tile is modified, created, or removed. When the user installs or removes a modern application through the Store, the application deployment server executes a DB transaction for inserting or removing the tile. The State Repository, at the end of the transaction, signals an event that wakes up the controller. In this way, the Start menu can modify its appearance almost in real time.
![]() Note
Note
In a similar way, the modern Start menu is automatically able to add or remove an entry for every new standard Win32 application installed. The application setup program usually creates one or more shortcuts in one of the classic Start menu folder locations (systemwide path: C:ProgramDataMicrosoft WindowsStart Menu, or per-user path: C:Users<UserName>AppDataRoamingMicrosoftWindowsStart Menu). The modern Start menu uses the services provided by the AppResolver library to register file system notifications on all the Start menu folders (through the ReadDirectoryChangesW Win32 API). In this way, whenever a new shortcut is created in the monitored folders, the library can get a callback and signal the Start menu to redraw itself.
C:WINDOWSsystem32>cd “C:ProgramDataMicrosoftWindowsAppRepository”
C:ProgramDataMicrosoftWindowsAppRepository>copy StateRepository-Machine.srd
"%USERPROFILE%Documents"
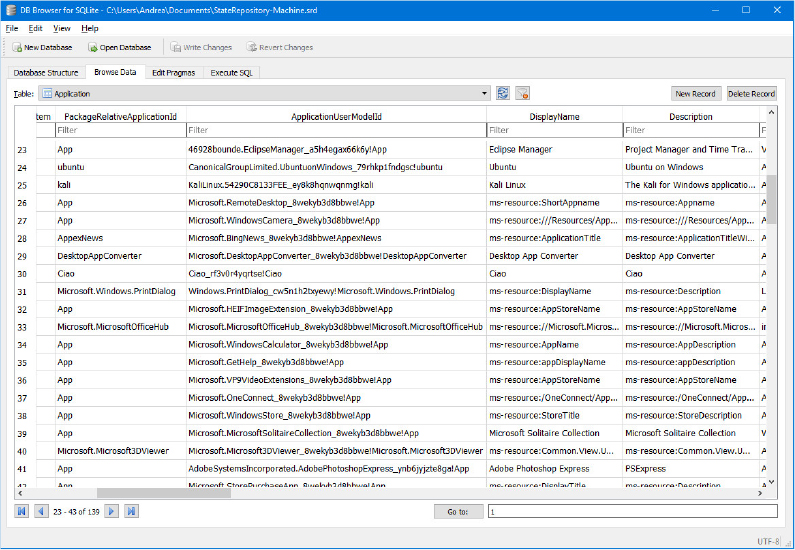
SELECT p.DisplayName, p.PackageFullName, pl.InstalledLocation, a.Executable, pm.Name
FROM Package AS p
INNER JOIN PackageLocation AS pl ON p._PackageID=pl.Package
INNER JOIN PackageFamily AS pm ON p.PackageFamily=pm._PackageFamilyID
INNER JOIN Application AS a ON a.Package=p._PackageID
WHERE pm.PackageFamilyName="<Package Family Name>"
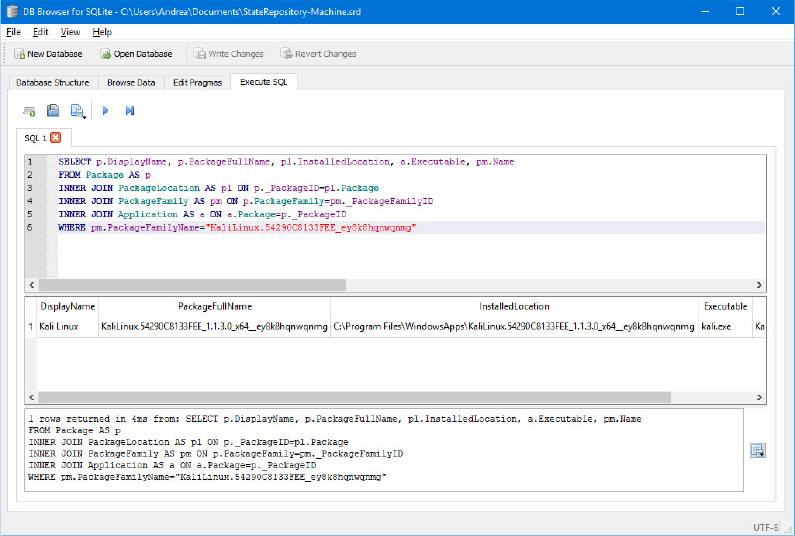
The Dependency Mini Repository
Opening an SQLite database and extracting the needed information through an SQL query could be an expensive operation. Furthermore, the current architecture requires some interprocess communication done through RPC. Those two constraints sometimes are too restrictive to be satisfied. A classic example is represented by a user launching a new application (maybe an Execution Alias) through the command-line console. Checking the State Repository every time the system spawns a process introduces a big performance issue. To fix these problems, the Application Model has introduced another smaller store that contains Modern applications’ information: the Dependency Mini Repository (DMR).
Unlike from the State Repository, the Dependency Mini Repository does not make use of any database but stores the data in a Microsoft-proprietary binary format that can be accessed by any file system in any security context (even a kernel-mode driver could possibly parse the DMR data). The System Metadata directory, which is represented by a folder named Packages in the State Repository root path, contains a list of subfolders, one for every installed package. The Dependency Mini Repository is represented by a .pckgdep file, named as the user’s SID. The DMR file is created by the Deployment service when a package is registered for a user (for further details, see the “Package registration” section later in this chapter).
The Dependency Mini Repository is heavily used when the system creates a process that belongs to a packaged application (in the AppX Pre-CreateProcess extension). Thus, it’s entirely implemented in the Win32 kernelbase.dll (with some stub functions in kernel.appcore.dll). When a DMR file is opened at process creation time, it is read, parsed, and memory-mapped into the parent process. After the child process is created, the loader code maps it even in the child process. The DMR file contains various information, including
■ Package information, like the ID, full name, full path, and publisher
■ Application information: application user model ID and relative ID, description, display name, and graphical logos
■ Security context: AppContainer SID and capabilities
■ Target platform and the package dependencies graph (used in case a package depends on one or more others)
The DMR file is designed to contain even additional data in future Windows versions, if required. Using the Dependency Mini Repository file, the process creation is fast enough and does not require a query into the State Repository. Noteworthy is that the DMR file is closed after the process creation. So, it is possible to rewrite the .pckgdep file, adding an optional package even when the Modern application is executing. In this way, the user can add a feature to its modern application without restarting it. Some small parts of the package mini repository (mostly only the package full name and path) are replicated into different registry keys as cache for a faster access. The cache is often used for common operations (like understanding if a package exists).
Background tasks and the Broker Infrastructure
UWP applications usually need a way to run part of their code in the background. This code doesn’t need to interact with the main foreground process. UWP supports background tasks, which provide functionality to the application even when the main process is suspended or not running. There are multiple reasons why an application may use background tasks: real-time communications, mails, IM, multimedia music, video player, and so on. A background task could be associated by triggers and conditions. A trigger is a global system asynchronous event that, when it happens, signals the starting of a background task. The background task at this point may or may be not started based on its applied conditions. For example, a background task used in an IM application could start only when the user logs on (a system event trigger) and only if the Internet connection is available (a condition).
In Windows 10, there are two types of background tasks:
■ In-process background task The application code and its background task run in the same process. From a developer’s point of view, this kind of background task is easier to implement, but it has the big drawback that if a bug hits its code, the entire application crashes. The in-process background task doesn’t support all triggers available for the out-of-process background tasks.
■ Out-of-process background task The application code and its background task run in different processes (the process could run in a different job object, too). This type of background task is more resilient, runs in the backgroundtaskhost.exe host process, and can use all the triggers and the conditions. If a bug hits the background task, this will never kill the entire application. The main drawback is originated from the performance of all the RPC code that needs to be executed for the interprocess communication between different processes.
To provide the best user experience for the user, all background tasks have an execution time limit of 30 seconds total. After 25 seconds, the Background Broker Infrastructure service calls the task’s Cancellation handler (in WinRT, this is called OnCanceled event). When this event happens, the background task still has 5 seconds to completely clean up and exit. Otherwise, the process that contains the Background Task code (which could be BackgroundTaskHost.exe in case of out-of-process tasks; otherwise, it’s the application process) is terminated. Developers of personal or business UWP applications can remove this limit, but such an application could not be published in the official Microsoft Store.
The Background Broker Infrastructure (BI) is the central component that manages all the Background tasks. The component is implemented mainly in bisrv.dll (the server side), which lives in the Broker Infrastructure service. Two types of clients can use the services provided by the Background Broker Infrastructure: Standard Win32 applications and services can import the bi.dll Background Broker Infrastructure client library; WinRT applications always link to biwinrt.dll, the library that provides WinRT APIs to modern applications. The Background Broker Infrastructure could not exist without the brokers. The brokers are the components that generate the events that are consumed by the Background Broker Server. There are multiple kinds of brokers. The most important are the following:
■ System Event Broker Provides triggers for system events like network connections’ state changes, user logon and logoff, system battery state changes, and so on
■ Time Broker Provides repetitive or one-shot timer support
■ Network Connection Broker Provides a way for the UWP applications to get an event when a connection is established on certain ports
■ Device Services Broker Provides device arrivals triggers (when a user connects or disconnects a device). Works by listening Pnp events originated from the kernel
■ Mobile Broad Band Experience Broker Provides all the critical triggers for phones and SIMs
The server part of a broker is implemented as a windows service. The implementation is different for every broker. Most work by subscribing to WNF states (see the “Windows Notification Facility” section earlier in this chapter for more details) that are published by the Windows kernel; others are built on top of standard Win32 APIs (like the Time Broker). Covering the implementation details of all the brokers is outside the scope of this book. A broker can simply forward events that are generated somewhere else (like in the Windows kernel) or can generates new events based on some other conditions and states. Brokers forward events that they managed through WNF: each broker creates a WNF state name that the background infrastructure subscribes to. In this way, when the broker publishes new state data, the Broker Infrastructure, which is listening, wakes up and forwards the event to its clients.
Each broker includes even the client infrastructure: a WinRT and a Win32 library. The Background Broker Infrastructure and its brokers expose three kinds of APIs to its clients:
■ Non-trust APIs Usually used by WinRT components that run under AppContainer or in a sandbox environment. Supplementary security checks are made. The callers of this kind of API can’t specify a different package name or operate on behalf of another user (that is, BiRtCreateEventForApp).
■ Partial-trust APIs Used by Win32 components that live in a Medium-IL environment. Callers of this kind of API can specify a Modern application’s package full name but can’t operate on behalf of another user (that is, BiPtCreateEventForApp).
■ Full-trust API Used only by high-privileged system or administrative Win32 services. Callers of these APIs can operate on behalf of different users and on different packages (that is, BiCreateEventForPackageName).
Clients of the brokers can decide whether to subscribe directly to an event provided by the specific broker or subscribe to the Background Broker Infrastructure. WinRT always uses the latter method. Figure 8-44 shows an example of initialization of a Time trigger for a Modern Application Background task.
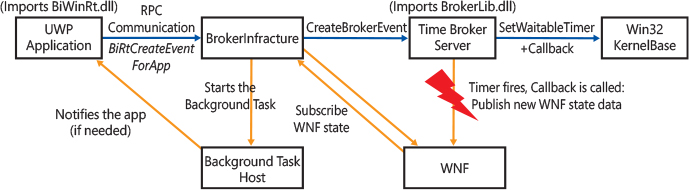
Figure 8-44 Architecture of the Time Broker.
Another important service that the Background Broker Infrastructure provides to the Brokers and to its clients is the storage capability for background tasks. This means that when the user shuts down and then restarts the system, all the registered background tasks are restored and rescheduled as before the system was restarted. To achieve this properly, when the system boots and the Service Control Manager (for more information about the Service Control Manager, refer to Chapter 10) starts the Broker Infrastructure service, the latter, as a part of its initialization, allocates a root storage GUID, and, using NtLoadKeyEx native API, loads a private copy of the Background Broker registry hive. The service tells NT kernel to load a private copy of the hive using a special flag (REG_APP_HIVE). The BI hive resides in the C:WindowsSystem32ConfigBBI file. The root key of the hive is mounted as RegistryA<Root Storage GUID> and is accessible only to the Broker Infrastructure service’s process (svchost.exe, in this case; Broker Infrastructure runs in a shared service host). The Broker Infrastructure hive contains a list of events and work items, which are ordered and identified using GUIDs:
■ An event represents a Background task’s trigger It is associated with a broker ID (which represents the broker that provides the event type), the package full name, and the user of the UWP application that it is associated with, and some other parameters.
■ A work item represents a scheduled Background task It contains a name, a list of conditions, the task entry point, and the associated trigger event GUID.
The BI service enumerates each subkey and then restores all the triggers and background tasks. It cleans orphaned events (the ones that are not associated with any work items). It then finally publishes a WNF ready state name. In this way, all the brokers can wake up and finish their initialization.
The Background Broker Infrastructure is deeply used by UWP applications. Even regular Win32 applications and services can make use of BI and brokers, through their Win32 client libraries. Some notable examples are provided by the Task Scheduler service, Background Intelligent Transfer service, Windows Push Notification service, and AppReadiness.
Packaged applications setup and startup
Packaged application lifetime is different than standard Win32 applications. In the Win32 world, the setup procedure for an application can vary from just copying and pasting an executable file to executing complex installation programs. Even if launching an application is just a matter of running an executable file, the Windows loader takes care of all the work. The setup of a Modern application is instead a well-defined procedure that passes mainly through the Windows Store. In Developer mode, an administrator is even able to install a Modern application from an external .Appx file. The package file needs to be digitally signed, though. This package registration procedure is complex and involves multiple components.
Before digging into package registration, it’s important to understand another key concept that belongs to Modern applications: package activation. Package activation is the process of launching a Modern application, which can or cannot show a GUI to the user. This process is different based on the type of Modern application and involves various system components.
Package activation
A user is not able to launch a UWP application by just executing its .exe file (excluding the case of the new AppExecution aliases, created just for this reason. We describe AppExecution aliases later in this chapter). To correctly activate a Modern application, the user needs to click a tile in the modern menu, use a special link file that Explorer is able to parse, or use some other activation points (double-click an application’s document, invoke a special URL, and so on). The ShellExperienceHost process decides which activation performs based on the application type.
UWP applications
The main component that manages this kind of activation is the Activation Manager, which is implemented in ActivationManager.dll and runs in a sihost.exe service because it needs to interact with the user’s desktop. The activation manager strictly cooperates with the View Manager. The modern menu calls into the Activation Manager through RPC. The latter starts the activation procedure, which is schematized in Figure 8-45:
■ Gets the SID of the user that is requiring the activation, the package family ID, and PRAID of the package. In this way, it can verify that the package is actually registered in the system (using the Dependency Mini Repository and its registry cache).
■ If the previous check yields that the package needs to be registered, it calls into the AppX Deployment client and starts the package registration. A package might need to be registered in case of “on-demand registration,” meaning that the application is downloaded but not completely installed (this saves time, especially in enterprise environments) or in case the application needs to be updated. The Activation Manager knows if one of the two cases happens thanks to the State Repository.
■ It registers the application with HAM and creates the HAM host for the new package and its initial activity.
■ Activation Manager talks with the View Manager (through RPC), with the goal of initializing the GUI activation of the new session (even in case of background activations, the View Manager always needs to be informed).
■ The activation continues in the DcomLaunch service because the Activation Manager at this stage uses a WinRT class to launch the low-level process creation.
■ The DcomLaunch service is responsible in launching COM, DCOM, and WinRT servers in response to object activation requests and is implemented in the rpcss.dll library. DcomLaunch captures the activation request and prepares to call the CreateProcessAsUser Win32 API. Before doing this, it needs to set the proper process attributes (like the package full name), ensure that the user has the proper license for launching the application, duplicate the user token, set the low integrity level to the new one, and stamp it with the needed security attributes. (Note that the DcomLaunch service runs under a System account, which has TCB privilege. This kind of token manipulation requires TCB privilege. See Chapter 7 of Part 1 for further details.) At this point, DcomLaunch calls CreateProcessAsUser, passing the package full name through one of the process attributes. This creates a suspended process.
■ The rest of the activation process continues in Kernelbase.dll. The token produced by DcomLaunch is still not an AppContainer but contains the UWP Security attributes. A Special code in the CreateProcessInternal function uses the registry cache of the Dependency Mini Repository to gather the following information about the packaged application: Root Folder, Package State, AppContainer package SID, and list of application’s capabilities. It then verifies that the license has not been tampered with (a feature used extensively by games). At this point, the Dependency Mini Repository file is mapped into the parent process, and the UWP application DLL alternate load path is resolved.
■ The AppContainer token, its object namespace, and symbolic links are created with the BasepCreateLowBox function, which performs the majority of the work in user mode, except for the actual AppContainer token creation, which is performed using the NtCreateLowBoxToken kernel function. We have already covered AppContainer tokens in Chapter 7 of Part 1.
■ The kernel process object is created as usual by using NtCreateUserProcess kernel API.
■ After the CSRSS subsystem has been informed, the BasepPostSuccessAppXExtension function maps the Dependency Mini Repository in the PEB of the child process and unmaps it from the parent process. The new process can then be finally started by resuming its main thread.

Figure 8-45 Scheme of the activation of a modern UWP application.
Centennial applications
The Centennial applications activation process is similar to the UWP activation but is implemented in a totally different way. The modern menu, ShellExperienceHost, always calls into Explorer.exe for this kind of activation. Multiple libraries are involved in the Centennial activation type and mapped in Explorer, like Daxexec.dll, Twinui.dll, and Windows.Storage.dll. When Explorer receives the activation request, it gets the package full name and application id, and, through RPC, grabs the main application executable path and the package properties from the State Repository. It then executes the same steps (2 through 4) as for UWP activations. The main difference is that, instead of using the DcomLaunch service, Centennial activation, at this stage, it launches the process using the ShellExecute API of the Shell32 library. ShellExecute code has been updated to recognize Centennial applications and to use a special activation procedure located in Windows.Storage.dll (through COM). The latter library uses RPC to call the RAiLaunchProcessWithIdentity function located in the AppInfo service. AppInfo uses the State Repository to verify the license of the application, the integrity of all its files, and the calling process’s token. It then stamps the token with the needed security attributes and finally creates the process in a suspended state. AppInfo passes the package full name to the CreateProcessAsUser API using the PROC_THREAD_ATTRIBUTE_PACKAGE_FULL_NAME process attribute.
Unlike the UWP activation, no AppContainer is created at all, AppInfo calls the PostCreateProcess DesktopAppXActivation function of DaxExec.dll, with the goal of initializing the virtualization layer of Centennial applications (registry and file system). Refer to the “Centennial application” section earlier in this chapter for further information.
wmic process where "name=’WindowsCamera.exe’" get ExecutablePath
wmic process where "name=’notepad++.exe’" get ExecutablePath
mklink "%USERPROFILE%Desktop
otepad.exe" "<Notepad++ executable Full Path>"
mklink "%USERPROFILE%Desktopcamera.exe" "<WindowsCamera executable full path>

![]() Note
Note
Starting with Windows 10 Creators Update (RS2), the Modern Application Model supports the concept of Optional packages (internally called RelatedSet). Optional packages are heavily used in games, where the main game supports even DLC (or expansions), and in packages that represent suites: Microsoft Office is a good example. A user can download and install Word and implicitly the framework package that contains all the Office common code. When the user wants to install even Excel, the deployment operation could skip the download of the main Framework package because Word is an optional package of its main Office framework.
Optional packages have relationship with their main packages through their manifest files. In the manifest file, there is the declaration of the dependency to the main package (using AMUID). Deeply describing Optional packages architecture is beyond the scope of this book.
AppExecution aliases
As we have previously described, packaged applications could not be activated directly through their executable file. This represents a big limitation, especially for the new modern Console applications. With the goal of enabling the launch of Modern apps (Centennial and UWP) through the command line, starting from Windows 10 Fall Creators Update (build 1709), the Modern Application Model has introduced the concept of AppExecution aliases. With this new feature, the user can launch Edge or any other modern applications through the console command line. An AppExecution alias is basically a 0-bytes length executable file located in C:Users<UserName>AppDataLocalMicrosoftWindowsApps (as shown in Figure 8-46.). The location is added in the system executable search path list (through the PATH environment variable); as a result, to execute a modern application, the user could specify any executable file name located in this folder without the complete path (like in the Run dialog box or in the console command line).

Figure 8-46 The AppExecution aliases main folder.
How can the system execute a 0-byte file? The answer lies in a little-known feature of the file system: reparse points. Reparse points are usually employed for symbolic links creation, but they can store any data, not only symbolic link information. The Modern Application Model uses this feature to store the packaged application’s activation data (package family name, Application user model ID, and application path) directly into the reparse point.
When the user launches an AppExecution alias executable, the CreateProcess API is used as usual. The NtCreateUserProcess system call, used to orchestrate the kernel-mode process creation (see the “Flow of CreateProcess” section of Chapter 3 in Part 1, for details) fails because the content of the file is empty. The file system, as part of normal process creation, opens the target file (through IoCreateFileEx API), encounters the reparse point data (while parsing the last node of the path) and returns a STATUS_REPARSE code to the caller. NtCreateUserProcess translates this code to the STATUS_IO_REPARSE_TAG_NOT_HANDLED error and exits. The CreateProcess API now knows that the process creation has failed due to an invalid reparse point, so it loads and calls into the ApiSetHost.AppExecutionAlias.dll library, which contains code that parses modern applications’ reparse points.
The library’s code parses the reparse point, grabs the packaged application activation data, and calls into the AppInfo service with the goal of correctly stamping the token with the needed security attributes. AppInfo verifies that the user has the correct license for running the packaged application and checks the integrity of its files (through the State Repository). The actual process creation is done by the calling process. The CreateProcess API detects the reparse error and restarts its execution starting with the correct package executable path (usually located in C:Program FilesWindowsApps). This time, it correctly creates the process and the AppContainer token or, in case of Centennial, initializes the virtualization layer (actually, in this case, another RPC into AppInfo is used again). Furthermore, it creates the HAM host and its activity, which are needed for the application. The activation at this point is complete.
Package registration
When a user wants to install a modern application, usually she opens the AppStore, looks for the application, and clicks the Get button. This action starts the download of an archive that contains a bunch of files: the package manifest file, the application digital signature, and the block map, which represent the chain of trust of the certificates included in the digital signature. The archive is initially stored in the C:WindowsSoftwareDistributionDownload folder. The AppStore process (WinStore.App.exe) communicates with the Windows Update service (wuaueng.dll), which manages the download requests.
The downloaded files are manifests that contain the list of all the modern application’s files, the application dependencies, the license data, and the steps needed to correctly register the package. The Windows Update service recognizes that the download request is for a modern application, verifies the calling process token (which should be an AppContainer), and, using services provided by the AppXDeploymentClient.dll library, verifies that the package is not already installed in the system. It then creates an AppX Deployment request and, through RPC, sends it to the AppX Deployment Server. The latter runs as a PPL service in a shared service host process (which hosts even the Client License Service, running as the same protected level). The Deployment Request is placed into a queue, which is managed asynchronously. When the AppX Deployment Server sees the request, it dequeues it and spawns a thread that starts the actual modern application deployment process.
![]() Note
Note
Starting with Windows 8.1, the UWP deployment stack supports the concept of bundles. Bundles are packages that contain multiple resources, like different languages or features that have been designed only for certain regions. The deployment stack implements an applicability logic that can download only the needed part of the compressed bundle after checking the user profile and system settings.
A modern application deployment process involves a complex sequence of events. We summarize here the entire deployment process in three main phases.
Phase 1: Package staging
After Windows Update has downloaded the application manifest, the AppX Deployment Server verifies that all the package dependencies are satisfied, checks the application prerequisites, like the target supported device family (Phone, Desktop, Xbox, and so on) and checks whether the file system of the target volume is supported. All the prerequisites that the application needs are expressed in the manifest file with each dependency. If all the checks pass, the staging procedure creates the package root directory (usually in C:Program FilesWindowsApps<PackageFullName>) and its subfolders. Furthermore, it protects the package folders, applying proper ACLs on all of them. If the modern application is a Centennial type, it loads the daxexec.dll library and creates VFS reparse points needed by the Windows Container Isolation minifilter driver (see the “Centennial applications” section earlier in this chapter) with the goal of virtualizing the application data folder properly. It finally saves the package root path into the HKLMSOFTWAREClassesLocalSettingsSoftwareMicrosoftWindows CurrentVersionAppModelPackageRepositoryPackages<PackageFullName> registry key, in the Path registry value.
The staging procedure then preallocates the application’s files on disk, calculates the final download size, and extracts the server URL that contains all the package files (compressed in an AppX file). It finally downloads the final AppX from the remote servers, again using the Windows Update service.
Phase 2: User data staging
This phase is executed only if the user is updating the application. This phase simply restores the user data of the previous package and stores them in the new application path.
Phase 3: Package registration
The most important phase of the deployment is the package registration. This complex phase uses services provided by AppXDeploymentExtensions.onecore.dll library (and AppXDeploymentExtensions .desktop.dll for desktop-specific deployment parts). We refer to it as Package Core Installation. At this stage, the AppX Deployment Server needs mainly to update the State Repository. It creates new entries for the package, for the one or more applications that compose the package, the new tiles, package capabilities, application license, and so on. To do this, the AppX Deployment server uses database transactions, which it finally commits only if no previous errors occurred (otherwise, they will be discarded). When all the database transactions that compose a State Repository deployment operation are committed, the State Repository can call the registered listeners, with the goal of notifying each client that has requested a notification. (See the “State Repository” section in this chapter for more information about the change and event tracking feature of the State Repository.)
The last steps for the package registration include creating the Dependency Mini Repository file and updating the machine registry to reflect the new data stored in the State Repository. This terminates the deployment process. The new application is now ready to be activated and run.
![]() Note
Note
For readability reasons, the deployment process has been significantly simplified. For example, in the described staging phase, we have omitted some initial subphases, like the Indexing phase, which parses the AppX manifest file; the Dependency Manager phase, used to create a work plan and analyze the package dependencies; and the Package In Use phase, which has the goal of communicating with PLM to verify that the package is not already installed and in use.
Furthermore, if an operation fails, the deployment stack must be able to revert all the changes. The other revert phases have not been described in the previous section.
Conclusion
In this chapter, we have examined the key base system mechanisms on which the Windows executive is built. In the next chapter, we introduce the virtualization technologies that Windows supports with the goal of improving the overall system security, providing a fast execution environment for virtual machines, isolated containers, and secure enclaves.