
8
The Benefits of Teamwork
It takes time and money to change any organization, and software groups are no exception. If you approach change in an orderly way, however, the benefits can be substantial. This chapter describes these benefits and summarizes the costs and the return you can expect. A return-on-investment analysis for a typical TSP introduction program shows that you will fully recover your costs within the first two years with an average five-year return of over 300%. Appendix F gives a more detailed description of this example.
By using the PSP and TSP, organizations have significantly improved the predictability and cycle time performance of their software groups. They have also reduced development costs, improved product quality, and reduced employee turnover. This chapter summarizes these benefits for five organizations that have introduced the TSP.
Better Predictability
When I launched the TSP team at Hill Air Force Base* in February 1998, Hill management had already signed a contract to deliver the team’s product in September. Also, the team had just learned that its air force customer had scheduled a training exercise for August and the program manager wanted the product a month earlier. He needed to demonstrate the new product in this training exercise.
* Hill Air Force Base is the first U.S. government organization to reach CMM level 5. This is the highest level of performance CMM defines for software organizations, and only a few dozen groups in the world have reached it.
When the Hill team completed its plan, the engineers found that they could finish the project in August as the customer had requested, so they committed to that date. After working on the job for a couple of months, the engineers were significantly ahead of even this accelerated schedule, so they asked the project manager what he wanted them to do. They could either finish early and give back some money, or they could add more functions to the product and finish on time. The customer opted for adding the functions, and the team delivered on schedule [1].
This is normal for TSP teams. When engineers are properly trained and use disciplined methods to plan, track, and manage their work, they consistently deliver quality products on schedule. What is more, they know precisely where they stand and can predict when they will finish. From an SEI study of 28 projects in four organizations, the quartile range of schedule performance is shown in Figure 8.1 [2]. Of these 28 projects, 13 used the TSP and 15 did not.
The black portion in Figures 8.1 to 8.5 shows the performance range for the middle 50% of the population, the top and bottom limits of the population are shown by the top and bottom horizontal lines, and unusual or “outlier points” are shown by the circles and asterisks.
Shorter Cycle Time
The first TSP project at Boeing was to make a major modification to a large military avionics system. In the launch, management told the team that the product had to be delivered on schedule and that any delay would disrupt the flight testing program. This would be very expensive. Since this was the first time the company had used the TSP, management did not realize that disciplined teams produce more complete and higher-quality designs than other software groups. Therefore, the managers were concerned when the engineers did not complete the design on the date of the previously committed design milestone. Because the product had much higher quality than they expected, however, testing time was sharply cut and the overall schedule was shorter.
Figure 8.1 Schedule Error

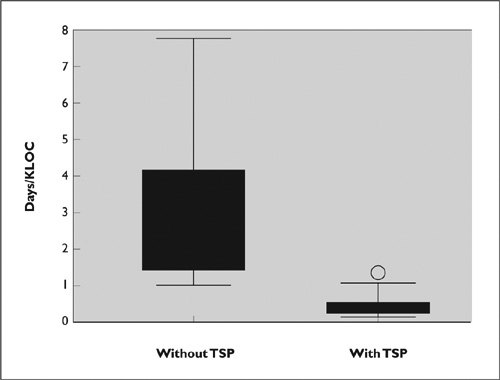
Because of their personal attention to quality, these Boeing engineers reduced test defects by 75%. Compared with previous projects, this cut test time by 94%, and the product was delivered ahead of schedule [3]. This is typical of disciplined teamwork. As shown in Figure 8.2, the SEI study of TSP projects found that system test time is reduced by about ten times [2]. Because, as we saw in Chapter 6, the time required to write high-quality programs is no more than the time to produce defective ones, quality work sharply cuts development cycle time.
Figure 8.2 Reduced System test Time
Reduced Development Costs
Teradyne had gathered final system testing and field maintenance defect data for ten years. They found that their previous products had averaged 20 defects per 1,000 lines of code (KLOC). Therefore, a typical 100 KLOC product would have 2,000 defects in system testing, field testing, customer acceptance testing, and customer use. Since it cost an average of 12 engineering hours to find and fix each such defect, the defect repair costs for typical products were several engineering years of work.
When Teradyne introduced the TSP, this normal 20 defects / KLOC defect level was reduced to 1. This saved the company $5.3 million in the first two years [4]. From the SEI study of 28 projects, Figure 8.3 shows the quartile range of improvement for test defects, and Figure 8.4 shows the quartile range of error in planned versus actual project costs [2]. With the TSP, fewer defects mean lower costs and more accurate cost estimates.
Improved Product Quality
As described in Chapter 7, EBS operates an on-line worldwide currency-trading network for international banks. This system runs on EBS-owned computers and is controlled by EBS-developed software. EBS develops and tests new feature upgrades in their laboratory in New Jersey. Then these upgrades are handed to an internal test group that runs another entire suite of tests. Finally, when everything seems to work properly, they turn the product over to a quality assurance group for final acceptance testing and quality certification. This involves another exhaustive batch of tests. Because of the time previously required to find and fix the many defects normally found in this process, test and certification often took longer than the rest of the development phases combined.
Figure 8.3 Reduced System test Defects
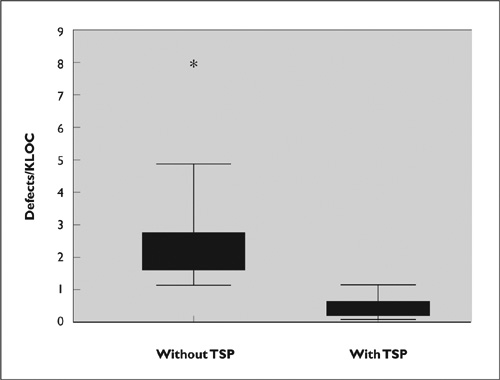
Figure 8.4 Effort Estimate Error

While the development team spent a year developing the first BrokerNet version, final testing only took 13 weeks. Perhaps most interesting is the fact that, when properly trained and led, TSP teams improve as they gain experience with the process. Version two of BrokerNet was nearly twice as large as version one, and it completed system testing in only eight weeks. It also had only one-third as many system test defects. Version one of this system has now been installed in over a dozen customer offices in Europe and has worked flawlessly without a single reported problem. This kind of quality performance is typical of TSP teams. As indicated by acceptance test defect densities in Figure 8.5, the defects in completed TSP systems generally are at or very near zero [2].
Figure 8.5 Improved Product Quality

Reduced Employee Turnover
When I launched the first TSP team at Kaiser Electronics, the team plan showed that they needed five additional PSP-trained engineers in four months. Since this group was located in San Jose, California, and programmers were then in very short supply, I felt they would have trouble hiring that many engineers so quickly. The department manager told me it would not be a problem. The word was out that they were using the TSP and several engineers had already called looking for jobs.
When I returned a year later, I asked the Kaiser president about their experience with turnover. He explained that annual turnover in Silicon Valley was typically around 25%. The prior year, Kaiser turnover had been 23%. In software, their turnover was 7%, but on the TSP team it was zero. This again is typical of TSP teams. Once the engineers see that their initial concerns about planning and data gathering are unfounded, they like the personal control that the TSP provides them. They also feel proud when they deliver quality products on time. As many engineers have told me, now developing software is fun. In a tight labor market, the principal constraint on growth is the ability to hire and retain good people. A reputation as a good place to work is money in the bank.
TSP Introduction Costs
Regardless of how attractive some new method or technique appears, it usually comes with hidden costs and problems, so most executives are reluctant to make major investments without an initial prototype trial. This is a wise approach.
TSP introduction costs vary considerably, depending on the strategy you select. For example, for maximum speed, you would need the most outside assistance. Conversely, if you wanted to minimize external support costs, you could train your own experts and have them handle the training and introduction work. A modest initial TSP introduction program would involve management and engineer training for two or three teams of engineers. This would be followed by a TSP launch for each team.
The costs to retain outside experts to provide the initial training and to lead the managers and a couple of engineering teams through these steps could vary considerably. In the organizations I have worked with, these costs typically have run between $100,000 and $300,000. Depending on the project schedule, you would then have initial team results in 6 to 12 months. At that point, you could make an informed decision on a broader introduction program.
Return on Investment
Improving the performance of an organization is an investment, and to make a rational decision on this investment, you would need a return-on-investment analysis. One way to judge the affordability of making such an investment is in terms of avoidable costs. Because using the TSP cuts testing time by about ten times and ships essentially defect-free products, a good place to start is by examining the costs of poor quality. The two categories of avoidable quality costs that are easiest to measure and estimate are final testing time and customer-reported defects. Assuming you had a 100-engineer software organization that used current common software methods, your annual avoidable quality costs would be $6.5 million. For more detail on these calculations, see Appendix F.
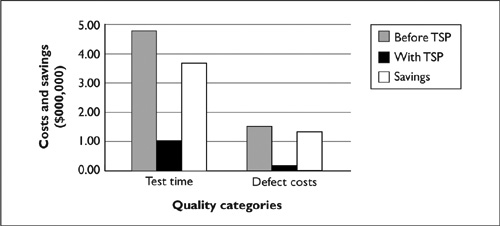
By introducing the TSP, organizations have typically reduced test time by 10 or more times and defects by up to 250 times. The example in Appendix F assumes that you would cut test time by a conservative 4 times and customer-shipped defects by 10 times. As shown in Figure 8.6, the likely TSP savings would then be $3,750,000 for testing and $1,350,000 for defect repair costs, or a $5,100,000 annual savings from the improved quality your teams produced by using the TSP.
To determine the benefits of the TSP for your organization, you need data on costs before the change and an estimate of these costs afterward. Because software work typically is not measured or tracked, however, few organizations can get the “before” data required for such an analysis. The next paragraphs summarize a typical example return-on-investment analysis. For a complete description of this ROI example, see Appendix F.
Figure 8.6 Quality Costs and Savings
The example in Appendix F covers all of the costs and savings for introducing the TSP in a 100-engineer organization. The total costs are $1,728,000, and the annual savings, once TSP is in full use, are $5,100,000. The total introduction costs therefore are returned in only four months of full TSP use, with an ROI of 291%. If your organization has more than 100 engineers, the costs and savings would be proportionately larger. You could also reduce the introduction costs by training your own PSP instructors and TSP coaches, then use them to train and coach your teams. This would take longer and delay the TSP savings, but it would be less expensive.
Discounted Return on Investment
The quarterly cost and savings profile for a TSP introduction program are shown in Figure 8.7. At a 6% annual interest rate, the present-value cost of a five-year TSP introduction program is $2,805,810, and the present-value savings is $11,151,963, for an ROI of 397%. At a 10% annual interest rate, the five-year present-value costs would be $2,524,350, and the savings would be $9,277,230, for an ROI of 368%.
Figure 8.7 Cumulative Discounted 5-Year Costs and Savings from TSP Introduction—6%
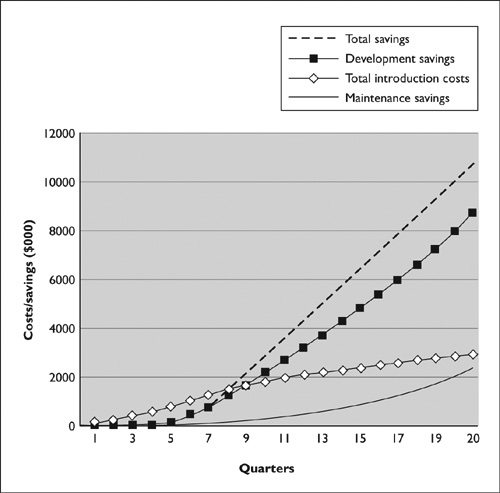
It takes about two years for the cumulative TSP savings to surpass the cumulative introduction costs. This time is required for training and for the first TSP projects to reach the testing phase. The post-release defect savings build more slowly because of the time required for TSP-produced products to reach the users. Since the TSP savings are not realized until the latter phases of the projects, it takes about two years to fully recover the TSP introduction costs.
Summary and Conclusions
The following seven principal points are made in this chapter:
1. The benefits of introducing the TSP are better predictability, shorter cycle time, reduced development costs, improved product quality, and reduced employee turnover.
2. An initial TSP introduction program should train and launch two or three trial teams.
3. In parallel with these initial teams, organizations should train their own PSP instructors and TSP coaches.
4. After the initial projects are launched successfully and the organization has its own qualified PSP instructors and TSP coaches, it should expand the TSP to other groups.
5. Total TSP introduction costs are returned in about four months of full TSP use, and the ROI is 291%.
6. At a 6% annual interest rate, the five-year present value ROI is 397%.
7. The cumulative investment recovery period for TSP introduction is about two years.
References
1. David Webb and Watts Humphrey. “Using the TSP on the Task View Project.” Crosstalk: The Journal of Defense Software Engineering 12, 2 (February 1999).
2. Donald R. McAndrews. “The Team Software Process (TSP): An Overview and Preliminary Results of Using Disciplined Practices.” Carnegie Mellon University Technical Report CMU/SEI-2000-TR-015, November 2000.
3. John Vu. “Process Improvement in the Boeing Company.” Proceedings of the 2000 Software Engineering Process Group (SEPG) Conference. Seattle, WA: March 2000.
4. Robert Musson. Presentation at the Software Engineering Symposium, Software Engineering Institute, September 1999.