
Garbage collection will be the first and last thing you work on. It is the apparent source of the most obvious performance problems, those that are quickest to fix, and will be something that you need to constantly monitor to keep in check. I say “apparent source” because as we will see, many problems are actually due to an incorrect understanding of the garbage collector’s behavior and expectations. In .NET, you need to think of memory performance at least as much as CPU performance. It is so fundamental to smooth .NET operation, that the most significant chunk of this book’s content is dedicated to just this topic.
Many people get very nervous when they think of the overhead a garbage collection can cause. Once you understand it, though, it becomes straightforward to optimize your program for its operation. In the Introduction, you saw that the garbage collector can actually give you better overall heap performance in many cases because it deals with allocation and fragmentation better. Garbage collection is definitely a benefit to your application.
The native heap in Windows maintains free lists to know where to put new allocations. Despite the use of low fragmentation heaps, many long-running native code applications struggle with fragmentation. Time spent in memory allocation gradually increases as the allocator spends more and more time traversing the free lists looking for an open spot. Memory use continues to grow and, inevitably, the process will need to be restarted to begin the cycle anew. Some native programs deal with this by replacing the default implementation of malloc with custom allocation schemes that work hard to reduce this fragmentation.
In .NET, memory allocation is trivial because it usually happens at the end of a memory segment and is not much more than a few additions, decrements, and a comparison in the normal case. In these simple cases, there are no free lists to traverse and little possibility of fragmentation. GC heaps can actually be more efficient because objects allocated together in time tend to be near one another on the heap, improving locality.
In the default allocation path, a small code stub will check the desired object’s size against the space remaining in a small allocation buffer. As long as the allocation fits, it is extremely fast and has no contention. Once the allocation buffer is exhausted, the GC allocator will take over and find a spot for the object. Then a new allocation buffer will be reserved for future allocation requests.
The assembly code for this process is only a handful of instructions and useful to examine.
The C# to demonstrate this is just a simple allocation:
class MyObject {
int x;
int y;
int z;
}
static void Main(string[] args)
{
var x = new MyObject();
}
First, here is the breakdown of the calling code for the allocation:
; Copy method table pointer for the class into
; ecx as argument to new()
; You can use !dumpmt to examine this value.
mov ecx,3F3838h
; Call new
call 003e2100
; Copy return value (address of object) into a register
mov edi,eax
Here is the actual allocation:
; NOTE: Most code addresses removed for formatting reasons.
;
; Set eax to value 0x14, the size of the object to
; allocate, which comes from the method table
mov eax,dword ptr [ecx+4] ds:002b:003f383c=00000014
; Put allocation buffer information into edx
mov edx,dword ptr fs:[0E30h]
; edx+40 contains the address of the next available byte
; for allocation. Add that value to the desired size.
add eax,dword ptr [edx+40h]
; Compare the intended allocation against the
; end of the allocation buffer.
cmp eax,dword ptr [edx+44h]
; If we spill over the allocation buffer,
; jump to the slow path
ja 003e211b
; update the pointer to the next free
; byte (0x14 bytes past old value)
mov dword ptr [edx+40h],eax
; Subtract the object size from the pointer to
; get to the start of the new obj
sub eax,dword ptr [ecx+4]
; Put the method table pointer into the
; first 4 bytes of the object.
; eax now points to new object
mov dword ptr [eax],ecx
; Return to caller
ret
; Slow Path – call into CLR method
003e211b jmp clr!JIT_New (71763534)
In summary, this involves one direct method call and only nine instructions in the helper stub. That’s hard to beat.
If you are using some configuration options such as server GC, then there is not even contention for the fast or the slow allocation path because there is a heap for every processor. .NET trades the simplicity in the allocation path for more complexity during de-allocation, but you do not have to deal with this complexity directly. You just need to learn how to optimize for it, which is what you will learn how to do in this chapter.
I am covering garbage collection at the beginning of the book because so much of the stuff that comes later will relate back to this chapter. Understanding the effect your program has on the garbage collector is so fundamental to achieving good performance, that it affects nearly everything else.
- Basic Operation
The details of how the garbage collector makes decisions are continually being refined, especially as .NET becomes more prevalent in high-performance systems. The following explanation may contain details that will change in upcoming .NET versions, but the overall picture is unlikely to change drastically in the near future.
In a managed process there are two types of heaps—native and managed. Native heaps are allocated with the VirtualAlloc Windows API and used by the operating system and CLR for unmanaged memory such as that for the Windows API, OS data structures, and even much of the CLR. The CLR allocates all managed .NET objects on the managed heap, also called the GC heap, because the objects on it are subject to garbage collection.
The managed heap is further divided into two types of heaps: the small object heap and the large object heap (LOH). Each one is assigned its own segments, which are blocks of memory belonging to that heap. The size of each segment can vary depending on your configuration and hardware platform, but can be on the order of a few hundred megabytes or more for a large application. Both the small object heap and the large object heap can have multiple segments assigned to them.
The small object heap segments are further divided into generations. There are three generations, referenced casually as gen 0, gen 1, and gen 2. Gen 0 and gen 1 are always in the same segment, but gen 2 can span multiple segments, as can the large object heap. The segment that contains gen 0 and gen 1 is called the ephemeral segment.
Graphically, the heap looks like this to start out with, with the two segments labeled A and B. Higher addresses are on the right side:
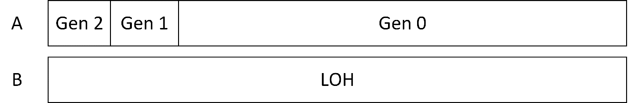
The small object heap is made up of segment A and the large object heap has segment B. Gen 2 and gen 1 start off at only a few bytes in size because they are empty so far.
Objects allocated on the small object heap pass through a lifetime process that needs some explanation. The CLR allocates all objects that are less than 85,000 bytes in size on the small object heap. They are always allocated in gen 0, usually at the end of the current used space. This is why allocations in .NET are extremely fast, as seen at the beginning of this chapter. If the fast allocation path fails, then the objects may be placed anywhere they can fit inside gen 0’s boundaries. If it will not fit in an existing spot, then the allocator will expand the current boundaries of gen 0 to accommodate the new object. If this pushes past the end of the segment, it may trigger a garbage collection.
Objects always begin their life in gen 0. As long as they are still alive, the GC will promote them to subsequent generations each time a collection happens. Collections of gen 0 and gen 1 are sometimes called ephemeral collections.
When a garbage collection occurs, a compaction may occur, in which case the GC physically moves the objects to a new location to free space in the segment. If no compaction occurs, the boundaries are merely redrawn. After a few garbage collections with no compaction, the heap diagram could look like this:
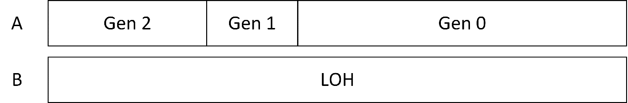
The individual objects have not moved, but the boundary lines have.
Compaction may occur in the collection of any generation and this is a relatively expensive process because the GC must fix up all of the references to those objects so they point to the new location, which may require pausing all managed threads. Because of this expense, the garbage collector will only do compaction when it is productive to do so, based on some internal metrics.
Once an object reaches gen 2, it remains there for the remainder of its lifetime. This does not mean that gen 2 grows forever—if the objects in gen 2 finally die off and an entire segment has no live objects, then the garbage collector can return the segment to the operating system or reclaim it for other generations as part of additional segments in the heap. This can happen during a full garbage collection.
So what does alive mean? If the GC can reach the object via any of the known GC roots, following the graph of object references, then it is alive. A root can be the static variables in your program, the threads which have the stacks (which will point to local variables) from all running methods, strong GC handles (such as pinned handles), and the finalizer queue. Note that you may have objects that no longer have roots to them, but if the objects are in gen 2, then a gen 0 collection will not clean them up. They will have to wait for a full collection.
If gen 0 ever starts to fill up a segment and a collection cannot compact it enough, then the GC will allocate a new segment. The new segment will house a new gen 1 and gen 0 while the old segment is converted to gen 2. Everything from the old generation 0 becomes part of the new generation 1 and the old generation 1 is likewise promoted to generation 2 (which conveniently does not have to be copied). The segments now look like this:
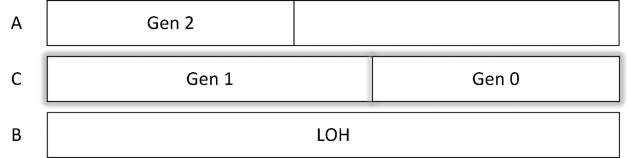
If gen 2 continues to grow, then it can span multiple segments. The LOH heap can also span multiple segments. Regardless of how many segments there are, generations 0 and 1 will always exist on the same segment. This knowledge of segments will come in handy later when we are trying to figure out which objects live where on the heap.
The large object heap obeys different rules. Any object that is at least 85,000 bytes in size is allocated on the LOH automatically and does not pass through the generational model. The only types of objects that normally exceed this size are arrays and strings. For performance reasons, the LOH is not automatically compacted during collection, but starting in .NET 4.5.1, you can compact it on-demand. Like gen 2, if memory in the LOH is no longer needed, then it can be reclaimed for other portions of the heap, but we will see later that ideally you do not want memory on the large object heap to be garbage collected at all.
In the LOH, the garbage collector always uses a free list to determine where to best place allocated objects. We will explore some techniques in this chapter to reduce fragmentation on this heap.
Note If you go poking around at the objects in the LOH in a debugger, you will notice that not only can the entire heap be smaller than 85,000 bytes in size, but that it can also have objects that are smaller than that size allocated on that heap. These objects are usually allocated by the CLR and you can ignore them.
A garbage collection runs for a specific generation and all generations below it. If it collects gen 1, it will also collect gen 0. If it collects gen 2, then all generations are collected, and the large object heap is collected as well. When a gen 0 or gen 1 collection occurs, the program is paused for the duration of the collection. For a gen 2 collection, portions of the collection can occur on a background thread, depending on the configuration options.
There are four phases to a garbage collection:
- Suspension—All managed threads in the application are forced to pause before a collection can occur.
- Mark—Starting from each root, the garbage collector follows every object reference and marks those objects as seen.
- Compact—Reduce memory fragmentation by relocating objects to be next to each other and update all references to point to the new locations. This happens on the small object heap when needed and there is no way to control it. On the large object heap, compaction does not happen automatically at all, but you can instruct the garbage collector to compact it on-demand.
- Resume—The managed threads are allowed to resume.
The mark phase does not actually need to touch every single object on the heap. It will only go through the collected portion of the heap. For example, a gen 0 collection considers objects only from gen 0, a gen 1 collection will mark objects in both gen 0 and gen 1, and a gen 2, or full, collection, will need to traverse every live object in the heap, making it potentially very expensive. An additional wrinkle here is that an object in a higher generation may be a root for an object in a lower generation. This will cause the garbage collector to traverse a subset of objects in the higher generation, but it is not as expensive as a full collection for that generation.
There are a couple of important consequences to the behavior described above.
First, the time it takes to do a garbage collection is almost entirely dependent on the number of live objects in the collected generation, not the number of objects you allocated. This means that if you allocate a tree of a million objects, as long as you cut off that root reference before the next GC, those million objects contribute nothing to the amount of time the GC takes.
Second, the frequency of a garbage collection is determined by how much memory is allocated in a specific generation. Once that amount passes an internal threshold, a GC will happen for that generation. The threshold continually changes and the GC adapts to your process’s behavior. If doing a collection on a particular generation is productive (it promotes many objects), then it will happen more frequently, and the converse is true. Another trigger for GCs is the total available memory on a machine, independent of your application. If available memory drops below a certain threshold, garbage collection may happen more frequently in an attempt to reduce the overall heap size.
From this description, it may feel like that garbage collections are out of your control. This could not be farther from the truth. Manipulating your GC statistics by controlling your memory allocation patterns is one of the easiest optimizations to make. It requires understanding of how the GC works, what configuration options are available to you, your allocation rate, and how well you control object lifetimes.
- Configuration Options
The .NET Framework does not give you very many ways to configure the garbage collector out the box. It is best to think of this as “less rope to hang yourself with.” For the most part, the garbage collector configures and tunes itself based on your hardware configuration, available resources, and application behavior. What few options are provided are for very high-level behaviors, and are mainly determined by the type of program you are developing.
- Workstation vs. Server GC
The most important choice you have is whether to use workstation or server garbage collection.
Workstation GC is the default. In this mode, all GCs happen on the same thread that triggered the collection and run at the same priority. For simple apps, especially those that run on interactive workstations where many managed processes run, this makes the most sense. For computers with a single processor, this is the only option and trying to configure anything else will not have any effect.
Server GC creates a dedicated thread for each logical processor or core. These threads run at highest priority (THREAD_PRIORITY_HIGHEST), but are always kept in a suspended state until a GC is required. After the GC, they sleep again.
In addition, the CLR creates a separate heap for each processor. Within each processor heap, there is a small object heap and a large object heap. From your application’s perspective, this is all logically the same heap—your code does not know which heap that objects belong to and object references exist between all the heaps (they all share the same virtual address space).
Having multiple heaps gives a couple of advantages:
- Garbage collection happens in parallel. Each GC thread collects one of the heaps. This can make garbage collection significantly faster than in workstation GC.
- In some cases, allocations can happen faster, especially on the large object heap, where allocations are spread across all the heaps.
There are other internal differences as well such as larger segment sizes, which can mean a longer time between garbage collections.
You configure server GC in the app.config file inside the <runtime> element:
<configuration>
<runtime>
<gcServer enabled="true"/>
</runtime>
</configuration>
Should you use workstation or server GC? If your app is running on a multi-processor machine dedicated to just your application, then the choice is clear: server GC. It will provide the lowest latency collection in most situations.
On the other hand, if you need to share the machine with multiple managed processes, the choice is not so clear. Server GC creates many high-priority threads and if multiple apps do that, they can all negatively affect one other with conflicting thread scheduling. In this case, it might be better to use workstation GC.
If you really want to use server GC in multiple applications on the same machine, another option if is to affinitize the competing applications to specific processors. The CLR will create heaps only for the processors which are enabled for that application.
Whichever one you pick, most of the tips in this book apply to both types of collection.
- Background GC
Background GC changes how the garbage collector performs gen 2 collections. Gen 0 and gen 1 collections remain foreground GCs that block all application threads from executing.
Background GC works by having a dedicated thread for garbage collecting generation 2. For server GC there will be an additional thread per logical processor. Yes, this means if you use server GC and background GC, you will have two threads per processor dedicated to GC, but this is not particularly concerning. It is not a big deal for processes to have many threads, especially when most of them are doing nothing most of the time.
The garbage collection happens concurrently with your application’s threads. It is still possible, however, that a blocking collection will be requested. In this case, the background GC thread is paused with the rest of the app’s threads while the GC happens.
If you are using workstation GC, then background GC is always enabled. Starting with .NET 4.5, it is enabled on server GC by default, but you do have the ability to turn it off.
This configuration will turn off the background GC:
<configuration>
<runtime>
<gcConcurrent enabled="false"/>
</runtime>
</configuration>
In practice, there should rarely ever be a reason to disable background GC. If you want to prevent these background GC threads from ever taking CPU time from your application, but do not mind a potential increase in full, blocking GC latency or frequency, then you can turn this off.
- Low Latency Mode
If you have periods of time that require critical performance, you can tell the GC not to perform expensive gen 2 collections. Depending on your other settings, assign the GCSettings.LatencyMode property one of the following values:
- LowLatency—For workstation GC only, it will suppress gen 2 collections.
- SustainedLowLatency—For workstation and server GC, it will suppress full gen 2 collections, but it will allow background gen 2 collections. You must enable background GC for this option to take effect.
Both modes will greatly increase the size of the managed heap because compaction will not occur. If your process uses a lot of memory, you should avoid this feature.
Right before entering this mode, it is a good idea to force a last full GC by calling GC.Collect(2, GCCollectionMode.Forced). Once your code leaves this mode, do another one.
You should never use this feature by default. It is designed for applications that must run without serious interruptions for a long time, but not 100% of the time. A good example is stock trading: during market hours, you do not want full garbage collections happening. When the market closes, you turn this mode off and perform full GCs until the market reopens.
Only turn it on if all of the following criteria apply:
- The latency of a full garbage collection is never acceptable during normal operation.
- The application’s memory usage is far lower than available memory.
- Your program can survive long enough to either turn off low latency mode, restart itself, or manually perform a full collection.
This is a rarely used setting and you should think twice about using it because of the potential unintended consequences. If you think this is useful, perform careful measurement to make sure. Turning this feature on may cause other performance problems because a side effect will be having more ephemeral collections (gen 0 and 1) in an attempt to deal with the lack of full collections. You may just trade one set of problems for another.
Finally, note that low latency mode is not a guarantee. If the garbage collector has the choice between doing a full collection or throwing an OutOfMemoryException, it may choose the full collection regardless of your mode setting.
- Reduce Allocation Rate
This almost goes without saying, but if you reduce the amount of memory you are allocating, you reduce the pressure on the garbage collector to operate. You can also reduce memory fragmentation and CPU usage as well. It can take some creativity to achieve this goal and it might conflict with other design goals.
Critically examine each object and ask yourself:
- Do I really need this object at all?
- Does it have fields that I can get rid of?
- Can I reduce the size of arrays?
- Can I reduce the size of primitives (Int64 to Int32, for example)?
- Are some objects used only in rare circumstances and can be initialized only when needed?
- Can I convert some classes to structs so they live on the stack, or as part of another object?
- Am I allocating a lot of memory, to use only a small portion of it?
- Can I get this information in some other way?
Story In a server that handled user requests, we found out that one type of common request caused more memory to be allocated than the size of a heap segment. Since the CLR caps the maximum size of segments and gen 0 must exist in a single segment, we were guaranteed a GC on every single request. This is not a good spot to be in because there are few options besides reducing memory allocations.
- The Most Important Rule
There is one fundamental rule for high-performance programming with regard to the garbage collector. In fact, the garbage collector was explicitly designed with this idea in mind:
Collect objects in gen 0 or not at all.
Put differently, you want objects to have an extremely short lifetime so that the garbage collector will never touch them at all, or, if you cannot do that, they should go to gen 2 as fast as possible and stay there forever, never to be collected. This means that you maintain a reference to long-lived objects forever. Often, this also means pooling reusable objects, especially anything on the large object heap.
Garbage collections get more expensive in each generation. You want to ensure there are many gen 0/1 collections and very few gen 2 collections. Even with background GC for gen 2, there is still a CPU cost that you would rather not pay—that is a processor the rest of your program should be using.
Note You may have heard the myth that you should have 10 gen 0 collections for each gen 1 collection and 10 gen 1 collections for each gen 2 collection. This is not true—just understand that you want to have lots of fast gen 0 collections and very few of the expensive gen 2 collections.
You want to avoid gen 1 collections mostly because an object that is promoted from gen 0 to gen 1 will tend to be promoted to gen 2 in due course. Gen 1 is a sort of buffer before you get to gen 2.
Ideally, every object you allocate goes out of scope by the time the next gen 0 comes around. You can measure how long that interval is and compare it to the duration that data is alive in your application. See the end of the chapter for how to use the tools to retrieve this information.
Obeying this rule requires a fundamental shift in your mindset if you are not used to it. It will inform nearly every aspect of your application, so get used to it early and think about it often.
- Reduce Object Lifetime
The shorter an object’s scope, the less chance it has of being promoted to the next generation when a GC comes along. In general, you should not allocate objects until right before you need them. The exception would be when the cost of object creation is so high it makes sense to create them at an earlier point when it will not interfere with other processing.
On the other side of the object use, you want to make sure that objects go out of scope as soon as possible. For local variables, this can be after the last local usage, even before the end of the method. You can lexically scope it narrower by using the { } bracket, but this will probably not make a practical difference because the compiler will generally recognize when an object is no longer used anyway. If your code spreads out operations on an object, try to reduce the time between the first and last uses so that the GC can collect the object as early as possible.
Sometimes you will need to explicitly null out a reference to an object if it is a field on a long-lived object. This may make the code slightly more complicated because you will have more checks for nulls scattered around. This can also create a tension between efficiency and always having full state available, particularly for debugging.
One option is to convert the object you want to null out to another form, such as a log message, that can more efficiently record the state for debugging later.
Another way to manage this balance is to have variable behavior: run your program (or a specific portion of your program, say for a specific request) in a mode that does not null out references but keeps them around as long as possible for easier debugging.
- Reduce Depth of Trees
As described at the beginning of this chapter, the GC works by following object references. In server GC, it does this on multiple threads at once. You want to exploit parallelism as much as possible, and if one thread hits a very long chain of nested objects, the entire collection process will not finish until that long-running thread is complete. In later versions of the CLR, this is less of a concern as the GC threads now use work-stealing algorithms to balance this load better. If you suspect you have very deep trees of objects, this may be something worth looking at.
- Reduce References between Objects
This is related to the depth of trees in the previous section, but there are a few other considerations.
Objects that have many references to other objects will take more time for the garbage collector to traverse. A long GC pause time is often an indication of a large, complex object graph.
Another danger is that it becomes much harder to predict object lifetimes if you cannot easily determine all of the possible references to them. Reducing this complexity is a worthy goal just for sane code practices, but it also makes debugging and fixing performance problems easier.
Also, be aware that references between objects of different generations can cause inefficiencies in the garbage collector, specifically references from older objects to newer objects. For example, if an object in generation 2 has a reference to an object in generation 0, then every time a gen 0 GC occurs, a portion of gen 2 objects will also have to be scanned to see if they are still holding onto this reference to a generation 0 object. It is not as expensive as a full GC, but it is still unnecessary work if you can avoid it.
- Avoid Pinning
Pinning exists so that you can safely pass managed memory references to native code. It is most common to pass arrays or strings. If you are not doing interop with native code, you should not have the need to pin at all.
Pinning an object fixes it in place so that the garbage collector cannot move it. While the pinning operation itself is inexpensive, it throws a bit of a wrench into the GC’s operation by increasing the likelihood of fragmentation. The garbage collector tracks those pinned objects so that it can use the free spaces between them, but if you have excessive pinning, it can still cause fragmentation and heap growth.
Pinning can be either explicit or implicit. Explicit pinning is performed with use of a GCHandle of type GCHandleType.Pinned or the fixed keyword and must be inside code marked as unsafe. The difference between using fixed or a handle is analogous to the difference between using and explicitly calling Dispose. fixed/using is more convenient, but cannot be used in asynchronous situations, whereas you can pass around a handle and dispose of it in the callback.
Implicit pinning is more common, but can be harder to see and more difficult to remove. The most obvious source of pinning will be any objects passed to unmanaged code via Platform Invoke (P/Invoke). This is not just your own code—managed APIs that you call can, and often do, call native code, which will require pinning.
The CLR will also have pinned objects in its own data structures, but these should normally not be a concern.
Ideally, you should eliminate as much pinning as you can. If you cannot quite do that, follow the same rules for short-lived managed objects: keep lifetime as short as possible. If objects are only pinned briefly then there is less chance for them to affect the next garbage collection. You also want to avoid having very many pinned objects at the same time. Pinning objects located in gen 2 or the LOH is generally fine because these objects are unlikely to move anyway. This can lead to a strategy of either allocating large buffers on the large object heap and giving out portions of them as needed, or allocating small buffers on the small object heap, but before pinning, ensure they are promoted to gen 2. This takes a bit of management on your part, but it can completely avoid the issue of having pinned buffers during a gen 0 GC.
- Avoid Finalizers
Never implement a finalizer unless it is required. Finalizers are code, triggered by the garbage collector to cleanup unmanaged resources. They are called from a single thread, one after the other, and only after the garbage collector declares the object dead after a collection. This means that if your class implements a finalizer, you are guaranteeing that it will stay in memory even after the collection that should have killed it. This decreases overall GC efficiency and ensures that your program will dedicate CPU resources to cleaning up your object.
If you do implement a finalizer, you must also implement the IDisposable interface to enable explicit cleanup, and call GC.SuppressFinalize(this) in the Dispose method to remove the object from the finalization queue. As long as you call Dispose before the next collection, then it will clean up the object properly without the need for the finalizer to run. The following example correctly demonstrates this pattern.
class Foo : IDisposable
{
~Foo()
{
Dispose(false);
}
public void Dispose()
{
Dispose(true);
GC.SuppressFinalize(this);
}
protected virtual void Dispose(bool disposing)
{
if (disposing)
{
this.managedResource.Dispose();
}
// Cleanup unmanaged resourced
UnsafeClose(this.handle);
// If the base class is IDisposable object
// make sure you call:
//base.Dispose(disposing);
}
}
See http://www.writinghighperf.net/go/15 for more information about the Dispose Pattern and finalization.
Note Some people think that finalizers are guaranteed to run. This is generally true, but not absolutely so. If a program is force-terminated then no more code runs and the process dies immediately. There is also a time limit to how long all of the finalizers are given on process shutdown. If your finalizer is at the end of the list, it may be skipped. Moreover, because finalizers execute sequentially, if another finalizer has an infinite loop bug in it, then no finalizers after it will ever run. While finalizers are not run on a GC thread, they are triggered by a GC so if you have no collections, the finalizers will not run. Therefore, you should not rely on finalizers to clean up state external to your process.
- Avoid Large Object Allocations
The boundary for large object allocations was set at 85,000 bytes by doing a statistical analysis of programs of the day. Any object of that size or greater was judged to be “large” and go on a separate heap.
You want to avoid allocations on the large object heap as much as possible. Not only is collecting garbage from this heap more expensive, it is more likely to fragment, causing unbounded memory increases over time.
To avoid these problems, you need to strictly control what your program allocates on the large object heap. What does go there should last for the lifetime of your program and be reused as necessary in a pooling scheme.
The LOH does not automatically compact, but you may tell it to do so programmatically starting with .NET 4.5.1. However, you should use this only as a last resort, as it will cause a very long pause. Before explaining how to do that, I will explain how to avoid getting into that situation in the first place.
- Avoid Copying Buffers
You should always avoid copying data whenever you can. For example, suppose you have read file data into a MemoryStream (preferably a pooled one if you need large buffers). Once you have that memory allocated, treat it as read-only and every component that needs to access it will read from the same copy of the data.
If you need to represent a sub-range of the entire buffer, use the ArraySegment<T> class to represent just a portion of the underlying byte[] buffer. This ArraySegment can be passed around to APIs independent of the original stream, and you can even attach a new MemoryStream to just that segment. Throughout all of this, no copy of the data has been made.
var memoryStream = new MemoryStream();
var segment = new ArraySegment<byte>(memoryStream.GetBuffer(), 100, 1024);
...
var blockStream = new MemoryStream(segment.Array,
segment.Offset,
segment.Count);
The biggest problem with copying memory is not the CPU necessarily, but the GC. If you find yourself needing to copy a buffer, then try to copy it into another pooled or existing buffer to avoid any new memory allocations.
- Pool Long-Lived and Large Objects
Remember the cardinal rule from earlier: Objects live very briefly or forever. They either go away in gen 0 collections or last forever in gen 2. Some objects are essentially static—they are created and last the lifetime of the program naturally. Other objects do not obviously need to last forever, but their natural lifetime in the context of your program ensures they will live longer than the period of a gen 0 (and maybe gen 1) garbage collection. These types of objects are candidates for pooling. While effectively a manual memory strategy, this does actually work well in this situation. Another strong candidate for pooling is any object that you allocate on the LOH heap, typically collections.
There is no single way to pool and there is no standard pooling API you can rely on. It really is up to you to develop a way that works for your application and the specific objects you need to pool.
One way to think about poolable objects is that you are turning a normally managed resource (memory) into something that you have to manage explicitly. .NET already has a pattern for dealing with finite managed resources: the IDisposable pattern. See earlier in this chapter for the proper implementation of this pattern. A reasonable design is to derive a new type and have it implement IDisposable, where the Dispose method puts the pooled object back in the pool. This will be a strong clue to users of that type that they need to treat this resource specially.
Implementing a good pooling strategy is not trivial and can depend entirely on how your program needs to use it, and what types of objects need to be pooled. Here is some code that shows one example of a simple pooling class to give you some idea of what is involved. This code is from the PooledObjects sample program.
interface IPoolableObject : IDisposable
{
int Size { get; }
void Reset();
void SetPoolManager(PoolManager poolManager);
}
class PoolManager
{
private class Pool
{
public int PooledSize { get; set; }
public int Count { get { return this.Stack.Count; } }
public Stack<IPoolableObject> Stack { get; private set; }
public Pool()
{
this.Stack = new Stack<IPoolableObject>();
}
}
const int MaxSizePerType = 10 * (1 << 10); // 10 MB
Dictionary<Type, Pool> pools =
new Dictionary<Type, Pool>();
public int TotalCount
{
get
{
int sum = 0;
foreach (var pool in this.pools.Values)
{
sum += pool.Count;
}
return sum;
}
}
public T GetObject<T>()
where T : class, IPoolableObject, new()
{
Pool pool;
T valueToReturn = null;
if (pools.TryGetValue(typeof(T), out pool))
{
if (pool.Stack.Count > 0)
{
valueToReturn = pool.Stack.Pop() as T;
}
}
if (valueToReturn == null)
{
valueToReturn = new T();
}
valueToReturn.SetPoolManager(this);
return valueToReturn;
}
public void ReturnObject<T>(T value)
where T : class, IPoolableObject, new()
{
Pool pool;
if (!pools.TryGetValue(typeof(T), out pool))
{
pool = new Pool();
pools[typeof(T)] = pool;
}
if (value.Size + pool.PooledSize < MaxSizePerType)
{
pool.PooledSize += value.Size;
value.Reset();
pool.Stack.Push(value);
}
}
}
class MyObject : IPoolableObject
{
private PoolManager poolManager;
public byte[] Data { get; set; }
public int UsableLength { get; set; }
public int Size
{
get { return Data != null ? Data.Length : 0; }
}
void IPoolableObject.Reset()
{
UsableLength = 0;
}
void IPoolableObject.SetPoolManager(
PoolManager poolManager)
{
this.poolManager = poolManager;
}
public void Dispose()
{
this.poolManager.ReturnObject(this);
}
}
It may seem a burden to force pooled objects to implement a custom interface, but apart from convenience, this highlights a very important fact: In order to use pooling and reuse objects, you must be able to fully understand and control them. Your code must reset them to a known, safe state every time they go back into the pool. This means you should not naively pool 3rd-party objects directly. By implementing your own objects with a custom interface, you are providing a very strong signal that the objects are special. You should especially be wary of pooling objects from the .NET Framework.
It is particularly tricky pooling collections because of their nature—you do not want to destroy the actual data storage (that is the whole point of pooling, after all), but you must be able to signify an empty collection with available space. Thankfully, most collection types implement both Length and Capacity parameters that make this distinction. Given the dangers of pooling the existing .NET collection types, it is better if you implement your own collection types using the standard collection interfaces such as IList<T>, ICollection<T>, and others. See Chapter 6 for general guidance on creating your own collection types.
An additional strategy is to have your poolable types implement a finalizer as a safety mechanism. If the finalizer runs, it means that Dispose was never called, which is a bug. You can choose to write something to the log, crash, or otherwise signal the problem.
Remember that a pool that never dumps objects is indistinguishable from a memory leak. Your pool should have a bounded size (in either bytes or number of objects) and once that has been exceeded, it should drop objects for the GC to clean up. Ideally, your pool is large enough to handle normal operations without dropping anything and the GC is only needed for brief spikes of activity. Depending on the size and number of objects contained in your pool, dropping them may lead to long, full GCs. It is important to make sure your pool is tunable for your situation.
Story I do not usually run to pooling as a default solution. As a general-purpose mechanism, it is clunky and error-prone. However, you may find that your application will benefit from pooling of just a few types. In one application that suffered from too many LOH allocations, we discovered that if we pooled a single type of object, we could eliminate 99% of all problems with the LOH. This was MemoryStream, which we used for serialization and transmitting bits over the network. The actual implementation is more complex than just keeping a queue of MemoryStream objects because of the need to avoid fragmentation, but conceptually, that is exactly what it is. Every time a MemoryStream object was disposed, it was put back in the pool for reuse.
- Reduce Large Object Heap Fragmentation
If you cannot completely avoid large object heap allocations, then you want to do your best to avoid fragmentation.
The LOH can grow indefinitely if you are not careful, but it is mitigated by the free list. To take advantage of this free list, you want to increase the likelihood that memory allocations can be satisfied from holes in the heap.
One way to do this is to ensure that all allocations on the LOH are of uniform size, or at least multiples of some standard size. For example, a common need for LOH allocations is for buffer pools. Rather than have a hodge-podge of buffer sizes, ensure that they are all the same size, or in multiples of some well-known number such as one megabyte. This way, if one of the buffers does need to get garbage collected, there is a high likelihood that the next buffer allocation can fill its spot rather than going to the end of the heap.
Story To continue the previous story about pooled MemoryStreams, the first implementation of PooledMemoryStream pooled the streams as a whole and allowed the buffers to grow to whatever size they needed. This used the underlying MemoryStream’s buffer growth algorithm, which doubles the buffer when capacity is exceeded. This solved many of the LOH woes, but left us with a horrible fragmentation problem. The second iteration threw that away in favor of pooling individual byte[] buffers, each of 128 KB, which were chained together to form a virtual buffer, which the stream abstracted. We had separate pools for larger buffers in multiples of 1 MB, up to 8 MB. This new implementation dramatically reduced our fragmentation problem, with a tradeoff. We occasionally had to copy multiple 128KB buffers into a single 1 MB buffer when someone needed a consecutive buffer, but since everything was pooled, this was worth it.
- Force Full GCs in Some Circumstances
In nearly all cases, you should not force collections to happen outside of their normal schedule as determined by the GC itself. Doing so disrupts the automatic tuning the garbage collector performs and may lead to worse behavior overall. However, there are some considerations in a high-performance system that may cause you to reconsider this advice in very specific situations.
In general, it may be beneficial to force a GC to occur during a more optimal time to avoid a GC occurring during a worse time later on. Note that we are only talking about the expensive, ideally rare, full GCs. Gen 0 and gen 1 GCs can and should happen frequently to avoid building up a too-large gen 0 size.
Some situations may merit a forced collection:
- You are using low latency GC mode. In this mode, heap size can grow and you will need to determine appropriate points to perform a full collection. See the section earlier in this chapter about low latency GC.
- You occasionally make a large number of allocations that will live for a long time (forever, ideally). It makes sense to get these objects into gen 2 as quickly as possible. If these objects replace other objects that will now become garbage, you can just get rid of them immediately with a forced collection.
- You are in a state where you need to compact the large object heap because of fragmentation. See the section about large object heap compaction.
Situations 1 and 2 are all about avoiding full GCs during specific times by forcing them at other times. Situation 3 is about reducing your overall heap size if you have significant fragmentation on the LOH. If your scenario does not fit into one of those categories, you should not consider this a useful option.
To perform a full collection, call the GC.Collect method with the generation of the collection you want it to perform. Optionally, you can specify a GCCollectionMode enumeration argument to tell the GC to decide for itself whether to do the collection. There are three possible values:
- Default—Currently, Forced.
- Forced—Tells the garbage collector to start the collection immediately.
- Optimized—Allows the garbage collector to decide if now is a good time to run.
GC.Collect(2);
// equivalent to:
GC.Collect(2, GCCollectionMode.Forced);
Story This exact situation existed on a server that took user queries. Every few hours we needed to reload over a gigabyte of data, replacing the existing data. Since this was an expensive operation and we were already reducing the number of requests the machine was receiving, we also forced two full GCs after the reload happened. This removed the old data and ensured that everything allocated in gen 0 either got collected or made it to gen 2 where it belonged. Then, once we resumed a full query load, there would not be a huge, full GC to affect the queries.
- Compact the Large Object Heap On-Demand
Even if you do pooling, it is still possible that there are allocations you cannot control and the large object heap will become fragmented over time. Starting in .NET 4.5.1, you can tell the GC to compact the LOH on the next full collection.
GCSettings.LargeObjectHeapCompactionMode =
GCLargeObjectHeapCompactionMode.CompactOnce;
Depending on the size of the LOH, this can be a slow operation, up to multiple seconds. You may want to put your program in a state where it stops doing real work and force an immediate collection with the GC.Collect method.
This setting only affects the next full GC that happens. Once the next full collection occurs, GCSettings.LargeObjectHeapCompactionMode resets automatically to GCLargeObjectHeapCompactionMode.Default.
Because of the expense of this operation, I recommend you reduce the number of LOH allocations to as little as possible and pool those that you do make. This will significantly reduce the need for compaction. View this feature as a last resort and only if fragmentation and very large heap sizes are an issue.
- Get Notified of Collections Before They Happen
If your application absolutely should not be impacted by gen 2 collections, then you can tell the GC to notify you when a full GC is approaching. This will give you a chance to stop processing temporarily, perhaps by shunting requests off the machine, or otherwise putting the application into a more favorable state.
It may seem like this notification mechanism is the answer to all GC woes, but I recommend extreme caution. You should only implement this after you have optimized as much as you can in other areas. You can only take advantage of GC notifications if all of the following statements are true:
- A full GC is so expensive that you cannot afford to endure a single one during normal processing.
- You are able to turn off processing for the application completely. (Perhaps other computers or processes can do the work meanwhile.)
- You can turn off processing quickly (so you do not waste more time stopping processing than actually performing the GC).
- Gen 2 collections happen rarely enough to make this worth it.
Gen 2 collections will happen rarely only if you have large object allocations minimized and little promotion beyond gen 0, so it will still take a fair amount of work to get to the point where you can reliably take advantage of GC notifications.
Unfortunately, because of the imprecise nature of GC triggering, you can only specify the pre-trigger time in an approximate way with a number in the range 1 - 99. With a number that is very low, you will be notified much closer to when the GC will happen, but you risk having the GC occur before you can react to it. With a number that is too high, the GC may be quite far away and you will get a notification far too frequently, which is quite inefficient. It all depends on your allocation rate and overall memory load. Note that you specify two numbers: one for the gen 2 threshold and one for the large object heap threshold. As with other features, this notification is a best effort by the garbage collector. The garbage collector never guarantees you can avoid doing a collection.
To use this mechanism, follow these general steps:
- Call the GC.RegisterForFullGCNotification method with the two threshold values.
- Poll the GC with the GC.WaitForFullGCApproach method. This can wait forever or accept a timeout value.
- If the WaitForFullGCApproach method returns Success, put your program in a state acceptable for a full GC (e.g., turn off requests to the machine).
- Force a full collection yourself by calling the GC.Collect method.
- Call GC.WaitForFullGCComplete (again with an optional timeout value) to wait for the full GC to compete before continuing.
- Turn requests back on.
- When you no longer want to receive notifications of full GCs, call the GC.CancelFullGCNotification method.
Because this requires a polling mechanism, you will need to run a thread that can do this check periodically. Many applications already have some sort of “housekeeping” thread that performs various actions on a schedule. This may be an appropriate task, or you can create a separate dedicated thread.
Here is a full example from the GCNotification sample project demonstrating this behavior in a simple test application that allocates memory continuously. See the accompanying source code project to test this.
class Program
{
static void Main(string[] args)
{
const int ArrSize = 1024;
var arrays = new List<byte[]>();
GC.RegisterForFullGCNotification(25, 25);
// Start a separate thread to wait for GC notifications
Task.Run(()=>WaitForGCThread(null));
Console.WriteLine("Press any key to exit");
while (!Console.KeyAvailable)
{
try
{
arrays.Add(new byte[ArrSize]);
}
catch (OutOfMemoryException)
{
Console.WriteLine("OutOfMemoryException!");
arrays.Clear();
}
}
GC.CancelFullGCNotification();
}
private static void WaitForGCThread(object arg)
{
const int MaxWaitMs = 10000;
while (true)
{
// There is also an overload of WaitForFullGCApproach
// that waits indefinitely
GCNotificationStatus status =
GC.WaitForFullGCApproach(MaxWaitMs);
bool didCollect = false;
switch (status)
{
case GCNotificationStatus.Succeeded:
Console.WriteLine("GC approaching!");
Console.WriteLine(
"-- redirect processing to another machine -- ");
didCollect = true;
GC.Collect();
break;
case GCNotificationStatus.Canceled:
Console.WriteLine("GC Notification was canceled");
break;
case GCNotificationStatus.Timeout:
Console.WriteLine("GC notification timed out");
break;
}
if (didCollect)
{
do
{
status = GC.WaitForFullGCComplete(MaxWaitMs);
switch (status)
{
case GCNotificationStatus.Succeeded:
Console.WriteLine("GC completed");
Console.WriteLine(
"-- accept processing on this machine again --");
break;
case GCNotificationStatus.Canceled:
Console.WriteLine(
"GC Notification was canceled");
break;
case GCNotificationStatus.Timeout:
Console.WriteLine(
"GC completion notification timed out");
break;
}
// Looping isn't necessary, but it's useful if you want
// to check other state before waiting again.
} while (status == GCNotificationStatus.Timeout);
}
}
}
}
Another possible reason is to compact the LOH heap, but you could trigger this based on memory usage instead, which may be more appropriate.
- Use Weak References for Caching
Weak references are references to an object that still allow the garbage collector to clean up the object. This is in contrast to strong references, which prevent collection completely (for that object). They are mostly useful for caching expensive objects that you would like to keep around, but are willing to let go if there is enough memory pressure.
WeakReference weakRef = new WeakReference(myExpensiveObject);
…
// Create a strong reference to the object,
// now no longer eligible for GC
var myObject = weakRef.Target;
if (myObject != null)
{
myObject.DoSomethingAwesome();
}
WeakReference has an IsAlive property, but it is only useful to determine if the object is dead, not if it is alive. If you check IsAlive and see that it is true, you are in a race with the garbage collector, which could collect the object after you check the IsAlive property. Just copy the object reference to a strong reference of your own and check it there.
A very good way to use WeakReference is part of a cache where objects can start by being held by a strong reference and after enough time of not being used, they can be demoted to being held by weak references, which may eventually disappear.
- Measuring and Investigating GC Performance
In this section, you will learn many tips and techniques to investigate what is happening on the GC heap. In many cases, multiple tools can give you the same information. I will endeavor to describe the use of a few in each scenario, where applicable.
- Performance Counters
.NET supplies a number of Windows performance counters, all in the .NET CLR Memory category. All of these counters except for Allocated Bytes/sec are updated at the end of a collection. If you notice values getting stuck, it is likely because collections are not happening very often.
- # Bytes in all Heaps—Sum of all heaps, except generation 0 (see the description for Gen 0 heap size).
- # GC Handles—Number of handles in use.
- # Gen 0 Collections—Cumulative number of generation 0 collections since process start. Note that this counter is incremented for generation 1 and 2 collections as well because higher generation collections always imply collections of the lower generations as well.
- # Gen 1 Collections—Cumulative number of gen 1 collections since process start. Note that this counter is incremented for generation 2 collections as well because a generation 2 collection implies a generation 1 collection.
- # Gen 2 Collections—Cumulative number of generation 2 collections since process start.
- # Induced GC—Number of times GC.Collect was called to explicitly start garbage collection.
- # of Pinned Objects—Number of pinned objects the garbage collector observes during collection.
- # of Sink Blocks in use—Each object has a header that can store limited information, such as a hash code, or synchronization information. If there is any contention for use of this header, a sink block is created. These blocks are also used for interop metadata. A high counter value here can indicate lock contention.
- # Total committed Bytes—Number of bytes the garbage collector has allocated that are actually backed by the paging file.
- # Total reserved Bytes—Number of bytes reserved by garbage collector, but not yet committed.
- % Time in GC—Percentage of time the processor has spent in the GC threads compared to the rest of the process since the last collection. This counter does not account for background GC.
- Allocated Bytes/sec—Number of bytes allocated on a GC heap per second. This counter is not updated continuously, but only when a garbage collection starts.
- Finalization Survivors—Number of finalizable objects that survived a collection because they are waiting for finalization (which only happens in generation 1 collections). Also, see the Promoted Finalization-Memory from Gen 0 counter.
- Gen 0 heap size—Maximum number of bytes that can be allocated in generation 0, not the actual number of bytes allocated.
- Gen 0 Promoted Bytes/Sec—The rate of promotion from generation 0 to generation 1. You want this number to be as low as possible, indicating short memory lifetimes.
- Gen 1 heap size—Number of bytes in generation 1, as of the last garbage collection.
- Gen 1 Promoted Bytes/Sec—Rate of promotion from generation 1 to generation 2. A high number here indicates memory having a very long lifetime, and good candidates for pooling.
- Gen 2 heap size—Number of bytes in generation 2, as of the last garbage collection.
- Large Object Heap Size—Number of bytes on the large object heap.
- Promoted Finalization-Memory from Gen 0—Total number of bytes that were promoted to generation 1 because an object somewhere in their tree is awaiting finalization. This is not just the memory from finalizable objects directly, but also the memory from any references those objects hold.
- Promoted Memory from Gen 0—Number of bytes promoted from generation 0 to generation 1 at the last collection.
- Promoted Memory from Gen 1—Number of bytes promoted from generation 1 to generation 2 at the last collection.
- ETW Events
The CLR publishes numerous events about GC behavior. In most cases, you can rely on the tools to analyze these in aggregate for you, but it is still useful to understand how this information is logged in case you need to track down specific events and relate them to other events in your application. You can examine these in detail in PerfView with the Events view. Here are some of the most important:
- GCStart—Garbage collection has started. Fields include:
- Count—The number of collections that have occurred since the process began.
- Depth—Which generation is being collected.
- Reason—Why the collection was triggered.
- Type—Blocking, background, or blocking during background.
- GCEnd—Garbage collection has ended. Fields include:
- Count, Depth—Same as for GCStart.
- GCHeapStats—Shows stats at the end of a garbage collection.
- There are many fields, describing all aspects of the heap such as generation sizes, promoted bytes, finalization, handles, and more.
- GCCreateSegment—A new segment was created. Fields include:
- Address—Address of the segment
- Size—Size of the segment
- Type—Small or large object heap
- GCFreeSegment—A segment was released. Just one field:
- Address—Address of the segment
- GCAllocationTick—Emitted every time about 100KB (cumulative) was allocated. Fields include:
- AllocationSize—Exact size of the allocation that triggered the event.
- Kind—Small or large object heap allocation.
There are other events as well, such as for finalizers and thread control during GC. You can find more information about these at http://www.writinghighperf.net/go/16.
- How Long Does A Collection Take?
The GC records many events about its operation. You can use PerfView to examine these events in a very efficient way.
To see statistics on GC, start the AllocateAndRelease sample program.
Start PerfView and follow these steps:
- Menu Collect | Collect (Alt+C).
- Expand Advanced Options. You can optionally turn off all event categories except GC Only, but for now just leave the default selection, as GC events are included in .NET events.
- Check No V3.X NGEN Symbols. (This will make symbol resolution faster.)
- Click Start.
- Wait for a few minutes while it measures the process’s activity. (If collecting for more than a few minutes, you may want to turn off CPU events.)
- Click Stop Collection.
- Wait for the files to finish merging.
- In the resulting view tree, double-click on the GCStats node, which will open up a new view.
- Find the section for your process and look at the summary table, which will show you average pause time per generation, how many GCs there were, the number of bytes allocated, and much more. Here is a sample table:
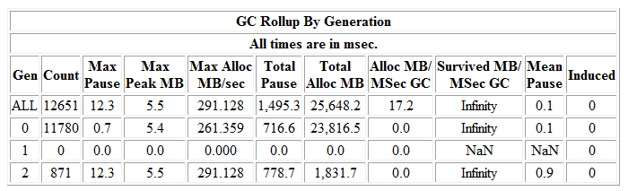
Figure 2-1. The GCStats table for the AllocateAndRelease sample program. This shows you the number of GCs that occurred as well as interesting stats like the mean/max pause times, and allocation rates.
- Where Are My Allocations Occurring?
PerfView is a good option to find out which objects are being allocated and how often.
- With PerfView, collect either .NET or just GC Only events.
- Once completed, open the GC Heap Alloc Stacks view and select the desired process from the process list. (For a simple example, use the AllocateAndRelease sample program) from the process list.)
- On the By Name tab, you will see types sorted in order of total allocation size. Double-clicking a type name will take you to the Callers tab, which shows you the stacks that made the allocations.
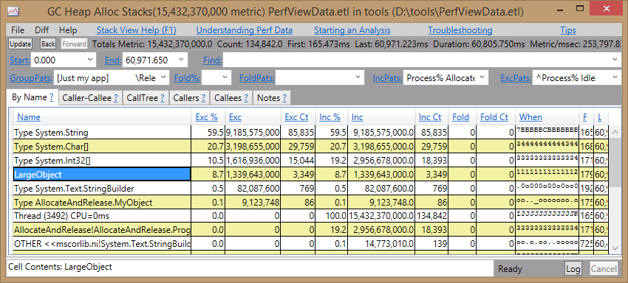
Figure 2-2. The GC Heap Alloc Stacks view shows the most common allocations in your process. The LargeObject entry is a pseudo node; double-clicking on it will reveal the actual objects allocated on the LOH.
See Chapter 1 for more information on using PerfView’s interface to get the most out of the view.
Using the above information, you should be able to find the stacks for all the allocations that occur in the test program, and their relative frequency. For example, in my trace, string allocation accounts for roughly 59.5% of all memory allocations.
You can also use CLR Profiler to find this information and display it in a number of ways.
Once you have collected a trace and the Summary window opens, click on the Allocation Graph button to open up a graphical trace of object allocations and the methods responsible for them.
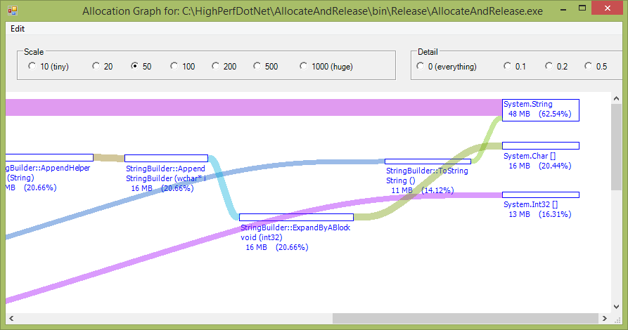
Figure 2-3. CLR Profiler's visual depiction of object allocation stacks quickly points you to objects you need to be most concerned about.
The Visual Studio profiler can also get this information for you and display it like it does CPU profile data.
The most frequently allocated objects are also the ones most likely to be triggering garbage collections. Reduce these allocations and the rate of GCs will go down.
- Which Objects Are Being Allocated On The Large Object Heap?
Understanding which objects are being allocated on the large object heap is critical to ensuring a well-performing system. The very first rule discussed in this chapter states that all objects should be cleaned up in a gen 0 collection, or they need to live forever.
Large objects are only cleaned up by an expensive gen 2 GC, so it violates that rule out of the gate.
To find out which objects are on the LOH, use PerfView and follow the previously given instructions for getting a GC event trace. In the resulting GC Heap Alloc Stacks view, in the By Name tab, you will find a special node that PerfView creates called “LargeObject.” Double click on this to go to the Callers view, which shows which “callers” LargeObject has. In the sample program, they are all Int32 arrays. Double-clicking on those in turn will show where the allocations occurred.
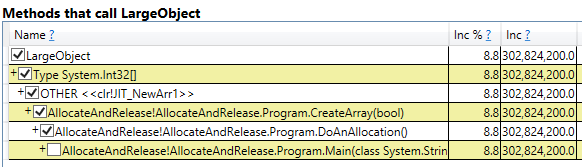
Figure 2-4. PerfView can show large objects and their types with the stacks that allocated them.
CLR Profiler can also show you the types of objects on the large object heap. After you get a trace, click on the View Objects by Address button, which will bring up a simple graph of the labeled heaps with color-coded objects.
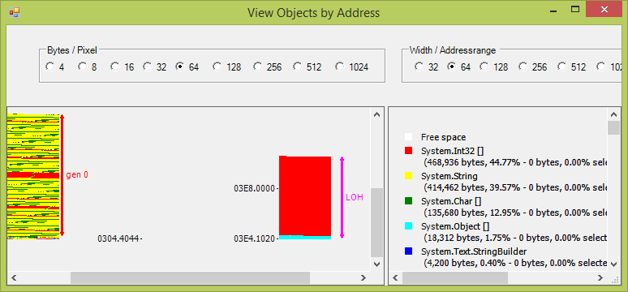
Figure 2-5. CLR Profiler can visually show you which objects are allocated on the LOH heap.
To see the allocation stack for these objects, right click on the type in the graph you want to see and select Show Who Allocated. This will bring up a window displaying a visual representation of the allocation graph, a colorful version of what PerfView will show you.
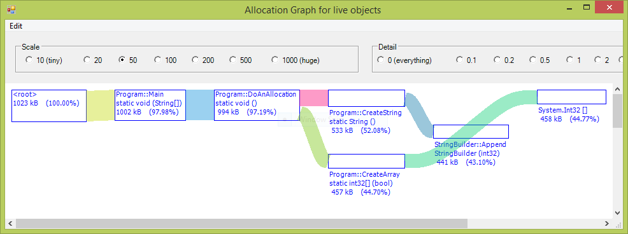
Figure 2-6. CLR Profiler shows a visual equivalent of a call stack for allocations.
- What Are All The Objects On My Heap?
One option is to use PerfView to dump the entire heap and show you the relationship of object ownership. PerfView will use the stacks view to display this for you, but there is a subtle difference from other uses. The stacks you see in the GC Heap Alloc Stacks view, for example, are stacks of who allocated the memory, while the GC Heap Dump view shows you stacks of object references—that is, who currently “owns” the object.
To use this feature, in PerfView:
- From the Memory menu, select Take Heap Snapshot. Note that this does not pause the process (unless you check the option to Freeze), but it does have a significant impact on the process’s performance.
- Highlight the desired process in the resulting dialog.
- Click Dump GC Heap.
- Wait until collection is finished, then close the window.
- Open the file from the PerfView file tree (it may automatically open for you when you close the collection window).
Consider the LargeMemoryUsage sample program:
class Program
{
const int ArraySize = 1000;
static object[] staticArray = new object[ArraySize];
static void Main(string[] args)
{
object[] localArray = new object[ArraySize];
Random rand = new Random();
for (int i = 0; i < ArraySize; i++)
{
staticArray[i] = GetNewObject(rand.Next(0, 4));
localArray[i] = GetNewObject(rand.Next(0, 4));
}
Console.WriteLine(
"Use PerfView to examine heap now. Press any key to exit...");
Console.ReadKey();
// This will prevent localArray from being
// garbage collected before you take the snapshot
Console.WriteLine(staticArray.Length);
Console.WriteLine(localArray.Length);
}
private static Base GetNewObject(int type)
{
Base obj = null;
switch (type)
{
case 0: obj = new A(); break;
case 1: obj = new B(); break;
case 2: obj = new C(); break;
case 3: obj = new D(); break;
}
return obj;
}
}
class Base
{
private byte[] memory;
protected Base(int size) { this.memory = new byte[size]; }
}
class A : Base { public A() : base(1000) { } }
class B : Base { public B() : base(10000) { } }
class C : Base { public C() : base(100000) { } }
class D : Base { public D() : base(1000000) { } }
You should see a table like this:
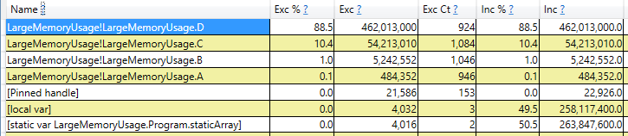
Figure 2-7. A PerfView trace of the largest objects in the heap.
It tells you immediately that D accounts for 88% of the program’s memory at 462 MB with 924 objects. You can also see local variables are holding on to 258 MB of memory and the staticArray object is holding onto 263 MB of memory.
Double-clicking the entry for the D class switches to the Referred-From view, which looks like this:
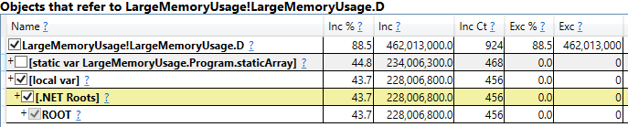
Figure 2-8. PerfView shows stacks in a tabular format, which is easily understandable once you get used to it.
This view clearly shows that the D objects belong to the staticArray variable and a local variable (those lose their names during compilation).
Visual Studio 2013 has a new Managed Heap Analysis view that is similar in spirit to PerfView. You can access it after opening a managed memory dump.
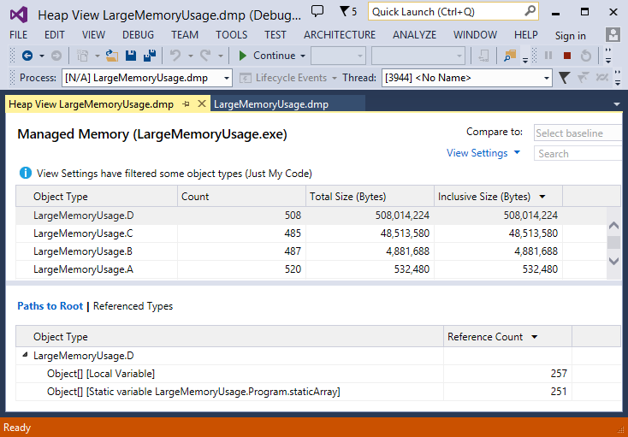
Figure 2-9. Visual Studio 2013 includes this heap analysis view, which works off of managed memory dumps.
You can also get a graphical view of the same information with CLR Profiler. While the program is running, click the Show Heap now button to capture a heap sample. It will produce a view like this:
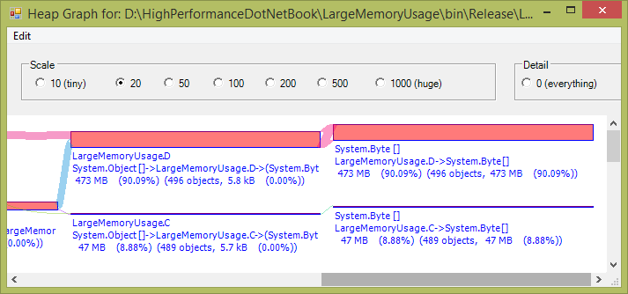
Figure 2-10. CLR Profiler shows you some of the same information as PerfView, but in a graphical format.
- Why Are My Objects Not Being Garbage Collected?
To see why an object is not being collected, you need to find out what is maintaining a reference to that object. The previous section about dumping the heap will tell you what is maintaining a reference to the objects you are interested in, and thus what is preventing garbage collection.
If you are interested in a particular object, you can use Windbg. Once you have the object’s address, you can use the !gcroot command:
0:003> !gcroot 02ed1fc0
HandleTable:
012113ec (pinned handle)
-> 03ed33a8 System.Object[]
-> 02ed1fc0 System.Random
Found 1 unique roots (run '!GCRoot -all' to see all roots).
To get the address of an object in Windbg, you can dump all of objects on the current stack with the !dso command, or use !DumpHeap to find objects of interest on heap, as in this example:
0:004> !DumpHeap -type LargeMemoryUsage.C
Address MT Size
021b17f0 007d3954 12
021b664c 007d3954 12
...
Statistics:
MT Count TotalSize Class Name
007d3954 475 5700 LargeMemoryUsage.C
Total 475 objects
!gcroot is often adequate, but it may miss some cases, in particular if your object is rooted from an older generation. For this, you will need to use the !findroots command.
In order for this command to work you first need to set a breakpoint in the GC, right before a collection is about to happen, which you can do by executing:
!findroots –gen 0
g
This sets a breakpoint right before the next gen 0 GC happens. It then loses effect and you will need to run the command again to break on the following GC.
Once the code breaks, you need to find the object you are interested in and execute this command:
!findroots 027624fc
If the object is already in a higher generation than the current collection generation, you will see output like this:
Object 027624fc will survive this collection:
gen(0x27624fc) = 1 > 0 = condemned generation.
If the object itself is in the current generation being collected, but it has roots from an older generation, you will see something like this:
older generations::Root: 027624fc (object)->
023124d4(System.Collections.Generic.List`1
[[System.Object, mscorlib]])
- What Objects Are Being Pinned?
As covered earlier, a performance counter will tell you how many pinned objects the GC encounters during a collection, but that will not help you determine which objects are being pinned.
Use the Pinning sample project, which pins things via explicit fixed statements and by calling some Windows APIs.
Use Windbg to view pinned objects with these commands (including sample output):
0:010> !gchandles
Handle Type Object Size Data Type
…
003511f8 Strong 01fa5dbc 52 System.Threading.Thread
003511fc Strong 01fa1330 112 System.AppDomain
003513ec Pinned 02fa33a8 8176 System.Object[]
003513f0 Pinned 02fa2398 4096 System.Object[]
003513f4 Pinned 02fa2178 528 System.Object[]
003513f8 Pinned 01fa121c 12 System.Object
003513fc Pinned 02fa1020 4420 System.Object[]
003514fc AsyncPinned 01fa3d04 64 System.Threading.OverlappedData
You will usually see lots of System.Object[] objects pinned. The CLR uses these arrays internally for things like statics and other pinned objects. In the case above, you can see one AsyncPinned handle. This object is related to the FileSystemWatcher in the sample project.
Unfortunately, the debugger will not tell you why something is pinned, but often you can examine the pinned object and trace it back to the object that is responsible for it.
The following Windbg session demonstrates tracing through object references to find higher-level objects that may give a clue to the origins of the pinned object. Follow the trail of bolded references.
0:010> !do 01fa3d04
Name: System.Threading.OverlappedData
MethodTable: 64535470
EEClass: 646445e0
Size: 64(0x40) bytes
File: C:windowsMicrosoft.NetassemblyGAC_32mscorlibv4.0_4.0.0.0__b77a5c561934e089mscorlib.dll
Fields:
MT Field Offset Type VT Attr Value Name
64927254 4000700 4 System.IAsyncResult 0 instance 020a7a60 m_asyncResult
64924904 4000701 8 ...ompletionCallback 0 instance 020a7a70 m_iocb
...
0:010> !do 020a7a70
Name: System.Threading.IOCompletionCallback
MethodTable: 64924904
EEClass: 6463d320
Size: 32(0x20) bytes
File: C:windowsMicrosoft.NetassemblyGAC_32mscorlibv4.0_4.0.0.0__b77a5c561934e089mscorlib.dll
Fields:
MT Field Offset Type VT Attr Value Name
649326a4 400002d 4 System.Object 0 instance 01fa2bcc _target
...
0:010> !do 01fa2bcc
Name: System.IO.FileSystemWatcher
MethodTable: 6a6b86c8
EEClass: 6a49c340
Size: 92(0x5c) bytes
File: C:windowsMicrosoft.NetassemblyGAC_MSILSystemv4.0_4.0.0.0__b77a5c561934e089System.dll
Fields:
MT Field Offset Type VT Attr Value Name
649326a4 400019a 4 System.Object 0 instance 00000000 __identity
6a699b44 40002d2 8 ...ponentModel.ISite 0 instance 00000000 site
...
While the debugger gives you the maximum power, it is cumbersome at best. Instead, you can use PerfView, which can simplify a lot of the drudgery.
With a PerfView trace, you will see a view called “Pinning at GC Time Stacks” that will show you stacks of the objects being pinned across the observed collections.
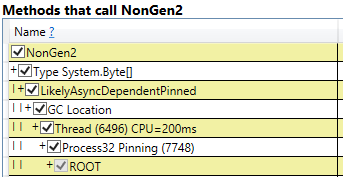
Figure 2-11. PerfView will show you information about what types of objects are pinned across a GC, as well as some information about its likely origin.
You can also approach pinning problems by looking at the free space holes created in the various heaps, which is covered in the next section.
- Where Is Fragmentation Occurring?
Fragmentation occurs when there are freed blocks of memory inside segments containing used blocks of memory. Fragmentation can occur at multiple levels, inside a GC heap segment, or at the virtual memory level for the whole process.
Fragmentation in gen 0 is usually not an issue, unless you have a very severe pinning problem where you have pinned so many objects and each block of free space is too small to fulfill any new allocations. This will cause the size of the small object heap to grow and more garbage collections will occur. Fragmentation is usually more of an issue in gen 2 or the large object heap, especially if you are not using background GC. You may see fragmentation rates that seem high, perhaps even 50%, but this is not necessarily an indication of a problem. Consider the size of the overall heap and if it is acceptable and not growing over time, you probably do not need to take action.
GC heap fragmentation is more likely and easy to diagnose. Start by understanding how to do this in Windbg.
Get a list of free blocks with !DumpHeap –type Free:
0:010> !DumpHeap -type Free
Address MT Size
02371000 008209f8 10 Free
0237100c 008209f8 10 Free
02371018 008209f8 10 Free
023a1fe8 008209f8 10 Free
023a3fdc 008209f8 22 Free
023abdb4 008209f8 574 Free
023adfc4 008209f8 46 Free
023bbd38 008209f8 698 Free
023bdfe0 008209f8 18 Free
023d19c0 008209f8 1586 Free
023d3fd8 008209f8 26 Free
023e578c 008209f8 2150 Free
...
For each block, figure out which heap segment it is in with !eeheap –gc
0:010> !eeheap -gc
Number of GC Heaps: 1
generation 0 starts at 0x02371018
generation 1 starts at 0x0237100c
generation 2 starts at 0x02371000
ephemeral segment allocation context: none
segment begin allocated size
02370000 02371000 02539ff4 0x1c8ff4(1871860)
Large object heap starts at 0x03371000
segment begin allocated size
03370000 03371000 03375398 0x4398(17304)
Total Size: Size: 0x1cd38c (1889164) bytes.
------------------------------
GC Heap Size: Size: 0x1cd38c (1889164) bytes.
Dump all of the objects in that segment, or within a narrow range around the free space.
0:010> !DumpHeap 0x02371000 02539ff4
Address MT Size
02371000 008209f8 10 Free
0237100c 008209f8 10 Free
02371018 008209f8 10 Free
02371024 713622fc 84
02371078 71362450 84
023710cc 71362494 84
02371120 713624d8 84
02371174 7136251c 84
023711c8 7136251c 84
0237121c 71362554 12
...
This is a manual and tedious process, but it does come in handy and you should understand how to do it. You can write scripts to process the output and generate the Windbg commands for you based on previous output, but CLR Profiler can show you the same information in a graphical, aggregated manner that may be good enough for your needs.
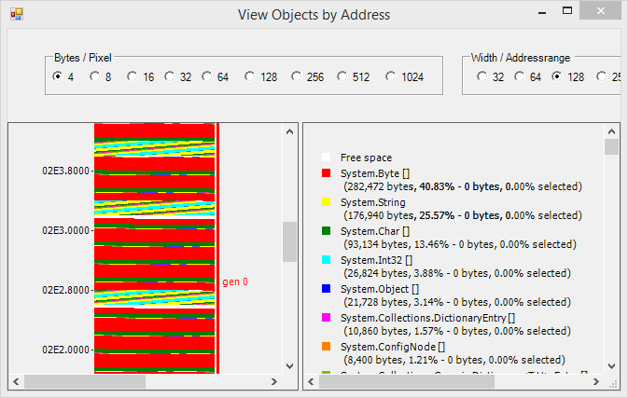
Figure 2-12. CLR Profiler can show you a visual representation of the heap that makes it possible to see what types of objects are next to free space blocks. In this image, the free space blocks are bordered by blocks of System.Byte[] and an assortment of other types.
You may also get virtual memory fragmentation, which can cause the unmanaged allocations to fail because they cannot find a range large enough to satisfy the memory request. This can include allocating a new GC heap segment, which means your managed memory allocations can also fail.
Virtual memory fragmentation is far more likely in 32-bit processes, where you are limited to just two gigabytes of address space for your program by default. The biggest symptom of this is an OutOfMemoryException. The easiest way to fix this is to convert your application to a 64-bit process and reap the 128-terabyte address space. If you cannot do this, your only choice is to become far more efficient in both unmanaged and managed memory allocations. You need to ensure that the heaps can be compacted, and you may need to implement significant pooling.
Use VMMap (part of SysInternals’ suite of utilities) to get a visual representation of your process. It will divide the heap into managed, native, and free regions. Selecting the Free portion will show you all segments currently marked as free. If the maximum size is smaller than your requested memory allocation, you will get an OutOfMemoryException.
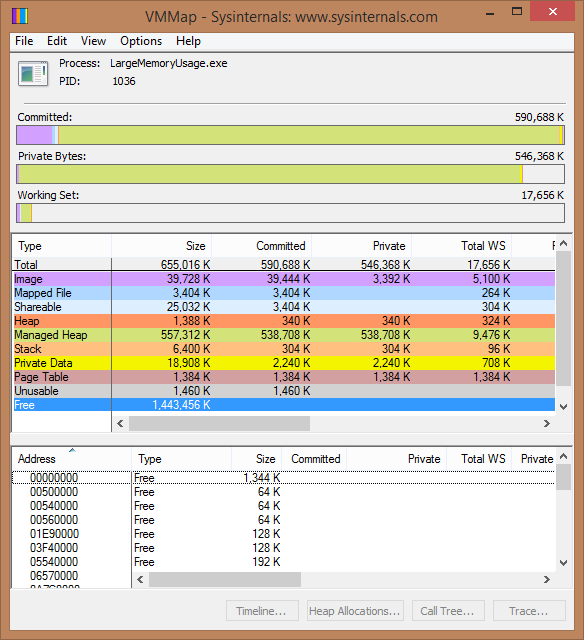
Figure 2-13. VMMap shows you a wealth of memory-related information, including the size of all the free blocks in the address range. In this case, the largest bloc is over 1.3 GB in size—plenty!
VMMap also has a fragmentation view that can show where these blocks fit in the overall process space.
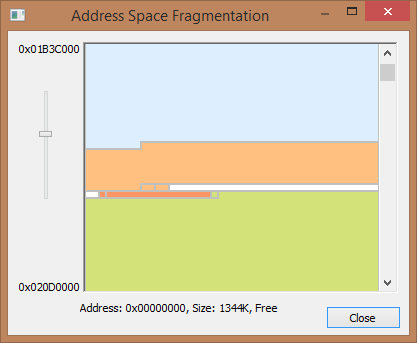
Figure 2-14. VMMap's fragmentation view shows free space in the context of other segments.
You can also retrieve this information in Windbg:
!address –summary
This command produces this output:
...
-- Largest Region by Usage -- Base Address -- Region Size --
Free 26770000 49320000 (1.144 Gb)
...
You can retrieve information about specific blocks with the command:
!address –f:Free
This produces output similar to:
BaseAddr EndAddr+1 RgnSize Type State Protect Usage
--------------------------------------------------------------
0 150000 150000 MEM_FREE PAGE_NOACCESS Free
- What Generation Is An Object In?
To find the current generation of a specific object, use Windbg. Once you obtain the address of the object of interest (say from !DumpStackObjects or !DumpHeap), use the !gcwhere command:
0:003> !gcwhere 02ed1fc0
Address Gen Heap segment begin allocated size
02ed1fc0 1 0 02ed0000 02ed1000 02fe5d4c 0x14(20)
You can also retrieve this information from code by using the GC.GetGeneration method and passing it the object in question.
- Which Objects Survive Gen 0?
The easiest way to see this is with CLR Profiler. Once you collect a trace, click on the Timeline button in the results summary dialog window. This will bring up a timeline of allocations, color-coded by type. The vertical axis is memory address. GC events are marked so you can see which objects disappear or stick around.
In the following screenshot, you can see a trace of the AllocateAndRelease sample program:
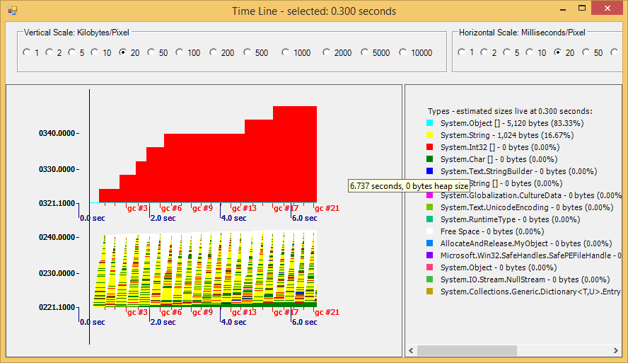
Figure 2-15. CLR Profiler's timeline view makes it easy to see which objects survive garbage collections.
Each GC is marked (gen 0 GCs are marked in red). In the bottom portion of the graph, you can see that many types of objects are being cleaned up on each GC, causing a familiar saw-tooth pattern. There is a slowly growing area of dark green, System.Char[], that is surviving these GCs and being promoted to gen 1. At the top of the graph you see a growing region of System.Int32[] allocations. This is the large object heap region, and since there have not been any gen 2 GCs yet, these have not been cleaned up yet.
While CLR Profiler is great for getting an overall picture and it can be your first step in diagnosing these types of problems, sometimes you will just need to get extremely detailed information, perhaps on specific objects. Or perhaps CLR Profiler does not work on your process because of its size or some other limiting factor. In this case, you can use Windbg to see precisely which objects are still around after a GC. With a little bit of scripting work you could even automate this analysis to give you an aggregate picture.
After you have attached Windbg to the process and loaded SOS, execute these commands:
!FindRoots –gen 0
g
This will set a breakpoint right before the next gen 0 collection begins. Once it breaks, you can send whatever commands you want to dump the objects on the heap. You can simply do:
!DumpHeap
This will dump every object on the heap, which may be excessive. Optionally, you can add the –stat parameter to limit output to a summary of the found objects (their counts, sizes, and types). However, if you want to limit your analysis to just gen 0, the !DumpHeap command allows you to specify an address range. This begs the question: How do you find the address range for the gen 0 heap? There is another SOS command that will give this to you. Recall the description of memory segments from the top of the chapter. A basic segment is laid out like this:

Note than Gen 0 is at the end of the segment, and its end is the segment’s end. Refer back to the beginning of this chapter for more information.
To get a list of heaps and segments, you can use the eeheap –gc command:
0:003> !eeheap -gc
Number of GC Heaps: 1
generation 0 starts at 0x02ef0400
generation 1 starts at 0x02ed100c
generation 2 starts at 0x02ed1000
ephemeral segment allocation context: none
segment begin allocated size
02ed0000 02ed1000 02fe5d4c 0x114d4c(1133900)
Large object heap starts at 0x03ed1000
segment begin allocated size
03ed0000 03ed1000 041e2898 0x311898(3217560)
Total Size: Size: 0x4265e4 (4351460) bytes.
------------------------------
GC Heap Size: Size: 0x4265e4 (4351460) bytes.
This command will give you a printout of each generation and each segment. The segment that contains gen 0 and gen 1 is called the ephemeral segment. !eeheap tells you the start of gen 0. To get the end of it, you merely need to find the segment that contains the start address. Each segment contains a number of addresses and the length. In the example above, the ephemeral segment starts at 02ed0000 and ends at 02fe5d4c. Therefore, the range of gen 0 on this heap is 02ef0400 - 02fe5d4c.
Now that you know this, you can put some limits on the DumpHeap command and print only the objects in gen 0:
!DumpHeap 02ef0400 02fe5d4c
Once you have done that, you will want to compare what happens as soon as the GC is complete. This is a little trickier. You will need to set a breakpoint on an internal CLR method. This method is called when the CLR is ready to resume managed code. If you are using workstation GC, call:
bp clr!WKS::GCHeap::RestartEE
For server GC:
bp clr!SVR::GCHeap::RestartEE
Once you have set the breakpoints, continue execution (F5 or the ‘g’ command). Once the GC is complete, the program will break again and you can repeat the !eeheap –gc and !DumpHeap commands.
Now you have two sets of outputs and you can compare them to see what changed and which objects are remaining after a GC. By using the other commands and techniques in this section, you can see who maintains a reference to that object.
Note If you use server GC, then remember there will be multiple heaps. To do this kind of analysis, you will need to repeat the commands for each heap. The !eeheap command will print information for every heap in the process.
- Who is Calling GC.Collect Explicitly?
In Windbg, set a managed breakpoint on the GC class’s Collect method:
!bpmd mscorlib.dll System.GC.Collect
Continue executing. Once the breakpoint is hit, to see the stack trace of who called the explicit collection, do:
!DumpStack
- What Weak References Are In My Process?
Because weak references are a type of GC handle, you can use the !gchandles command in Windbg to find them:
0:003> !gchandles
PDB symbol for clr.dll not loaded
Handle Type Object Size Data Type
006b12f4 WeakShort 022a3c8c 100 System.Diagnostics.Tracing...
006b12fc WeakShort 022a3afc 52 System.Threading.Thread
006b10f8 WeakLong 022a3ddc 32 Microsoft.Win32.UnsafeNati...
006b11d0 Strong 022a3460 48 System.Object[]
...
Handles:
Strong Handles: 11
Pinned Handles: 5
Weak Long Handles: 1
Weak Short Handles: 2
The difference between Weak Long and Weak Short is mostly unimportant for this discussion, but Weak Long handles track whether a finalized object has been resurrected. Resurrection can occur when an object has been finalized, and rather than letting the GC clean it up, you decide to reuse it. This can be relevant for pooling scenarios. However, it is possible to do pooling without finalization, and given the complexities of resurrection, just avoid this in favor of deterministic methods.
- Summary
You need to understand garbage collection in-depth to truly optimize your applications. Choose the right configuration settings for your application, such as server GC if your application is the only one running on the machine. Ensure that object lifetime is short, allocation rates are low, and that any objects that must live longer than the average GC frequency are pooled or otherwise kept alive in gen 2 forever.
Avoid pinning and finalizers if possible. Any LOH allocations should be pooled and kept around forever to avoid full GCs. Reduce LOH fragmentation by keeping objects a uniform size and occasionally compacting the heap on-demand. Consider GC notifications to avoid having full collections impact application processing at inopportune times.
The garbage collector is a deterministic component and you can control its operation by closely managing your object allocation rate and lifetime. You are not giving up control by adopting .NET’s garbage collector, but it does require a little more subtlety and analysis.