
- Choosing What to Measure
Before collecting numbers, you need to know what you intend to measure. This sounds obvious, but it is actually a lot more involved than you may think. Consider memory. You obviously want to measure memory usage and minimize it. But which kind of memory? Private working set? Commit size? Paged pool? Peak working set? .NET heap size? Large object heap? Individual processor heaps to ensure they’re balanced? Some other variant? For tracking memory usage over time, do you want the average for an hour, the peak? Does memory usage correlate with processing load size? As you can see, there are easily a dozen or more metrics just for the concept of memory alone. And we haven’t even touched the concept of private heaps or profiling the application to see what kind of objects are using memory!
Be as specific as possible when describing what you want to measure.
Story In one large server application I was responsible for, we tracked its private bytes as a critical metric and used this number to decide when we needed to do things like restart the process before beginning a large, memory-intensive operation. It turned out that quite a large amount of those “private bytes” were actually paged out over time and not contributing to the memory load on the system, which is what we were really concerned with. We changed our system to measure the working set instead. This had the benefit of “reducing” our memory usage by a few gigabytes. (As I said, this was a rather large application.)
Once you have decided what you are going to measure, come up with goals for each of those metrics. Early in development, these goals may be quite malleable, even unrealistic. The point at the beginning is not necessarily to meet the goals, but to force you to build a system that automatically measures you against those goals.
Your goals should be quantifiable. A high-level goal for your program might state that it should be “fast.” Of course it should. That is not a very good metric because “fast” is subjective and there is no well-defined way to know you are meeting that goal. You must be able to assign a number to this goal and be able to measure it.
Bad: “The user interface should be responsive.”
Good: “No operation may block the UI thread for more than 20 milliseconds.”
However, just being quantifiable is not good enough either. You need to be very specific, as we saw in the memory example earlier.
Bad: “Memory should be less than 1 GB.”
Good: “Working set memory usage should never exceed 1 GB during peak load of 100 queries per second.”
The second version of that goal gives a very specific circumstance that determines whether you are meeting your goal. In fact, it suggests a good test case.
Another major determining factor in what your goals should be is the kind of application you are writing. A user interface program must at all costs remain responsive on the UI thread, whatever else it does. A server program handling dozens, hundreds, or even thousands of requests per second must be incredibly efficient in handling I/O and synchronization to ensure maximum throughput and keep the CPU utilization high. You design a server of this type in a completely different way than other programs. It is very difficult to fix a poorly written application retroactively if it has a fundamentally flawed architecture from an efficiency perspective.
A potentially useful exercise while designing your system and planning performance measurement is to consider what the optimal theoretical performance of your system is. If you could eliminate all overhead like garbage collection, JIT, thread interrupts, or whatever you deem is overhead in your application, then what is left to process the actual work? What are the theoretical limits that you can think of, in terms of workload, memory usage, CPU usage, and internal synchronization? This often depends on the hardware and OS you are running on. For example, if you have a 16-processor server with 64 GB of RAM with two 10 GB network links, then you have an idea of your parallelism threshold, how much data you can store in memory, and how much you can push over the wire every second. It will help you plan how many machines of this type you will need if one is not enough. All of this information should strongly inform your goals.
You have likely heard the phrase, coined by Donald Knuth, “Premature optimization is the root of all evil.” This applies only to micro-optimizations at the code level. You need to understand your architecture and its constraints as you design or you will miss something crucial and severely hamstring your application. You must bake performance goals into the design up front. Performance, like security and many other aspects of software design, cannot be an afterthought, but needs to be included as an explicit goal from the start. It is not impossible to redesign an existing application from the ground up, but it is far more expensive than doing it right in the first place.
The performance analysis you will do at the beginning of a project is different from that which occurs once it is been written and is being tested. At the beginning, you must make sure the design is scalable, that the technology can theoretically handle what you want to do, and that you are not making huge architectural blunders that will forever haunt you. Once a project reaches testing, deployment, and maintenance phases, you will instead spend more time on micro-optimizations, analyzing specific code patterns, trying to reduce memory usage, etc.
Finally, you need to understand Ahmdals’s Law (See http://www.writinghighperf.net/go/3 [PDF]), in particular how it applies to sequential programs and picking which parts of a program to optimize. Micro-optimizing code that does not significantly contribute to overall inefficiency is largely a waste of time. You always want to optimize the most inefficient portions of a program first to get the largest benefit. You will never have time to optimize everything, so start intelligently. This is why having goals and an excellent measurement system in place is critical—otherwise, you don’t even know where to start.
- Average vs. Percentiles
When considering the numbers you are measuring, consider what the most appropriate statistics are. Most people default to average, which is certainly important in most circumstances, but you should also consider percentiles. If you have availability requirements, you will almost certainly need to have goals stated in terms of percentiles. For example:
“Average latency for database requests must be less than 10ms. The 95th percentile latency for database requests must be less than 100ms.”
If you are not familiar with this concept, it is actually quite simple. If you take 100 measurements of something and sort them, then the 95th entry in that list is the 95th percentile value of that data set. The 95th percentile says, “95% of all samples have this value or less.” Alternatively, “5% of requests have a value higher than this.”
The general formula for calculating the index of the Pth percentile of a sorted list is
(P/100) × N
where P is the percentile and N is the length of the list.
Consider a series of measurements for generation 0 garbage collection pause time (see Chapter 2) in milliseconds with these values (pre-sorted for convenience):
1, 2, 2, 4, 5, 5, 8, 10, 10, 11, 11, 11, 15, 23, 24, 25, 50, 87
For these 18 samples, we have an average of 17ms, but the 95th percentile is much higher at 50ms. If you just saw the average number, you may not be concerned with your GC latencies, but knowing the percentiles, you have a better idea of the full picture and that there are some occasional GCs happening that are far worse.
This series also demonstrates that the median value (50th percentile) can be quite different from the average. The average value of a series of measurements is often prone to strong influence by values in the higher percentiles.
Percentiles values are usually far more important for high-availability services. The higher availability you require, the higher percentile you will want to track. Usually, the 99th percentile is as high as you need to care about, but if you deal in a truly enormous volume of requests, 99.99th, 99.999th, or even higher percentiles will be important. Often, the value you need to be concerned about is determined by business needs, not technical reasons.
Percentiles are valuable because they give you an idea of how your metrics degrade across your entire execution context. Even if the average user or request experience in your application is good, perhaps the 90th percentile metric shows some room for improvement. That is telling you that 10% of your execution is being impacted more negatively than the rest. Tracking multiple percentiles will tell you how fast this degradation occurs. How important this percentage of users or requests is must ultimately be a business decision, and there is definitely a law of diminishing returns at play here. Getting that last 1% may be extremely difficult and costly.
I stated that the 95th percentile for the above data set was 50ms. While technically true, it is not useful information in this case—there is not actually enough data to make that call with any statistical significance, and it could be just a fluke. To determine how many samples you need, just use a rule of thumb: You need one “order of magnitude” more samples than the target percentile. For percentiles from 0-99, you need 100 samples minimum. You need 1,000 samples for 99.9th percentile, 10,000 samples for 99.99th percentile, and so on. This mostly works, but if you are interested in determining the actual number of samples you need from a mathematical perspective, http://www.writinghighperf.net/go/4 is a good place to start.
- Measurement Tools
If there is one single rule that is the most important in this entire book, it is this:
Measure, Measure, Measure!
You do NOT know where your performance problems are if you have not measured accurately. You will definitely gain experience and that can give you some strong hints about where performance problems are, just from code inspection or gut feel. You may even be right, but resist the urge to skip the measurement for anything but the most trivial of problems. The reasons for this are two-fold:
First, suppose you are right, and you have accurately found a performance problem. You probably want to know how much you improved the program, right? Bragging rights are much more secure with hard data to back them up.
Second, I cannot tell you how often I have been wrong. Case in point: While analyzing the amount of native memory in a process compared to managed memory, we assumed for while that it was coming from one particular area that loaded an enormous data set. Rather than putting a developer on the task of reducing that memory usage, we did some experiments to disable loading that component. We also used the debugger to dump information about all the heaps in the process. To our surprise, most of the mystery memory was coming from assembly loading overhead, not this dataset. We saved a lot of wasted effort.
Optimizing performance is meaningless if you do not have effective tools for measuring it. Performance measurement is a continual process that you should bake into your development toolset, testing processes, and monitoring tools. If your application requires continual monitoring for functionality purposes, then it likely also requires performance monitoring.
The remainder of this chapter covers various tools that you can use to profile, monitor, and debug performance issues. I give emphasis to software that is freely available, but know there are many commercial offerings that can in some cases simplify the tasks. If you have the budget for these tools, go for it. However, there is a lot of value in using some of the leaner tools I describe (or others like them). For one, they may be easier to run on customer machines or production environments. More importantly, by being a little “closer to the metal,” they will encourage you to gain knowledge and understanding at a very deep level that will help you interpret data, regardless of the tool you are using.
For each of the tools, I describe basic usage and general knowledge to get started. Sections throughout the book will give you detailed steps for very specific scenarios, but will often rely on you already being familiar with the UI and the basics of operation.
Tip Before digging into specific tools, a general tip for how to use them is in order. If you try to use an unfamiliar tool on a large, complicated project, it can be very easy to get overwhelmed, frustrated, or even get erroneous results. When learning how to measure performance with a new tool, create a test program with well-known behavior, and use the tool to prove its performance characteristics to you. By doing this, you will be more comfortable using the tool in a more complicated situation and less prone to making technical or judgmental mistakes.
- Visual Studio
While it is not the only IDE, most .NET programmers use Visual Studio, and if you do, chances are this is where you will start to analyze performance. Different versions of Visual Studio come with different tools. This book will assume you have at least the Professional version installed. If you do not have the right version, then skip ahead to the other tools mentioned.
Assuming you installed Visual Studio Professional or higher, you can access the performance tools via the Performance Wizard in the Analyze menu. In Visual Studio 2013, you must first launch the Performance and Diagnostics view from the Analyze menu, which will then allow you to use the Performance Wizard.
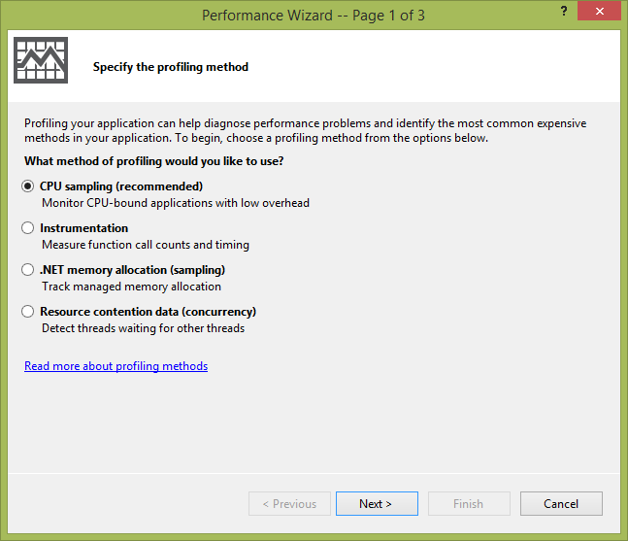
Figure 1-1. Profiling options in the Visual Studio Performance Wizard.
Visual Studio can analyze CPU usage, memory allocations, and resource contentions. This is perfect for use during development or when running comprehensive tests that accurately exercise the product.
However, it is very rare for a test to accurately capture the performance characteristics of a large application running on real data. If you need to capture performance data on non-development machines, say a customer’s machine or in the datacenter, you need a tool that can run outside of Visual Studio. For that, there is the Visual Studio Standalone Profiler, which comes with the Professional or higher versions of Visual Studio. You will need to install it from your installation media separately from Visual Studio. On my ISO images for both 2012 and 2013 Professional version, it is in the Standalone Profiler directory. See http://www.writinghighperf.net/go/5 for specific instructions on where to find it and how to install it.
To collect data from the command line with this tool:
- Navigate to the installation folder (or add the folder to your path)
- Run: VsPerfCmd.exe /Start:Sample /Output:outputfile.vsp
- Run the program you want to profile
- Run: VsPerfCmd.exe /Shutdown
This will produce a file called outputfile.vsp, which you can open in Visual Studio.
VsPerfCmd.exe has a number of other options, including all of the profiling types that the full Visual Studio experience offers. Aside from the most common option of Sample, you can choose:
- Coverage—Collects code coverage data
- Concurrency—Collects resource contention data
- Trace—Instruments the code to collect method call timing and counts
Trace vs. Sample mode is an important choice. Which to use depends on what you want to measure. Sample mode should be your default. It interrupts the process every few milliseconds and gets the stacks of all threads. This is the best way to get a good picture of CPU usage in your process. However, it does not work well for I/O calls, which will not have much CPU usage, but may still contribute to your overall run time.
Trace mode requires modification of every function call in the process to record time stamps. It is much more intrusive and causes your program to run much slower. However, it records actual time spent in each method, so may be more accurate, especially for I/O scenarios.
Coverage mode is not for performance analysis, but is useful for seeing which lines of your code were executed. This is a nice feature to have when running tests to see how much of your product the tests cover. There are commercial products that do this for you, but you can do it yourself without much more work.
Concurrency mode records events that occur when there is contention for a resource via a lock or some other synchronization object. This mode can tell you if your threads are being blocked due to contention. See Chapter 4 for more information about asynchronous programming and measuring the amount of lock contention in your application.
The Visual Studio tools are among the easiest to use, but if you do not already have the right version of Visual Studio, they are quite expensive. I provide plenty of free alternatives below if you cannot use Visual Studio. Nearly all performance measurement tools use the same underlying mechanism (at least in Windows 8/Server 2012 and above kernels): ETW events. ETW stands for Event Tracing for Windows and this is the operating system’s way of logging all interesting events in an extremely fast, efficient manner. All applications generate these events and profilers can capture them to do extensive analysis. Chapter 8 describes how to take advantage of ETW events in your own program, whether that is capturing existing events or defining your own.
This leads to another reason I often like to use other tools, especially when monitoring production systems: The Visual Studio tools are very specialized—they collect and display one type of data at a time, while a tool like PerfView can collect arbitrary ETW events all at once and you can analyze all of them separately from one collection run. It is a minor point, but one worth pointing out. Sometimes I think of Visual Studio performance analysis as “development-time” while the other tools are for the real system. Your experience may differ and you should use the tools that give you the most bang for the buck.
- Performance Counters
These are some of the simplest ways to monitor your application’s and the system’s performance. Windows has hundreds of counters in dozens of categories, including many for .NET. The easiest way to access these is via the built-in utility PerformanceMonitor (PerfMon.exe).
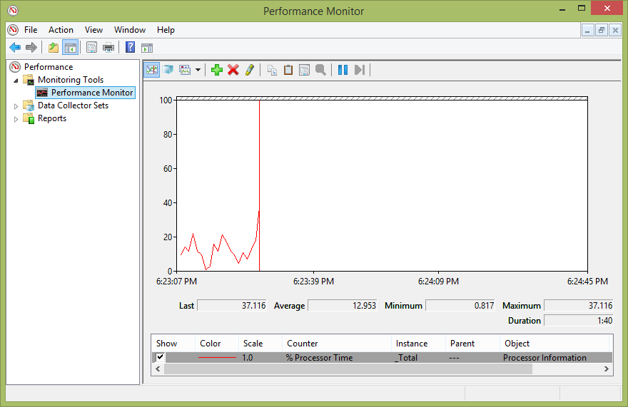
Figure 1-2. PerfMon's main window showing a processor counter for a small window of time. The vertical line represents the current instance and the graph will wrap around after 100 seconds by default.
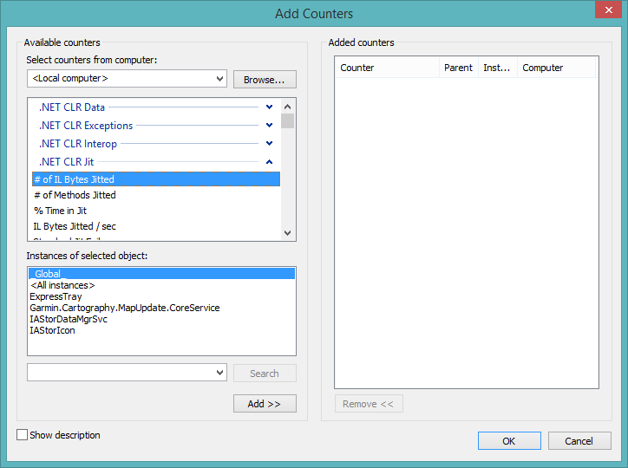
Figure 1-3. One of the hundreds of counters in many categories, showing all of the applicable instances (processes, in this case).
Each counter has a category and a name. Many counters also have instances of the selected counter as well. For example, for the % Processor Time counter in the Process category, the instances are the various processes for which there are values. Some counters also have meta-instances, such as _Total or <Global>, which aggregate the values over all instances.
Many of the chapters ahead will detail the relevant counters for that topic, but there are general-purpose counters that are not .NET-specific that you should know. There are performance counters for nearly every Windows subsystem, but these are generally applicable to every program.
However, before continuing, you should familiarize yourself with some basic operating system terminology:
- Physical Memory—The actual physical memory chips in a computer. Only the operating system manages physical memory directly.
- Virtual Memory—A logical organization of memory in a given process. Virtual memory size can be larger than physical memory. For example, 32-bit programs have a 4 GB address space, even if the computer itself only has 2 GB of RAM. Windows allows the program to access only 2 GB of that by default, but all 4 GB is possible if the executable is large-address aware. (On 32-bit versions of Windows, large-address aware programs are limited to 3 GB.) As of Windows 8.1 and Server 2012, 64-bit processes have a 128 TB process space, far larger than the 4 TB physical memory limit. Some of the virtual memory may be in RAM while other parts are stored on disk in a paging file. Contiguous blocks of virtual memory may not be contiguous in physical memory. All memory addresses in a process are for the virtual memory.
- Reserved Memory—A region of virtual memory address space that has been reserved for the process and thus will not be allocated to a future requester. Reserved memory cannot be used for memory allocation requests because there is nothing backing it—it is just a description of a range of memory addresses.
- Committed Memory—A region of memory that has a physical backing store. This can be RAM or disk.
- Page—An organizational unit of memory. Blocks of memory are allocated in a page, which is usually a few KB in size.
- Paging—The process of transferring pages between regions of virtual memory. The page can move to or from another process (soft paging) or the disk (hard paging). Soft paging can be accomplished very quickly by mapping the existing memory into the current process’s virtual address space. Hard paging involves a relatively slow transfer of data to or from disk. Your program must avoid this at all costs to maintain good performance.
- Page In—Transfer a page from another location to the current process.
- Page Out—Transfer a page from the current process to another location, such as disk.
- Context Switch—The process of saving and restoring the state of a thread or process. Because there are usually more running threads than available processors, there are often many context switches per second.
- Kernel Mode—A mode that allows the OS to modify low-level aspects of the hardware’s state, such as modifying certain registers or enabling/disabling interrupts. Transitioning to Kernel Mode requires an operating system call, and can be quite expensive.
- User Mode—An unprivileged mode of executing instructions. There is no ability to modify low-level aspects of the system.
I will use some of those terms throughout the book, especially in Chapter 2 when I discuss garbage collection. For more information on these topics, look at a dedicated operating system book such as Windows Internals. (See the bibliography in Appendix C.)
The Process category of counters surfaces much of this critical information via counters with instances for each process, including:
- % Privileged Time—Amount of time spent in executing privileged (kernel mode) code.
- % Processor Time—Percentage of a single processor the application is using. If your application is using two logical processor cores at 100% each, then this counter will read 200.
- % User Time—Amount of time spent in executing unprivileged (user mode) code.
- IO Data Bytes/sec—How much I/O your process is doing.
- Page Faults/sec—Total number of page faults in your process. A page fault occurs when a page of memory is missing from the current working set. It is important to realize that this number includes both soft and hard page faults. Soft page faults are innocuous and can be caused by the page being in memory, but outside the current process (such as for shared DLLs). Hard page faults are more serious, indicating data that is on disk but not currently in memory. Unfortunately, you cannot track hard page faults per process with performance counters, but you can see it for the entire system with the MemoryPage Reads/sec counter. You can do some correlation with a process’s total page faults plus the system’s overall page reads (hard faults). You can definitively track a process’s hard faults with ETW tracing with the Windows Kernel/Memory/Hard Fault event.
- Pool Nonpaged Bytes—Typically operating system and driver allocated memory for data structures that cannot be paged out such as operating system objects like threads and mutexes, but also custom data structures.
- Pool Paged Bytes—Also for operating system data structures, but these are allowed to be paged out.
- Private Bytes—Committed virtual memory private to the specific process (not shared with any other processes).
- Virtual Bytes—Allocated memory in the process’s address space, some of which may be backed by the page file, shared with other processes, and memory private to the process.
- Working Set—The amount of virtual memory currently resident in physical memory (usually RAM).
- Working Set-Private—The amount of private bytes currently resident in physical memory.
- Thread Count—The number of threads in the process. This may or may not be equal to the number of .NET threads. See Chapter 4 (Asynchronous Programming) for a discussion of .NET thread-related counters.
There are a few other generally useful categories, depending on your application. You can use PerfMon to explore the specific counters found in these categories.
- IPv4/IPv6—Internet Protocol-related counters for datagrams and fragments.
- Memory—System-wide memory counters such as overall paging, available bytes, committed bytes, and much more.
- Objects—Data about kernel-owned objects such as events, mutexes, processes, threads, semaphores, and sections.
- Processor—Counters for each logical processor in the system.
- System—Context switches, alignment fixes, file operations, process count, threads, and more.
- TCPv4/TCPv6—Data for TCP connections and segment transfers.
It is surprisingly difficult to find detailed information on performance counters on the Internet, but thankfully, they are self-documenting! In the Add Counter dialog box in PerfMon, you can check the “Show description” box at the bottom to display details on the highlighted counter.
PerfMon also has the ability to collect specified performance counters at scheduled times and store them in logs for later viewing, or even perform a custom action when a performance counter passes a threshold. You do this with Data Collector Sets and they are not limited just to performance counter data, but can also collect system configuration data and ETW events.
To setup a Data Collector Set, in the main PerfView window:
1. Expand the Data Collector Sets tree.
2. Right-click on User Defined.
3. Select New.
4. Select Data Collector Set.
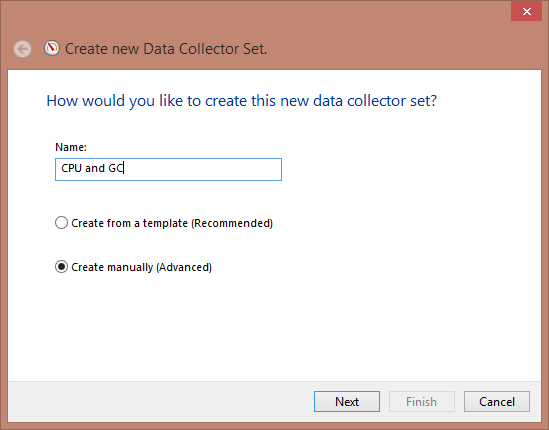
Figure 1-4. Data Collector Set configuration dialog box for setting up regular counter collections.
5. Give it a name, check “Create manually (Advanced)”, and click Next
6. Check the Performance counter box under “Create data logs for” and click Next
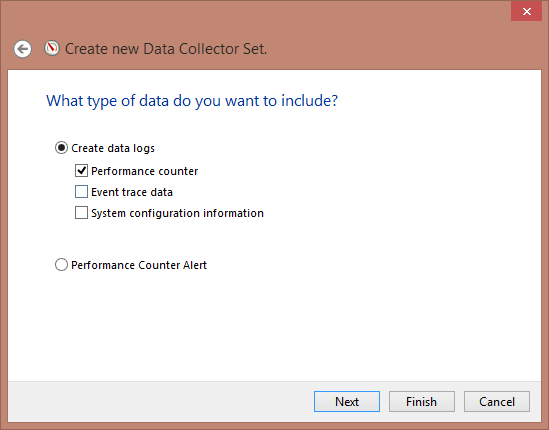
Figure 1-5. Specify the type of data you want to store.
7. Click Add to select the counters you want to include
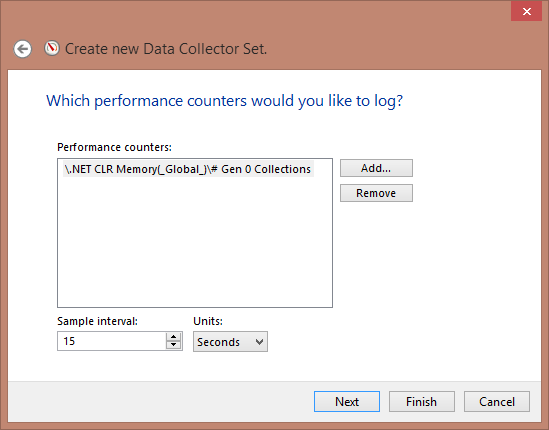
Figure 1-6. Select the counters to collect.
8. Click Next to set the path where you want to store the logs and Next again to select security information.
Once done, you can open the properties for the collection set and set a schedule for collection. You can also run them manually by right clicking on the job node and selecting Start. This will create a report, which you can view by double-clicking its node under Reports in the main tree view.
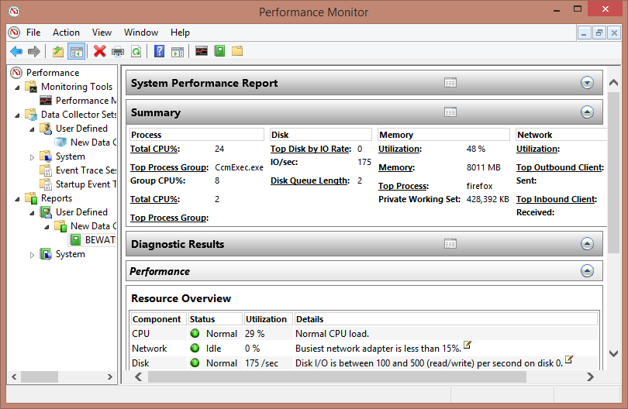
Figure 1-7. A Saved report file. Use the toolbar buttons to change the view to a graph of the captured counter data.
To create an alert, follow the same process but select the “Performance Counter Alert” option in the Wizard.
It is likely that everything you will need to do with performance counters can be done using the functionality described here, but if you want to take programmatic control or create your own counters, see Chapter 7 (Performance Counters) for details. You should consider performance counter analysis a baseline for all performance work on your application.
- ETW Events
Event Tracing for Windows (ETW) is one of the fundamental building blocks for all diagnostic logging in Windows, not just for performance. This section will give you an overview of ETW and Chapter 8 will teach you how to create and monitor your own events.
Events are produced by providers. For example, the CLR contains the Runtime provider that produces most of the events we are interested in for this book. There are providers for nearly every subsystem in Windows, such as the CPU, disk, network, firewall, memory, and many, many more. The ETW subsystem is extremely efficient and can handle the enormous volume of events generated, with minimal overhead.
Each event has some standard fields associated with it, like event level (informational, warning, error, verbose, and critical) and keywords. Each provider can define its own keywords. The CLR’s Runtime provider has keywords for things like GC, JIT, Security, Interop, Contention, and more. Keywords allow you to filter the events you would like to monitor.
Each event also has a custom data structure defined by its provider that describes the state of some behavior. For example, the Runtime’s GC events will mention things like the generation of the current collection, whether it was background, and so on.
What makes ETW so powerful is that, since most components in Windows produce an enormous number of events describing nearly every aspect of an application’s operation, at every layer, you can do the bulk of performance analysis only with ETW events.
Many tools can process ETW events and give specialized views. In fact, starting in Windows 8, all CPU profiling is done using ETW events.
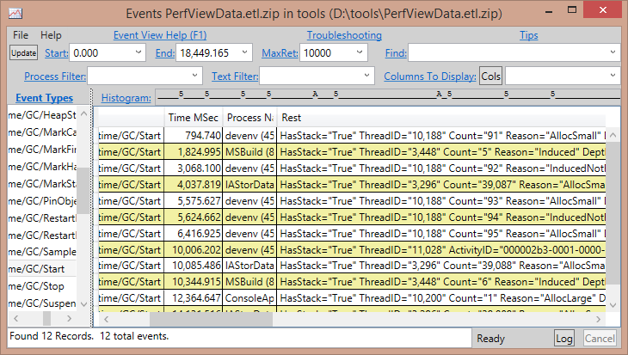
Figure 1-8. A list of all GC Start events taken in a 60-second trace. Notice various pieces of data associated with the event, such as the Reason and Depth.
To see a list of all the ETW providers registered on your system, open a command prompt and type:
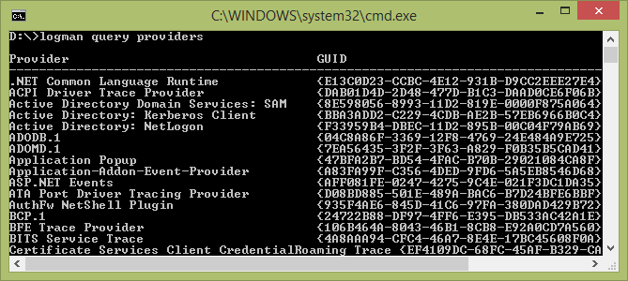
You can also get details on the keywords for a specific provider:
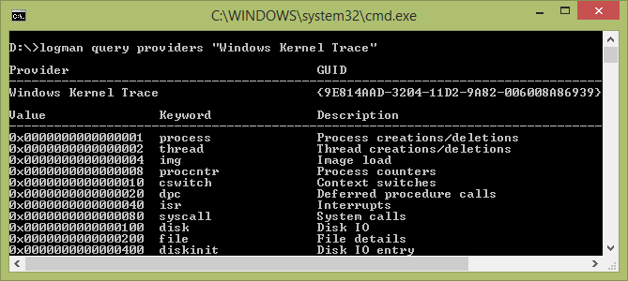
See http://www.writinghighperf.net/go/6 for more information about ETW. Unfortunately, there is no good online resource to explain what events exist in, say, the Windows Kernel Trace provider. Some common ETW events for all Windows processes include those in the Windows Kernel Trace category:
- Memory/Hard Fault
- DiskIO/Read
- DiskIO/Write
- Process/Start
- Process/Stop
- TcpIp/Connect
- TcpIp/Disconnect
- Thread/Start
- Thread/Stop
To see other events from this provider or others, you can collect ETW events and examine them yourself.
Throughout the book, I will mention the important events you should pay attention to in an ETW trace, particularly from the CLR Runtime provider. For a list of all CLR Keywords, see http://www.writinghighperf.net/go/7. To see what events the CLR makes available, see http://www.writinghighperf.net/go/8.
- PerfView
Many tools can collect and analyze ETW events, but PerfView, written by Microsoft .NET performance architect Vance Morrison, is my favorite. You can download it from http://www.writinghighperf.net/go/9. The previous screenshot of ETW events is from this tool. PerfView’s utility lies in its extremely powerful stack grouping and folding mechanism that lets you drill into events at multiple layers of abstraction.
While other ETW analysis tools can be useful, I often prefer PerfView for a few reasons:
- It requires no installation so it is easy to run on any computer.
- It is extremely configurable.
- It is easily scriptable.
- You can pick which events to capture at a very granular level, which allows you, for example, to take hours-long traces of just a few categories of events.
- It generally causes very little impact to the machine or processes it monitors.
- Its stack grouping and folding capability is unparalleled.
- You can customize PerfView with extensions that take advantage of the built-in stack grouping and folding functionality.
Here are some common questions that I routinely answer using PerfView:
- Where is my CPU usage going?
- Who is allocating the most memory?
- What types are being allocated the most?
- What is causing my Gen 2 garbage collections?
- How long is the average Gen 0 collection?
- How much JITting is my code doing?
- Which locks are most contentious?
- What does my managed heap look like?
To collect and analyze events using PerfView follow these basic steps:
- From the Collect menu, select the Collect menu item.
- From the resulting dialog, specify the options you need.
- Expand Advanced Options to narrow down the type of events you want to capture.
- Check the “No V3.X NGEN Symbols” if you are not using .NET 3.5.
- Optionally specify “Max Collect Sec” to automatically stop collection after the given time.
- Click the Start Collection button.
- If not using a “Max Collect Sec” value, click the Stop Collection button when done.
- Wait for the events to be processed.
- Select the view to use from the resulting tree.
During event collection, PerfView captures ETW events for all processes. You can filter events per-process after the collection is complete.
Collecting events is not free. Certain categories of events are more expensive to collect than others are and you will need to learn which events result in unusably enormous trace files, or which events adversely affect the operation of the application. For example, a CPU profile generates a huge number of events, so you should keep the profile time very limited (around a minute or two) or you could end up with multi-gigabyte files that you cannot analyze.
- PerfView Interface and Views
Most views in PerfView are variations of a single type, so it is worth understanding how it works.
PerfView is mostly a stack aggregator and viewer. When you record ETW events, the stack for each event is recorded. PerfView analyzes these stacks and shows them to you in a grid that is common to CPU, memory allocation, lock contention, exceptions thrown, and most other types of events. The principles you learn while doing one type of investigation will apply to other types, since the stack analysis is the same.
You also need to understand the concepts of grouping and folding. Grouping turns multiple sources into a single entity. For example, there are multiple .NET Framework DLLs and which DLL a particular function is in is not usually interesting for profiling. Using grouping, you can define a grouping pattern, such as “System.*!=>LIB”, which coalesces all System.*.dll assemblies into a single group called LIB. This is one of the default grouping patterns that PerfView applies.
Folding allows you to hide some of the irrelevant complexity of the lower layers of code by counting its cost in the nodes that call it. As a simple example, consider where memory allocations occur—always via some internal CLR method invoked by the new operator. What you really want to know is which types are most responsible for those allocations. Folding allows you to attribute those underlying costs to their parents, code which you can actually control. For example, in most cases you do not care about which internal operations are taking up time in String.Format; you really care about what areas of your code are calling String.Format in the first place. PerfView can fold those operations into the caller to give you a better picture of your code’s performance.
Folding patterns can use the groups you defined for grouping. So, for example, you can just specify a folding pattern of “LIB” which will ensure that all methods in System.* are attributed to their caller outside of System.*.
The user interface of the stack viewer needs some brief explanation as well.
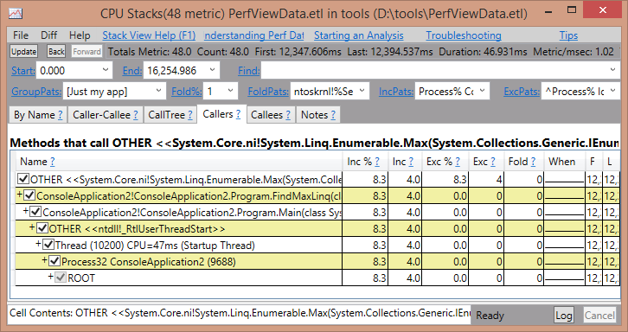
Figure 1-10. A typical stack view in PerfView. The UI contains many options for filtering, sorting, and searching.
Controls at the top allow you to organize the stack view in multiple ways. Here is a summary of their usage, but you can click on them in the program to bring up a help field that gives you more details.
- Start—Start time (in microseconds) which you want to examine.
- End—End time (in microseconds) which you want to examine.
- Find—Text to search for.
- GroupPats—A semi-colon-delimited list of grouping patterns.
- Fold%—Any stack that takes less than this percentage will be folded into its parent.
- FoldPats—A semi-colon-delimited list of folding patterns.
- IncPats—Stacks must have this pattern to be included in the analysis. This usually contains the process name.
- ExcPats—Exclude anything with this pattern from analysis. By default, this includes just the Idle process.
There are a few different view types:
- By Name—Shows every node, whether type, method, or group. This is good for bottom-up analysis.
- Caller-Callee—Focuses on a single node, showing you callers and callees of that node.
- CallTree—Shows a tree of all nodes in the profile, starting at ROOT. This works well for doing top-down analysis.
- Callers—Shows you all callers of a particular node.
- Callees—Shows you all called methods of a particular node.
- Notes—Allows you to save notes on your investigation in the ETL files themselves.
In the grid view, there are a number of columns. Click on the column names to bring up more information. Here is a summary of the most important columns:
- Name—The type, method, or customized group name.
- Exc %—Percentage of exclusive cost. For memory traces, it is the amount of memory attributed to this type/method only. For CPU traces, it is the amount of CPU time attributed to this method.
- Exc—The number of samples in just this node, excluding children nodes. For memory traces, the number of bytes attributed to this node exclusively. For CPU traces, the amount of time (in milliseconds) spent here.
- Exc Ct—Number of samples exclusively on this node.
- Inc %—Percentage of cost for this type/method and all its children, recursively. This is always at least as big as Exc %.
- Inc—Cost of this node, including all children recursively. For CPU usage, this is the amount of CPU time spent in this node plus all of its children.
- Inc Ct—Number of samples on this node and all its children.
In the chapters that follow, I will give instructions for solving specific problems with various types of performance investigations. A complete overview of PerfView would be worth a book on its own, or at least a very detailed help file—which just so happens to come with PerfView. I strongly encourage you to read this manual once you have gone through a few simple analyses.
It may seem like PerfView is mostly analyzing memory or CPU, but do not forget that it is really just a generic stack aggregation program, and those stacks can come from any ETW event. It can analyze your sources of lock contention, disk I/O, or any arbitrary application event with the same grouping and folding power.
- CLR Profiler
CLR Profiler is a good alternative to PerfView’s memory analysis capabilities if you want a graphical representation of the heap and relationships between objects. CLR Profiler can show you a wealth of detail. For example:
- Visual graph of what the program allocates and the chain of methods that led to the allocation.
- Histograms of allocated, relocated, and finalized objects by size and type.
- Histogram of objects by lifetime.
- Timeline of object allocations and garbage collections, showing the change in the heap over time.
- Graphs of objects by their virtual memory address, which can show fragmentation quite easily.
I rarely use CLR Profiler because of some of its limitations, but it is still occasionally useful, despite its age. It has unique visualizations that no other free tool currently matches. You can download it from http://www.writinghighperf.net/go/10. It comes with 32-bit and 64-bit binaries as well as documentation and the source code.
The basic steps to get a trace are:
- Pick the correct version to run: 32-bit or 64-bit, depending on your target program. You cannot profile a 32-bit program with the 64-bit profiler or vice-versa.
- Check the Profiling active box.
- Optionally check the Allocations and Calls boxes.
- If necessary, go to the File | Set Parameters… menu option to set options like command line parameters, working directory, and log file directory.
- Click the Start Application button
- Browse to the application you want to profile and click the Open button.
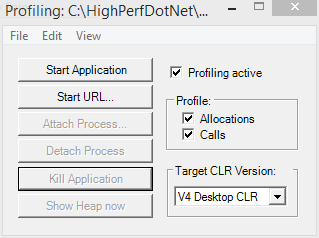
Figure 1-11. CLR Profiler's main window.
This will start the application with profiling active. When you are done profiling, exit the program, or select Kill Application in CLR Profiler. This will terminate the profiled application and start processing the capture log. This processing can take quite a while, depending on the profile duration (I have seen it take over an hour before).
While profiling is going on, you can click the “Show Heap now” button in CLR Profiler. This will cause it to take a heap dump and open the results in a visual graph of object relationships. Profiling will continue uninterrupted, and you can take multiple heap dumps at different points.
When it is done, you will see the main results screen.
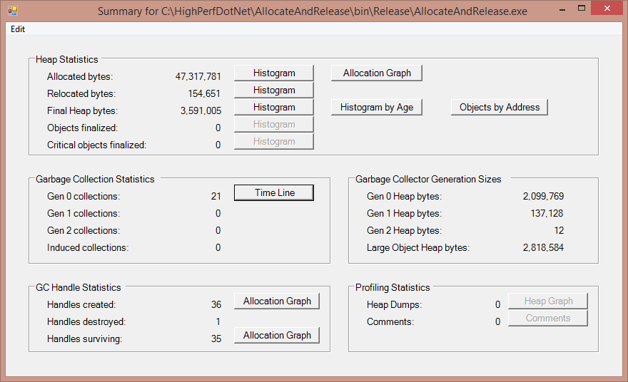
Figure 1-12. CLR Profiler's Results Summary view, showing you the data it collected during the trace.
From this screen, you can access different visualizations of heap data. Start with the Allocation Graph and the Time Line to see some of the essential capabilities. As you become comfortable analyzing managed code, the histogram views will also become an invaluable resource.
Note While CLR Profiler is generally great, I have had a few major problems with it. First, it is a bit finicky. If you do not set it up correctly before starting to profile, it can throw exceptions or die unexpectedly. For example, I always have to check the Allocations or Calls boxes before I start profiling if I want to get any data at all. You should completely disregard the Attach to Process button, as it does not seem to work reliably. CLR Profiler does not seem to work well for truly huge applications with enormous heaps or a large number of assemblies. If you find yourself having trouble, PerfView may be a better solution because of its polish and extreme customizability through very detailed command-line parameters that allow you to control nearly all aspects of its behavior. Your mileage may vary. On the other hand, CLR Profiler comes with its own source code so you can fix it!
- Windbg
Windbg is a general purpose Windows Debugger distributed for free by Microsoft. If you are used to using Visual Studio as your main debugger, using this barebones, text-only debugger may seem daunting. Don’t let it be. Once you learn a few commands, you will feel comfortable and after a while, you will rarely use Visual Studio for debugging except during active development.
Windbg is far more powerful than Visual Studio and will let you examine your process in many ways you could not otherwise. It is also lightweight and more easily deployable to production servers or customer machines. In these situations, it is in your best interest to become familiar with Windbg.
With Windbg, you can quickly answer questions such as these:
- How many of each object type are on the heap, and how big are they?
- How big are each of my heaps and how much of them is free space (fragmentation)?
- What objects stick around through a GC?
- Which objects are pinned?
- Which threads are taking the most CPU time? Is one of them stuck in an infinite loop?
Windbg is not usually my first tool (that is often PerfView), but it is often my second or third, allowing me to see things that other tools will not easily show. For this reason, I will use Windbg extensively throughout this book to show you how to examine your program’s operation, even when other tools do a quicker or better job. (Don’t worry; I will also cover those tools.)
Do not be daunted by the text interface of Windbg. Once you use a few commands to look into your process, you will quickly become comfortable and appreciative of the speed with which you can analyze a program. The chapters in this book will add to your knowledge little by little with specific scenarios.
To get Windbg, go to http://www.writinghighperf.net/go/11 and follow the instructions to install the SDK. (You can choose to install only the debuggers if you wish.)
To work with managed code, you will need to use .NET’s SOS extensions, which ship with each version of the .NET Framework. A very handy SOS reference cheat sheet is located at http://www.writinghighperf.net/go/12.
To get started with Windbg, let’s do a simple tutorial with a sample program. The program will be basic enough—a straightforward, easy-to-debug memory leak. You can find it in the accompanying source code in the MemoryLeak project.
using System;
using System.Collections.Generic;
using System.Threading;
namespace MemoryLeak
{
class Program
{
static List<string> times = new List<string>();
static void Main(string[] args)
{
Console.WriteLine("Press any key to exit");
while (!Console.KeyAvailable)
{
times.Add(DateTime.Now.ToString());
Console.Write('.'),
Thread.Sleep(1000);
}
}
}
}
Startup this program and let it run for a few minutes.
Run Windbg from where you installed it. It should be in the Start Menu if you installed it via the Windows SDK. Take care to run the correct version, either x86 (for 32-bit processes) or x64 (for 64-bit processes). Go to File | Attach to Process (or hit F6) to bring up the Attach to Process dialog.
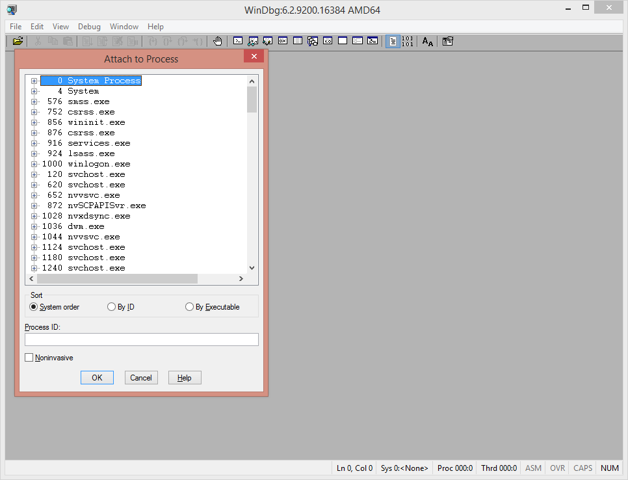
Figure 1-13. WinDbg's Attach to Process screen.
From here, find the MemoryLeak process. (It may be easier to check the By Executable sort option.) Click OK.
Windbg will suspend the process (This is important to know if you are debugging a live production process!) and display any loaded modules. At this point, it will be waiting for your command. The first thing you usually want to do is load the CLR debugging extensions. Enter this command:
.loadby sos clr
If it succeeds, there will be no output.
If you get an error message that says “Unable to find module ‘clr’” it most likely means the CLR has not yet been loaded. This can happen if you launch a program from Windbg and break into it immediately. In this case, first set a breakpoint on the CLR module load:
sxe ld clr
g
The first command sets a breakpoint on the load of the CLR module. The g command tells the debugger to continue execution. Once you break again, the CLR module should be loaded and you can now load SOS with the .loadby sos clr command, as described previously.
At this point, you can do any number of things. Here are some commands to try:
g
This continues execution. You cannot enter any commands while the program is running.
<Ctrl-Break>
This pauses a running program. Do this after you Go to get back control.
.dump /ma d:memorydump.dmp
This creates a full process dump to the selected file. This will allow you to debug the process’s state later, though since it is a snapshot, of course you will not be able to debug any further execution.
!DumpHeap –stat
DumpHeap shows a summary of all managed objects on the object heap, including their size (just for this object, not any referenced objects), count, and other information. If you want to see every object on the heap of type System.String, type !DumpHeap –type System.String. You will see more about this command when investigating garbage collection.
~*kb
This is a regular Windbg command, not from SOS. It prints the current stack for all threads in the process.
To switch the current thread to a different one, use the command:
~32s
This will change the current thread to thread # 32. Note that thread numbers in Windbg are not the same as thread IDs. Windbg numbers all the threads in your process for easy reference, regardless of the Windows or .NET thread ID.
!DumpStackObjects
You can also use the abbreviated version: !dso. This dumps out the address and type of each object from all stack frames for the current thread.
Note that all commands located in the SOS debugging extension for managed code are prefixed with a ! character.
The other thing you need to do to be effective with the debugger is set your symbol path to download the public symbols for Microsoft DLLs so you can see what is going on in the system layer. Set your _NT_SYMBOL_PATH environment variable to this string:
symsrv*symsrv.dll*c:symbols*http://msdl.microsoft.com/download/symbols
Replace c:symbols with your preferred local symbol cache path (and make sure you create the directory). With the environment variable set, both Windbg and Visual Studio will use this path to automatically download and cache the public symbols for system DLLs. During the initial download, symbol resolution may be quite slow, but once cached, it should speed up significantly.
- .NET IL Analyzers
There are many free and paid products out there that can take a compiled assembly and decompile it into IL, C#, VB.NET, or any other .NET language. Some of the most popular include Reflector, ILSpy, and dotPeek, but there are others.
These tools are valuable for showing you the inner details of other people’s code, something critical for good performance analysis. I use them most often to examine the .NET Framework itself when I want to see the potential performance implications of various APIs.
Converting your own code to readable IL is also valuable because it can show you many operations, such as boxing, that are not visible in the higher-level languages.
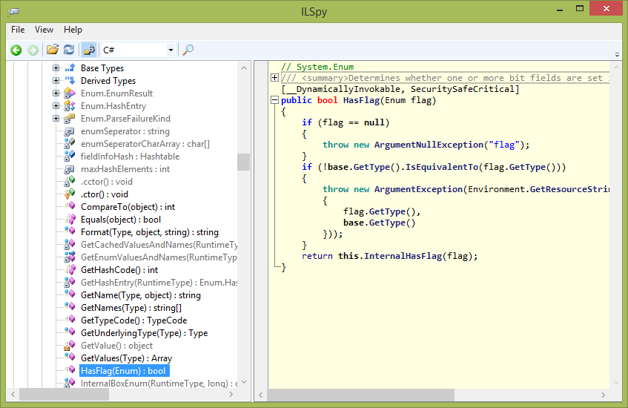
Figure 1-14. ILSpy with a decompilation of Enum.HasFlag in C#. ILSpy is a powerful tool for learning how 3rd-party code works and performs.
Chapter 6 discusses the .NET Framework code and encourages you to train a critical eye on every API you use. Tools like ILSpy and Reflector are vital for that purpose and you will use them daily as you become more familiar with existing code. You will often be surprised at how much work goes into seemingly simple methods.
- MeasureIt
MeasureIt is a handy micro-benchmark tool Vance Morrison (the same author of PerfView). It shows the relative costs of various .NET APIs in many categories including method calls, arrays, delegates, iteration, reflection P/Invoke, and many more. It compares all the costs to calling an empty static function as a benchmark.
MeasureIt is primarily useful to show you how design choices will affect performance at an API level. For example, in the locks category, it shows you that using ReaderWriteLock is about four times slower than just using a regular lock statement.
You can download MeasureIt from http://www.writinghighperf.net/go/13.
It is easy to add your own benchmarks to the MeasureIt’s code. It ships with its own code packed inside itself—just run MeasureIt /edit to extract it. Studying this code will give you a good idea of how to write accurate benchmarks. There is a lengthy explanation in the code comments about how to do high-quality analysis, which you should pay special attention to, especially if you want to do some simple benchmarking yourself.
For example, it prevents the compiler from inlining function calls:
[MethodImpl(MethodImplOptions.NoInlining)]
public void AnyEmptyFunction()
{
}
There are other tricks it uses such as working around processor caches and doing enough iterations to produce statistically significant results.
- Code Instrumentation
The old standby of brute-force debugging via console output is still a valid scenario and should not be ignored. Rather than console output, however, I encourage you to use ETW events, as detailed in Chapter 8, instead, which allows much more sophisticated analysis.
Performing accurate code timing is also a useful feature at times. Never use DateTime.Now for tracking performance data. It is just too slow for this purpose. Instead, use the System.Diagnostics.Stopwatch class to track the time span of small or large events in your program with extreme accuracy, precision, and low overhead.
var stopwatch = Stopwatch.StartNew();
...do work...
stopwatch.Stop();
TimeSpan elapsed = stopwatch.Elapsed;
long elapsedTicks = stopwatch.ElapsedTicks;
See Chapter 6 for more information about using times and timing in .NET.
If you want to ensure that your own benchmarks are accurate and reproducible, study the source code and documentation to MeasureIt, which highlights the best practices on this topic. It is often harder than you would expect and performing benchmarks incorrectly can be worse than doing no benchmarks at all because it will cause you to waste time on the wrong thing.
- SysInternals Utilities
No developer, system administrator, or even hobbyist should be without this great set of tools. Originally developed by Mark Russinovich and Bryce Cogswell and now owned by Microsoft, these are tools for computer management, process inspection, network analysis, and a lot more. Here are some of my favorites:
- ClockRes—Shows the resolution of the system’s clock (which is also the maximum timer resolution). See Chapter 4.
- Diskmon—Monitors all disk activity.
- Handle—Monitors which files are opened by which processes.
- ProcDump—A highly configurable process dump creator.
- Process Explorer —A much better Task Manager, with a wealth of detail about every process.
- Process Monitor—Monitor file, registry, and process activity in real-time.
- VMMap—Analyze a process’s address space.
There are dozens more. You can download this suite of utilities (individually or as a whole) from http://www.writinghighperf.net/go/14.
- Database
The final performance tool is a rather generic one: a simple database—something to track your performance over time. The metrics you track are whatever is relevant to your project, and the format does not have to be a full-blown SQL Server relational database (though there are certainly advantages to such a system). It can be a collection of reports stored over time in an easily readable format, or just CSV files with labels and values. The point is that you should record it, store it, and build the ability to report from it.
When someone asks you if your application is performing better, which is the better answer?
1. Yes
Or
2. In the last 6 months, we’ve reduced CPU usage by 50%, memory consumption by 25%, and request latency by 15%. Our GC rate is down to one in every 10 seconds (it used to be every second!), and our startup time is now dominated entirely by configuration loading (35 seconds).
As mentioned earlier, bragging about performance gains is so much better with solid data to back it up!
- Other Tools
You can find many other tools. There are plenty of static code analyzers, ETW event collectors and analyzers, assembly decompilers, performance profilers, and much more.
You can consider the list presented in this chapter as a starting point, but understand that you can do significant work with just these tools. Sometimes an intelligent visualization of a performance problem can help, but you will not always need it.
You will also discover that as you become more familiar with technologies like Performance Counters or ETW events, it is easy to write your own tools to do custom reporting or intelligent analysis. Many of the tools discussed in this book are automatable to some degree.
- Measurement Overhead
No matter what you do, there is going to be some overhead from measuring your performance. CPU profiling slows your program done somewhat, performance counters will require memory and/or disk space. ETW events, as fast as they are, are not free.
You will have to monitor and optimize this overhead in your code just like all other aspects of your program. Then decide whether the cost of measurement in some scenarios is worth the performance hit you will pay.
If you cannot afford to measure all the time, then you will have to settle for some kind of profiling. As long as it is often enough to catch issues, then it is likely fine.
You could also have “special builds” of your software, but this can be a little dangerous. You do not want these special builds to morph into something that is unrepresentative of the actual product.
As with many things in software, there is a balance you will have to find between having all the data you want and having optimal performance.
- Summary
The most important rule of performance is Measure, Measure, Measure!
Know what metrics are important for your application. Develop precise, quantifiable goals for each metric. Average values are good, but pay attention to percentiles as well, especially for high-availability services. Ensure that you include good performance goals in the design upfront and understand the performance implications of your architecture. Optimize the parts of your program that have the biggest impact first. Focus on macro-optimizations at the algorithmic or systemic level before moving on to micro-optimizations.
Have a good foundation of performance counters and ETW events for your program. For analysis and debugging, use the right tools for the job. Learn how to use the most powerful tools like Windbg and PerfView to solve problems quickly.