7. Using Visual Materials
“Both images and words on script, print or digital pages engage the eyes. When images and words appear together in one discursive space, they operate synergetically. In this sense, written verbal rhetoric is visual rhetoric.”
—Maureen Daly Goggin, “Visual Rhetoric in Pens of Steel and Inks of Silk: Challenging the Great Visual/Verbal Divide.”
ALTHOUGH MOST THESES and dissertations communicate primarily through language—words, sentences, and paragraphs—visual materials can be an important asset in developing and supporting your ideas, particularly if your subject is concerned with graphic or numerical data. Visual representations such as tables, charts, diagrams, graphs, or photographs can serve as focal points, as enabling you to emphasize and clarify particular details for your readers. Such focal points can have a profound impact on the persuasiveness of your work, so it is important for you to consider how you can use them to your best advantage. This chapter discusses ideas that will help you use visual materials and offers suggestions for including them in your thesis or dissertation.
Visual Materials in a Thesis or Dissertation
This chapter emphasizes these main points:
- Visual materials communicate ideas.
- Visual materials can serve as focal points to draw the attention of readers.
- The process of developing visual materials can enable a writer to understand and present a topic in new ways.
- A writer can obtain useful suggestions for using visual materials by looking at the articles and books published by “text-partners.”
- If a writer is unclear about what information should be displayed, it can be useful to sketch out a possible presentation on a piece of paper before working with sophisticated computer graphic programs.
- Visual materials can serve as support for an argument.
- Visual materials should be constructed as clearly as possible so that readers can understand them easily.
- Visual materials should be carefully labeled.
- Visual materials should be referred to in the text.
Connections Between Print and Visual Rhetoric
Considerable attention is now being paid to what is known as “visual rhetoric,” a term that is used to describe how visual images, as opposed to aural or verbal messages, communicate. Those who study visual rhetoric note that representational images are becoming increasingly important in communicating ideas and that they wield considerable influence on the beliefs, attitudes, opinions, and sometimes actions of those who view them. We are all familiar with the use of images in advertising and other obviously persuasive texts. But even in scholarly texts, which claim to be completely objective and are based on careful research, visual materials can create a persuasive presence, significantly penetrating the consciousness of the reader. In fact, in some cases, the power of visual materials can surpass that of words. As Charles A. Hill notes, “The phenomenon of presence is inherently linked to visual perception. It has often been remarked that a picture of one starving child is more persuasively powerful than statistics citing the starvation of millions” (29). In writing your thesis or dissertation, you might find that including graphic material will greatly enhance your ability to present your ideas.
Finding Examples Through Your Text-Partners
Chapter 2, “So What? Discovering Possibilities,” discusses the concept of text-partners, defined as the texts to which your thesis or dissertation is responding. Text-partners not only are useful for helping you generate ideas; they also model possible ways of using visual materials. Look for the articles and books written by your text-partners, noting how they use visual materials. Look at other articles and books as well and imitate the way in which visual materials are used.
The Function of Visual Materials
When you decide to include visual materials in your thesis or dissertation, it is important to consider what function you want them to fulfill—that is, what you want them to do and how you plan to use them to communicate with your reader. Will they provide a reference point that will help you develop an idea more clearly? Will they serve as an example? Will they enable you to make a comparison or evaluation of some sort? Will they enable you to examine a result more thoroughly so that you can draw a conclusion? Will they help you emphasize a particular idea? Visual materials are inherently rhetorical (that is, they have an impact on a reader or audience), and they can do what words do—exemplify, compare, contrast, illustrate, refer, emphasize, and so on. It is important, then, to use visual materials as deliberately and strategically as possible, not simply to show how much data you have managed to locate, to fill up space, or to enhance the appearance of a page. To focus your attention on the functionality of visual materials, I suggest that you complete these sentences when considering whether to include a graphic in your text:
The purpose of this (chart, graph, diagram, picture, etc.) is _______________________.
This graphic will enable me to present the following ideas more clearly: _______________________________.
Images have power, and, as the writer of a thesis or dissertation, you will be able to decide how they can function most effectively. Keep in mind that anything that stands out from the text, such as a photograph, design, table, graph, or chart—even text that is set off in some way—is likely to capture a reader’s attention. In fact, the tendency of most readers is to focus immediately on the image, sometimes skipping a verbal explanation entirely. Thus, if presentation of data is important to your thesis, it is important for you to construct your focal points carefully, considering them in the context of the ideas you want to develop. If you are unclear about the sort of graphic material you want to display, it is useful to sketch out a possible design by hand on a piece of paper. The act of sketching out possibilities will help you figure out what you want to say and the best means of saying it through graphic representation.
Constructing a Focal Point
As the term implies, a focal point focuses attention on a particular idea or concept. If your thesis or dissertation includes numerical data, visual materials are usually considered a requirement, helping both readers and writers. Readers will find a visual representation of statistical information easier to understand than if numbers are simply included as part of the text; they will be naturally drawn to it as they read. Writers will find a graphic presentation useful for organizing data and focusing ideas.
Let us consider a hypothetical situation. Suppose your thesis or dissertation is concerned in some way with the topic of cat and dog ownership in the United States and that you had accessed statistical information about this topic. In writing this chapter, I was able to locate information about this topic relatively easily on the Internet, although, of course, if I were seriously conducting research, I would want to search more deeply. For the sake of illustration, though, suppose you had found some information about cat and dog ownership presented in the form of two lists, one about dog ownership and the other about cat ownership. A list is usually easy to read. However, two lists might be more difficult because we tend to read from left to right, not up and down. Moreover, although the presentation in the two lists is straightforward, this method might not be the most useful visual strategy if your goal were to emphasize or compare some aspect of this information. For example, you might want to show how many people owned dogs compared to those who owned cats; if you wanted to display further comparative data, presenting two lists would require a reader to keep moving between them, making it difficult to note points of comparison. Note the following two lists in Table 7.1, which present a great deal of information about pet ownership, but not presented in a way that enables easy comparison.
Table 7.1. U.S. Pet Ownership Statistics
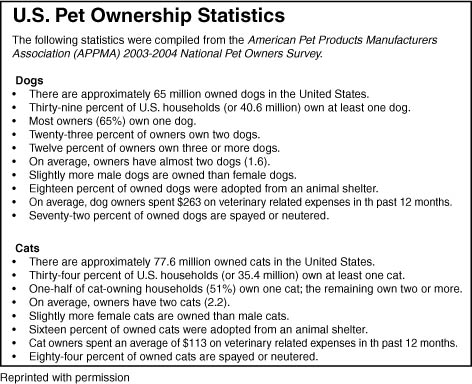
Table 7.2. U.S. Pet Ownership Statistics
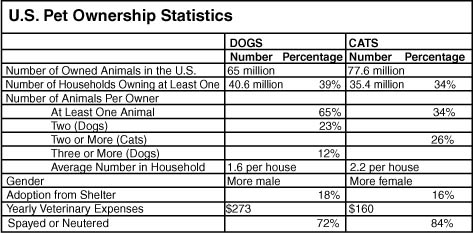
To focus your readers’ attention on similarities and differences between the two lists, a table comparing different aspects of the topic would be more effective. For example, Table 7.2 would enable a writer to note that there were fewer “owned” dogs in the United States than “owned” cats (65 million compared to 77.6 million), but that there were more dog households than cat households (40.6 million vs. 35.4 million). The table form would also enable a writer to note that whereas 26% of cat owners owned two or more cats, only 23% of dog owners owned two dogs, and only 12% owned three or more dogs. Table 7.2 illustrates the comparisons that could be made using this type of visual presentation.
You can create tables in the form of text, data, or both. A text table consists of a list of points and can sometimes be referred to simply as a list (the table at the beginning of this chapter that listed concepts associated with visual materials is an example), and a data table, of course, consists of numerical information. Data tables should be constructed to display the facts that you want to emphasize, and the goal is to make them as easy to read as possible.
Table 7.2 allows readers to understand comparative data more easily than from two lists. Moreover, an additional advantage of presenting information in a table is that the process of creating the table requires writers to grapple with the information more intensively, enabling them to understand it in new ways. Creating the table directs writers’ attention toward the points they want to emphasize and helps them figure out which focal points they want to develop. It might also provide insights about the topic that they didn’t have before, raise questions, and suggest directions they might want to explore further. For example, when I constructed the table comparing cat and dog ownership, I began to wonder why there were more owned cats than owned dogs, even though fewer households owned cats than owned dogs. I also wondered why owned dogs tended more frequently to be male while owned cats tended to be female. If this were a real topic that I was actually investigating, creating the table would have directed me toward areas for further exploration. If you have amassed a great deal of numerical data and are not sure how you can use it in your thesis or dissertation, I offer the following recommendation:
Construct a table.
The act of constructing the table, in and of itself, will give you ideas that you didn’t have before, help you discover additional information that you might need, generate questions about what you want to say about your topic, and lead you to think about new ideas. I have always found that the act of constructing a table has led me in new directions, and I strongly recommend it as a means of discovery.
Examples of Visual Materials
A table is a useful way to present precise numerical data. But of course, numbers can be presented in many other ways, such as bar graphs, line graphs, and pie charts. This section contains simple examples of how these can be used.
Bar Graphs
A bar graph is a useful method for showing the relationship among different quantities or amounts. It is a less precise method of display than a table, but it can be extremely effective because it is usually easy to read. Table 7.3 is an example bar graph based on a hypothetical survey concerned with the favorite pets of students.
Table 7.3. Favorite Pets of Students
![]()
This information could be displayed in the bar graph in Figure 7.1, to allow a reader to see at a glance that dogs are the favorite.
This graph is concerned with the relationship between two variables: the number of students and the choice of pets. However, bar graphs can also explain comparative data that refer to more than two variables. Figure 7.2 displays comparative data concerning the number of heart attacks suffered by men at various ages compared to those suffered by women.
This bar graph enables a reader to note easily that men and women differ in the number of heart attacks suffered at different ages. It indicates that the frequency of heart attacks increases with age and that men tend to suffer heart attacks more frequently than women, but that as people age, gender differences become less significant. Note that the graph has a clear title, that the graph is numbered as “Figure 7.2,” and that it includes information indicating how it should be read (the numbers are presented in terms of percentages, and the light bar refers to men, and the dark bar refers to women).
Figure 7.1. Favorite pets of students

Source: Fictitious data, original graph.
Figure 7.2. Cardiovascular events in England

Source: Diagram constructed by author with data from Department of Health, Health Survey for England 2003. The Stationary Office: London.
The two bar graphs exemplify several formatting requirements for including graphic materials in your thesis or dissertation:
- Each visual representation should be numbered, as in “Table 1,” “Table 2,” “Figure 1,” “Figure 2,” and so on.
- Each visual representation should have a title that clearly indicates its purpose.
- Each visual representation should include a key or legend that indicates how it should be read.
Figure 7.2 focused on differences between two groups: men and women. However, a bar graph can also show several variables, as in Figure 7.3, which is concerned with the immigrant professional workforce in selected states.
Figure 7.3. The immigrant professional workforce in selected states
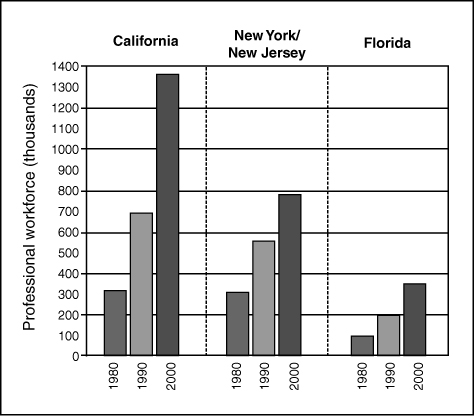
Source: Data obtained from U.S. Bureau of the Census, Public Use Micro-data. Sample 1980, 1990, and Current Population Survey 2000. Graph original.
The visual presentation here would enable a writer to point out that a greater number more immigrants in California had entered the professional workforce than in New York or Florida, a phenomenon that could than lead to an analysis of causation.
Pie Charts
Another useful way to present information is in the form of a pie chart, a visual representation that shows how a whole or a “pie” is divided. Pie charts are effective when there are only a small number of pieces to the “pie” and when the relationship between those pieces is important. For example, suppose your thesis or dissertation were concerned with showing changes in major causes of death in the United States, comparing percentages in 1950 with those in 2003. Figure 7.4 shows that a higher percentage died of heart disease in 1950 than in 2003 but that in 2003, a higher percentage of people died of cancer.
Figure 7.4. Major causes of death in the United States

Source: Constructed from data in the National Center for Health Statistics, in public domain. National Center for Health Statistics, Health, United States, 2005.
The pie chart format is a more dramatic strategy for presenting comparisons and is much easier to read than two lists. It immediately attracts attention, making it easier for readers to “see” and compare differences in causes of death between the different years. For a writer, the pie chart provides a useful point of reference.
Line Graphs
A line graph illustrates the relationship between two variables. Usually, the independent variable is plotted on the horizontal axis and the dependent variable is plotted along the vertical axis. Line graphs are useful for showing how one variable influences another and for displaying trends in data over time. They therefore enable the writer to make predictions based on established trends. Figure 7.5, concerned with the percentage of people in the United States who smoke cigarettes, allows a reader to see that the percentage has gone down between 1965 and 2003.
Figure 7.5. Percentage of the U.S. population that smokes cigarettes
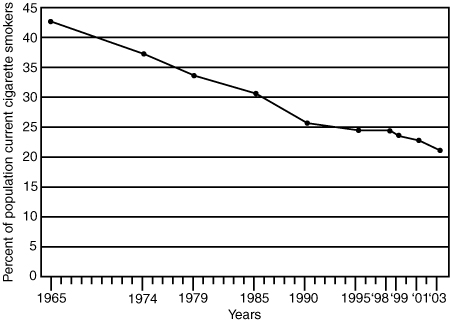
Source: Constructed from data obtained from the U.S. Department of Health and Human Services. Centers for Disease Control and Prevention. Health, U.S. 2005.
By tracing the line in the graph, a reader can see that that there has been a decrease in smoking over these years and can note the years in which the sharpest decrease occurred.
Line Graphs with Multiple Lines
As with bar graphs, line graphs can display more than one variable, making them particularly useful for showing comparative trends. Figure 7.6 shows changes in life expectancy between 1950 and 2005 for three different countries, Sweden, China, and Kenya. The lines highlight the fact that the life expectancy in China has continued to climb, whereas the life expectancy in Kenya has fallen, even though it rose from 1950 to 1985.
Figure 7.6. Changes in life expectancy since the 1950s
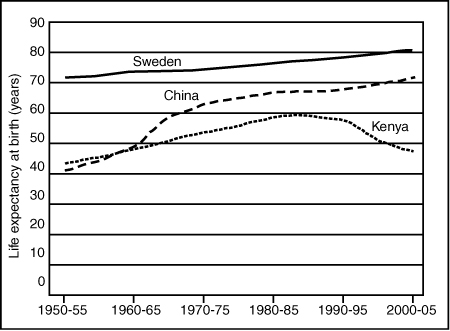
Source: Constructed from data obtained from The United Nations Population Division, World Population Prospects: The 2004 Revision.
The suggestions in this chapter are based on the idea that visual materials contribute to the argument of your thesis or dissertation but are not intended as a definitive discussion of various methods of data display. The most important point in this chapter is that visual materials fulfill an important function in developing your ideas and that awareness of that function will enable you to use visuals deliberately and insightfully.
Works Cited
Goggin, Maureen Daly. Defining Visual Rhetorics. Eds. Charles A. Hill and Marguerite Helmers. New Jersey: Lawrence Erlbaum, 2004.
Hill, Charles A. “The Psychology of Rhetorical Images.” Defining Visual Rhetorics. Eds. Charles A. Hill and Marguerite Helmers. New Jersey: Lawrence Erlbaum, 2004.
The visual materials in this section were constructed by the author. They are based on information that is in the public domain.