
You want to create a library of SVG generators that can be mixed and matched in applications involving graphical presentation of data.
If you plan to do a significant amount of SVG generation using XSLT, it is useful to develop a library of templates that generate graphical components that can be mixed and matched. This section shows several components that can graph data.
This example creates a general set of templates for generating graduated x- and y-axes:
<!-- Draw a graduated X-Axis -->
<xsl:template name="svgu:xAxis">
<xsl:param name="min"
select="0"/> <!-- Min x coordinate -->
<xsl:param name="max"
select="100"/> <!-- Max x coordinate -->
<xsl:param name="offsetX"
select="0"/> <!-- X offset of axis placement -->
<xsl:param name="offsetY"
select="0"/> <!-- Y offset of axis placement -->
<xsl:param name="width"
select="500"/> <!-- Width of the physical
plotting area -->
<xsl:param name="height"
select="500"/> <!-- Height of the physical plotting area -->
<xsl:param name="majorTicks"
select="10"/> <!-- Number of major axis divisions -->
<xsl:param name="majorBottomExtent"
select="4"/> <!-- Length of the major tick mark from
axis downward -->
<xsl:param name="majorTopExtent"
select="$majorBottomExtent"/> <!-- Length of the major tick
mark from axis upward -->
<xsl:param name="labelMajor"
select="true( )"/> <!-- Label the major tick marks if
true -->
<xsl:param name="minorTicks"
select="4"/> <!-- Number of minor axis divisions per
major division-->
<xsl:param name="minorBottomExtent"
select="2"/> <!-- Length of the minor tick mark from
axis downward -->
<xsl:param name="minorTopExtent"
select="$minorBottomExtent"/> <!-- Length of the minor tick
mark from axis upward -->
<xsl:param name="context"/> <!-- A user defined context indicator for
formatting template calls. -->
<!-- Compute the range and scaling factors -->
<xsl:variable name="range" select="$max - $min"/>
<xsl:variable name="scale" select="$width div $range"/>
<!-- Establish a Cartesian coordinate system with correct offset -->
<!-- and scaling -->
<svg:g transform="translate({$offsetX},{$offsetY+$height})
scale({$scale},-1) translate({$min},0)">
<!-- Draw a line for the axis -->
<svg:line x1="{$min}" y1="0" x2="{$max}" y2="0">
<xsl:attribute name="style">
<!-- Call a template that can be overridden to -->
<!-- determine the axis style -->
<xsl:call-template name="xAxisStyle">
<xsl:with-param name="context" select="$context"/>
</xsl:call-template>
</xsl:attribute>
</svg:line>
<!-- Draw the tick marks and labels -->
<xsl:call-template name="svgu:ticks">
<xsl:with-param name="xMajor1" select="$min"/>
<xsl:with-param name="yMajor1" select="$majorTopExtent"/>
<xsl:with-param name="xMajor2" select="$min"/>
<xsl:with-param name="yMajor2" select="-$majorBottomExtent"/>
<xsl:with-param name="labelMajor" select="$labelMajor"/>
<xsl:with-param name="freq" select="$minorTicks"/>
<xsl:with-param name="xMinor1" select="$min"/>
<xsl:with-param name="yMinor1" select="$minorTopExtent"/>
<xsl:with-param name="xMinor2" select="$min"/>
<xsl:with-param name="yMinor2" select="-$minorBottomExtent"/>
<xsl:with-param name="nTicks"
select="$majorTicks * $minorTicks + 1"/>
<xsl:with-param name="xIncr"
select="($max - $min) div ($majorTicks * $minorTicks)"/>
<xsl:with-param name="scale" select="1 div $scale"/>
</xsl:call-template>
</svg:g>
</xsl:template>
<xsl:template name="svgu:yAxis">
<xsl:param name="min"
select="0"/> <!-- Min x coordinate -->
<xsl:param name="max"
select="100"/> <!-- Max x coordinate -->
<xsl:param name="offsetX"
select="0"/> <!-- X offset of axis placement -->
<xsl:param name="offsetY"
select="0"/> <!-- Y offset of axis placement -->
<xsl:param name="width"
select="500"/> <!-- Width of the physical
plotting area -->
<xsl:param name="height"
select="500"/> <!-- Height of the physical plotting area -->
<xsl:param name="majorTicks"
select="10"/> <!-- Number of major axis divisions -->
<xsl:param name="majorLeftExtent"
select="4"/> <!-- Length of the major tick mark from
axis downward -->
<xsl:param name="majorRightExtent"
select="$majorBottomExtent"/> <!-- Length of the major tick
mark from axis upward -->
<xsl:param name="labelMajor"
select="true( )"/> <!-- Label the major tick marks if
true -->
<xsl:param name="minorTicks"
select="4"/> <!-- Number of minor axis divisions per
major division-->
<xsl:param name="minorLeftExtent"
select="2"/> <!-- Length of the minor tick mark from
axis right -->
<xsl:param name="minorRightExtent"
select="$minorBottomExtent"/> <!-- Length of the minor tick
mark from axis left -->
<xsl:param name="context"/> <!-- A user defined context indicator for
formatting template calls -->
<xsl:param name="majorLeftExtent"
select="4"/>
<xsl:param name="majorRightExtent"
select="$majorLeftExtent"/>
<xsl:param name="minorLeftExtent"
select="2"/>
<xsl:param name="minorRightExtent"
select="$minorLeftExtent"/>
<!-- Compute the range and scaling factors -->
<xsl:variable name="range" select="$max - $min"/>
<xsl:variable name="scale" select="$height div $range"/>
<!-- Establish a Cartesian coordinate system with correct offset -->
<!-- and scaling -->
<svg:g transform="translate({$offsetX},{$offsetY+$height})
scale(1,{-$scale}) translate(0,{-$min})">
<svg:line x1="0" y1="{$min}" x2="0" y2="{$max}">
<xsl:attribute name="style">
<xsl:call-template name="yAxisStyle">
<xsl:with-param name="context" select="$context"/>
</xsl:call-template>
</xsl:attribute>
</svg:line>
<xsl:call-template name="svgu:ticks">
<xsl:with-param name="xMajor1" select="-$majorLeftExtent"/>
<xsl:with-param name="yMajor1" select="$min"/>
<xsl:with-param name="xMajor2" select="$majorRightExtent"/>
<xsl:with-param name="yMajor2" select="$min"/>
<xsl:with-param name="labelMajor" select="$labelMajor"/>
<xsl:with-param name="freq" select="$minorTicks"/>
<xsl:with-param name="xMinor1" select="-$minorLeftExtent"/>
<xsl:with-param name="yMinor1" select="$min"/>
<xsl:with-param name="xMinor2" select="$minorRightExtent"/>
<xsl:with-param name="yMinor2" select="$min"/>
<xsl:with-param name="nTicks"
select="$majorTicks * $minorTicks + 1"/>
<xsl:with-param name="yIncr"
select="($max - $min) div ($majorTicks * $minorTicks)"/>
<xsl:with-param name="scale" select="1 div $scale"/>
</xsl:call-template>
</svg:g>
</xsl:template>
<!--Recursive utility for drawing tick marks and labels -->
<xsl:template name="svgu:ticks">
<xsl:param name="xMajor1" />
<xsl:param name="yMajor1" />
<xsl:param name="xMajor2" />
<xsl:param name="yMajor2" />
<xsl:param name="labelMajor"/>
<xsl:param name="freq" />
<xsl:param name="xMinor1" />
<xsl:param name="yMinor1" />
<xsl:param name="xMinor2" />
<xsl:param name="yMinor2" />
<xsl:param name="nTicks" select="0"/>
<xsl:param name="xIncr" select="0"/>
<xsl:param name="yIncr" select="0"/>
<xsl:param name="i" select="0"/>
<xsl:param name="scale"/>
<xsl:param name="context"/>
<xsl:if test="$i < $nTicks">
<xsl:choose>
<!-- Time to draw a major tick -->
<xsl:when test="$i mod $freq = 0">
<svg:line x1="{$xMajor1}" y1="{$yMajor1}"
x2="{$xMajor2}" y2="{$yMajor2}">
</svg:line>
<xsl:if test="$labelMajor">
<xsl:choose>This part of the code renders the tick marks along the x- and y-axes. This example hardcodes the format string to avoid yet another parameter, but you might consider using a parameter or passing the value to another template for formatting:
              <!-- Ticking along x-axis -->
               <xsl:when test="$xIncr > 0">
                 <!-- Tick label must compensate for distorted coordinate
                      system -->
                 <svg:text x="{$xMajor1}" y="{$yMajor2}"
                       transform="translate({$xMajor1},{$yMajor2})
                                  scale({$scale},-1)
                                  translate({-$xMajor1},{-$yMajor2})">
                          <xsl:attribute name="style">
                            <xsl:call-template name="xAxisLabelStyle">
                              <xsl:with-param name="context"
                                              select="$context"/>
                            </xsl:call-template>
                          </xsl:attribute>
                   <!-- Perhaps label format should be parameter -->
                   <xsl:value-of select="format-number($xMajor1,'#0.0')"/>
                 </svg:text>
               </xsl:when>
              <!-- Ticking along y-axis -->
               <xsl:otherwise>
                 <svg:text x="{$xMajor1}" y="{$yMajor1}"
                          transform="translate({$xMajor1},{$yMajor1})
                          scale(1,{-$scale})
                          translate({-$xMajor1},{-$yMajor1})">
                   <xsl:attribute name="style">
                     <xsl:call-template name="yAxisLabelStyle">
                       <xsl:with-param name="context" select="$context"/>
                     </xsl:call-template>
                   </xsl:attribute>
                   <xsl:value-of select="format-number($yMajor1,'#0.0')"/>
                 </svg:text>
               </xsl:otherwise>
             </xsl:choose>
           </xsl:if>
         </xsl:when>
          <!-- Time to draw a minor tick -->
         <xsl:otherwise>
           <svg:line x1="{$xMinor1}" y1="{$yMinor1}"
                 x2="{$xMinor2}" y2="{$yMinor2}">
           </svg:line>
         </xsl:otherwise>
       </xsl:choose>

        <!-- Recursive call for next tick -->
       <xsl:call-template name="svgu:ticks">
         <xsl:with-param name="xMajor1" select="$xMajor1 + $xIncr"/>
         <xsl:with-param name="yMajor1" select="$yMajor1 + $yIncr"/>
         <xsl:with-param name="xMajor2" select="$xMajor2 + $xIncr"/>
         <xsl:with-param name="yMajor2" select="$yMajor2 + $yIncr"/>
         <xsl:with-param name="labelMajor" select="$labelMajor"/>
         <xsl:with-param name="freq" select="$freq"/>
         <xsl:with-param name="xMinor1" select="$xMinor1 + $xIncr"/>
         <xsl:with-param name="yMinor1" select="$yMinor1 + $yIncr"/>
         <xsl:with-param name="xMinor2" select="$xMinor2 + $xIncr"/>
         <xsl:with-param name="yMinor2" select="$yMinor2 + $yIncr"/>
         <xsl:with-param name="nTicks" select="$nTicks"/>
         <xsl:with-param name="xIncr" select="$xIncr"/>
         <xsl:with-param name="yIncr" select="$yIncr"/>
         <xsl:with-param name="i" select="$i + 1"/>
         <xsl:with-param name="scale" select="$scale"/>
         <xsl:with-param name="context" select="$context"/>
       </xsl:call-template>
     </xsl:if>

   </xsl:template>

   <!-- Override this template to change x-axis style -->
   <xsl:template name="xAxisStyle">
     <xsl:param name="context"/>
      <xsl:text>stroke-width:0.5;stroke:black</xsl:text>
   </xsl:template>

   <!-- Override this template to change y-axis style -->
   <xsl:template name="yAxisStyle">
     <xsl:param name="context"/>
      <xsl:text>stroke-width:0.5;stroke:black</xsl:text>
   </xsl:template>

   <!-- Override this template to change x-axis label style -->
   <xsl:template name="xAxisLabelStyle">
     <xsl:param name="context"/>
     <xsl:text>text-anchor:middle; font-size:8;
               baseline-shift:-110%</xsl:text>
   </xsl:template>

   <!-- Override this template to change y-axis label style -->
   <xsl:template name="yAxisLabelStyle">
     <xsl:param name="context"/>
     <xsl:text>text-anchor:end;font-size:8;baseline-shift:-50%</xsl:text>
   </xsl:template>
This XSLT script produces x- and y-axes with major and minor tick marks and labels:
<xsl:stylesheet version="1.0"
  xmlns:xsl="http://www.w3.org/1999/XSL/Transform"
  xmlns:svg="http://www.w3.org/2000/svg"
  xmlns:svgu="http://www.ora.com/XSLTCookbook/ns/svg-utils"
  xmlns:test="http://www.ora.com/XSLTCookbook/ns/test"
  exclude-result-prefixes="svgu test">

  <xsl:import href="svg-utils.xslt"/>

  <xsl:output method="xml" version="1.0" encoding="UTF-8" indent="yes"
    doctype-public="-//W3C//DTD SVG 1.0/EN"
    doctype-system="http://www.w3.org/TR/2001/REC-SVG-20010904/DTD/svg10.dtd"/>

  <xsl:variable name="width" select="300"/>
  <xsl:variable name="height" select="300"/>
  <xsl:variable name="pwidth" select="$width * 0.8"/>
  <xsl:variable name="pheight" select="$height * 0.8"/>
  <xsl:variable name="offsetX" select="($width - $pwidth) div 2"/>
  <xsl:variable name="offsetY" select="($height - $pheight) div 2"/>

  <xsl:template match="/">


    <svg:svg width="{$width}" height="{$height}">

      <xsl:call-template name="svgu:xAxis">
        <xsl:with-param name="min" select="0"/>
        <xsl:with-param name="max" select="10"/>
        <xsl:with-param name="offsetX" select="$offsetX"/>
        <xsl:with-param name="offsetY" select="$offsetY"/>
        <xsl:with-param name="width" select="$pwidth"/>
        <xsl:with-param name="height" select="$pheight"/>
      </xsl:call-template>

      <xsl:call-template name="svgu:yAxis">
        <xsl:with-param name="min" select="0"/>
        <xsl:with-param name="max" select="10"/>
        <xsl:with-param name="offsetX" select="$offsetX"/>
        <xsl:with-param name="offsetY" select="$offsetY"/>
        <xsl:with-param name="width" select="$pwidth"/>
        <xsl:with-param name="height" select="$pheight"/>
      </xsl:call-template>

    </svg:svg>

  </xsl:template>

</xsl:stylesheet>
This template gives the axes shown in Figure 9-3.

By extending the major ticks across the full width and height, you can create a grid, shown in Figure 9-4.
      <xsl:call-template name="svgu:xAxis">
        <xsl:with-param name="min" select="0"/>
        <xsl:with-param name="max" select="10"/>
        <xsl:with-param name="offsetX" select="$offsetX"/>
        <xsl:with-param name="offsetY" select="$offsetY"/>
        <xsl:with-param name="width" select="$pwidth"/>
        <xsl:with-param name="height" select="$pheight"/>
        <xsl:with-param name="majorTopExtent" select="$pheight"/>
      </xsl:call-template>

      <xsl:call-template name="svgu:yAxis">
        <xsl:with-param name="min" select="0"/>
        <xsl:with-param name="max" select="10"/>
        <xsl:with-param name="offsetX" select="$offsetX"/>
        <xsl:with-param name="offsetY" select="$offsetY"/>
        <xsl:with-param name="width" select="$pwidth"/>
        <xsl:with-param name="height" select="$pheight"/>
        <xsl:with-param name="majorRightExtent" select="$pwidth"/>
      </xsl:call-template>
By also extending the minor ticks across the full width and height, you can create a finer grid, shown in Figure 9-5.
      <xsl:call-template name="svgu:xAxis">
        <xsl:with-param name="min" select="0"/>
        <xsl:with-param name="max" select="10"/>
        <xsl:with-param name="offsetX" select="$offsetX"/>
        <xsl:with-param name="offsetY" select="$offsetY"/>
        <xsl:with-param name="width" select="$pwidth"/>
        <xsl:with-param name="height" select="$pheight"/>
        <xsl:with-param name="majorTopExtent" select="$pheight"/>
        <xsl:with-param name="minorTopExtent" select="$pheight"/>
      </xsl:call-template>

      <xsl:call-template name="svgu:yAxis">
        <xsl:with-param name="min" select="0"/>
        <xsl:with-param name="max" select="10"/>
        <xsl:with-param name="offsetX" select="$offsetX"/>
        <xsl:with-param name="offsetY" select="$offsetY"/>
        <xsl:with-param name="width" select="$pwidth"/>
        <xsl:with-param name="height" select="$pheight"/>
        <xsl:with-param name="majorRightExtent" select="$pwidth"/>
        <xsl:with-param name="minorRightExtent" select="$pwidth"/>
      </xsl:call-template>
You can create a four-quadrant plot, shown in Figure 9-6, by shifting the axis and adjusting the extents for the grid:
      <xsl:call-template name="svgu:xAxis">
        <xsl:with-param name="min" select="-5"/>
        <xsl:with-param name="max" select="5"/>
        <xsl:with-param name="offsetX" select="0"/>
                  <xsl:with-param name="offsetY" select="-$pheight div 2"/>
        <xsl:with-param name="width" select="$pwidth"/>
        <xsl:with-param name="height" select="$pheight"/>
        <xsl:with-param name="majorTopExtent" select="$pwidth div 2"/>
                  <xsl:with-param name="majorBottomExtent" select="$pwidth div 2"/>
      </xsl:call-template>

      <xsl:call-template name="svgu:yAxis">
        <xsl:with-param name="min" select="-5"/>
        <xsl:with-param name="max" select="5"/>
        <xsl:with-param name="offsetX" select="-$pwidth div 2"/>
                  <xsl:with-param name="offsetY" select="0"/>
        <xsl:with-param name="width" select="$pwidth"/>
        <xsl:with-param name="height" select="$pheight"/>
        <xsl:with-param name="majorRightExtent" select="$pwidth div 2"/>
                  <xsl:with-param name="majorLeftExtent" select="$pwidth div 2"/>
      </xsl:call-template>
By default this code will align the labels to the ends of the grid lines; however, you can force the labels back to the axes by overriding two templates, producing the results shown in Figure 9-7.
   <xsl:template name="xAxisLabelYOffset">
     <xsl:value-of select="-$pheight div 2"/>
   </xsl:template>

   <xsl:template name="yAxisLabelXOffset">
     <xsl:value-of select="$pwidth div 2"/>
   </xsl:template>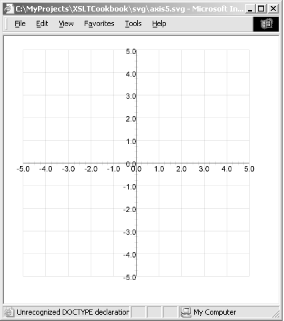
Another common way to plot data is in a bar chart. Bar charts are useful for comparisons. Create a utility that produces a bar for each data value passed to it. The width and color of the bars can be customized easily. The next example allows the bars to be oriented in various directions by using a rotation transformation on the coordinate system. Although this feature is useful, you have to compensate for how rotation affects text and the apparent order of the data values:
 <xsl:template name="svgu:bars">
  <xsl:param name="data" select="/.."/>  <!-- data to chart -->
  <xsl:param name="width" select="500"/>
  <xsl:param name="height" select="500"/>
  <xsl:param name="orientation" select="0"/>
  <xsl:param name="barWidth" select="5"/>
  <xsl:param name="offsetX" select="0"/>
  <xsl:param name="offsetY" select="0"/>
  <xsl:param name="boundingBox" select="false(  )"/>
  <xsl:param name="barLabel" select="false(  )"/>
  <xsl:param name="max">
   <xsl:call-template name="emath:max">
     <xsl:with-param name="nodes" select="$data"/>
   </xsl:call-template>
  </xsl:param>
  <xsl:param name="context"/>

 <xsl:variable name="numBars" select="count($data)"/>
  <xsl:variable name="spacing" select="$width div ($numBars + 1)"/>

 <xsl:if test="$boundingBox">
  <svg:g transform="translate({$offsetX},{$offsetY})
                translate({$width div 2},{$height div 2})
                rotate({$orientation - 180})
                translate({-$width div 2},{-$height div 2})">
     <svg:rect x="0" y="0"
      height="{$height}" width="{$width}"
      style="stroke: black;
             stroke-width:0.5;stroke-opacity:0.5;fill:none"/>
   </svg:g>
 </xsl:if>
 <!-- We change the data order to compenstate for rotation -->
 <!-- See sort below -->
  <xsl:variable name="data-order">
    <xsl:choose>
      <xsl:when test="$orientation mod 360 >= 180">ascending</xsl:when>
      <xsl:otherwise>descending</xsl:otherwise>
    </xsl:choose>
  </xsl:variable>

  <svg:g transform="translate({$offsetX},{$offsetY})
                translate({$width div 2},{$height div 2})
                rotate({$orientation - 180})
                translate({-$width div 2},{-$height div 2})
                scale(1,{$height div $max})">

    <xsl:for-each select="$data">
      <!-- We use a sort on position to traverse the data in reverse -->
      <!-- when necessary. -->
      <xsl:sort select="position(  )" data-type="number"
           order="{$data-order}"/>

      <xsl:variable name="pos" select="position(  )"/>
This example uses lines for the bars. Color and stroke width can be altered by overriding the BarStyle template. You might consider using rectangles, which give you the option of altering the border style:
      <svg:line x1="{$spacing * $pos}"
            y1="0"
            x2="{$spacing * $pos}"
            y2="{current(  )}" id="{$context}_bar_{$pos}">
         <xsl:attribute name="style">
           <xsl:value-of      select="concat('stroke-width: ',$barWidth,'; ')"/>
           <xsl:call-template name="svgu:barStyle">
             <xsl:with-param name="pos" select="$pos"/>
             <xsl:with-param name="context" select="$context"/>
           </xsl:call-template>
         </xsl:attribute>
      </svg:line>

      <!-- If user requests bar labels we position a text value of the -->
      <!-- of the data point above the bar. The complex serries of     -->
      <!-- transformations is used to make the text display correctly -->
      <!-- despite the rotations and scalings to the coordinate system -->
      <xsl:if test="$barLabel">
        <svg:text x="{$spacing * $pos}"
              y="{current(  ) * ($height div $max)}"
              transform="scale(1,{$max div $height})
                         translate(0,10)
                         translate({$spacing * $pos},{current(  ) *
                                   ($height div $max)})
                         rotate({180 - $orientation})
                         translate({-$spacing * $pos},
                          {-current(  ) * ($height div $max)})"
              id="{$context}_barLabel_{$pos}">
              <xsl:attribute name="style">
                 <xsl:call-template name="svgu:barLabelStyle">
                   <xsl:with-param name="pos" select="$pos"/>
                   <xsl:with-param name="context" select="$context"/>
                 </xsl:call-template>
              </xsl:attribute>
          <xsl:value-of select="."/>
        </svg:text>
      </xsl:if>
    </xsl:for-each>
  </svg:g>

</xsl:template>

<xsl:template name="svgu:barStyle">
  <xsl:param name="pos"/>
  <xsl:param name="context"/>
  <xsl:variable name="colors" select="document('')/*/svgu:color"/>
   <xsl:value-of
        select="concat('stroke: ',$colors[($pos - 1 ) mod count($colors)
                + 1])"/>
</xsl:template>

<xsl:template name="svgu:barLabelStyle">
  <xsl:param name="pos"/>
  <xsl:param name="context"/>
  <xsl:value-of select=" 'text-anchor: middle' "/>
</xsl:template>
The following stylesheet plots data by using bars. The results are shown in Figure 9-8.
<xsl:stylesheet version="1.0"
  xmlns:xsl="http://www.w3.org/1999/XSL/Transform"
  xmlns:svg="http://www.w3.org/2000/svg"
  xmlns:svgu="http://www.ora.com/XSLTCookbook/ns/svg-utils"
  xmlns:test="http://www.ora.com/XSLTCookbook/ns/test"
  exclude-result-prefixes="svgu">

<xsl:import href="svg-utils.xslt"/>

<xsl:output method="xml" version="1.0" encoding="UTF-8" indent="yes"
  doctype-public="-//W3C//DTD SVG 1.0/EN"
  doctype-system="http://www.w3.org/TR/2001/REC-SVG-20010904/DTD/svg10.dtd"/>

<test:data>1.0</test:data>
<test:data>2.0</test:data>
<test:data>3.0</test:data>
<test:data>4.0</test:data>
<test:data>5.0</test:data>
<test:data>13.0</test:data>
<test:data>2.7</test:data>
<test:data>13.9</test:data>
<test:data>22.0</test:data>
<test:data>8.5</test:data>

<xsl:template match="/">

<svg:svg width="400" height="400">

  <xsl:call-template name="svgu:bars">
    <xsl:with-param name="data" select="document('')/*/test:data"/>
    <xsl:with-param name="width" select=" '300' "/>
    <xsl:with-param name="height" select=" '350' "/>
    <xsl:with-param name="orientation" select=" '0' "/>
    <xsl:with-param name="offsetX" select=" '50' "/>
    <xsl:with-param name="offsetY" select=" '25' "/>
    <xsl:with-param name="boundingBox" select="1"/>
    <xsl:with-param name="barLabel" select="1"/>
    <xsl:with-param name="max" select="25"/>
  </xsl:call-template>

</svg:svg>

</xsl:template>

 <xsl:template name="svgu:barLabelStyle">
   <xsl:param name="pos"/>
   <xsl:param name="context"/>
   <xsl:text>text-anchor: middle; font-size: 8</xsl:text>
 </xsl:template>

</xsl:stylesheet>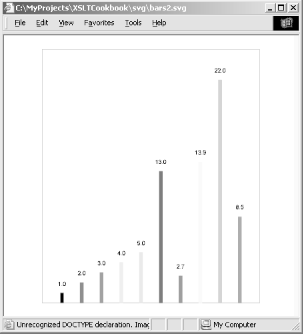
This variation rotates the display to create a horizontal bar chart, as shown in Figure 9-9. The code does not attempt to constrain the angle of orientation, even though only multiples of 90 degrees are likely values.[19]
  <xsl:call-template name="svgu:bars">
    <xsl:with-param name="data" select="document('')/*/test:data"/>
    <xsl:with-param name="width" select=" '300' "/>
    <xsl:with-param name="height" select=" '350' "/>
    <xsl:with-param name="orientation" select=" '90' "/>
    <xsl:with-param name="offsetX" select=" '50' "/>
    <xsl:with-param name="offsetY" select=" '25' "/>
    <xsl:with-param name="boundingBox" select="1"/>
    <xsl:with-param name="barLabel" select="1"/>
    <xsl:with-param name="max" select="25"/>
  </xsl:call-template>
Axes and grids are useless unless you can actually plot some data in them. One common way to plot data is with an XY plot in which one value is shown as a function of another. You can create a utility that handles one set of data points at a time and use it several times to plot different data sets on the same graph:
  <xsl:template name="svgu:xyPlot">
    <xsl:param name="dataX" select="/.."/> <!-- x values -->
    <xsl:param name="dataY" select="/.."/>
    <xsl:param name="offsetX" select="0"/>
    <xsl:param name="offsetY" select="0"/>
    <xsl:param name="width" select="500"/>
    <xsl:param name="height" select="500"/>
    <xsl:param name="boundingBox" select="false(  )"/>
    <xsl:param name="context"/>
    <xsl:param name="maxX">
     <xsl:call-template name="emath:max">
       <xsl:with-param name="nodes" select="$dataX"/>
     </xsl:call-template>
    </xsl:param>
    <xsl:param name="maxY">
     <xsl:call-template name="emath:max">
       <xsl:with-param name="nodes" select="$dataY"/>
     </xsl:call-template>
    </xsl:param>

    <xsl:variable name="scaleX" select="$width div $maxX"/>
    <xsl:variable name="scaleY" select="$height div $maxY"/>
This section uses a Java extension function for simplicity, but you
could also implement max in XPath by using select="($scaleX > $scaleY) * $scaleX + not($scaleX
> $scaleY) * $scaleY)":
    <xsl:variable name="scale" select="Math:max($scaleX,$scaleY)"/>

    <xsl:if test="$boundingBox">
      <svg:g transform="translate({$offsetX},{$offsetY})">
       <svg:rect x="0" y="0" height="{$height}" width="{$width}"
                 style="stroke: black;stroke-width:0.5;
                        stroke-opacity:0.5;fill:none"/>
     </svg:g>
    </xsl:if>
I draw the curve using simple line segments, but a Bézier curve command could result in a smoother effect at the expense of greater code complexity. Since this book covers XSLT rather than SVG, you’ll have to settle for simplicity. The trick to using cubic Bézier curves might be to plot three points at a time using the center point as the control point, but I have not tested this idea. An intuitive visualization of Bézier curves is available at http://home.earthlink.net/~edwardsrg/Adobe/bezier.html:
    <svg:path transform="translate({$offsetX},{$height + $offsetY})
                                scale({$scaleX},{-$scaleY})">
      <xsl:attribute name="d">
        <xsl:for-each select="$dataX">
          <xsl:variable name="pos" select="position(  )"/>
          <xsl:variable name="x" select="current(  ) "/>
          <xsl:variable name="y" select="$dataY[$pos]"/>
          <xsl:choose>
            <xsl:when test="$pos = 1">
              <xsl:text>M </xsl:text>
            </xsl:when>
            <xsl:otherwise> L </xsl:otherwise>
          </xsl:choose>
          <xsl:value-of select="$x"/>,<xsl:value-of select="$y"/>
        </xsl:for-each>
        </xsl:attribute>
        <xsl:attribute name="style">
          <xsl:call-template name="svgu:xyPlotStyle">
            <xsl:with-param name="scale" select="$scale"/>
            <xsl:with-param name="context" select="$context"/>
          </xsl:call-template>
        </xsl:attribute>
    </svg:path>
  </xsl:template>

   <xsl:template name="svgu:xyPlotStyle">
     <xsl:param name="context"/>
     <xsl:param name="scale"/>
     <xsl:value-of select="concat('fill: none; stroke: black; stroke-width:',1 div
         $scale,'; ')"/>
   </xsl:template>
This XSLT script exercises the XY plot template, producing the results shown in Figure 9-10. For simplicity, I embed the data within the actual stylesheet. In practice, you would extract the data from another XML document:
<xsl:stylesheet version="1.0"
  xmlns:xsl="http://www.w3.org/1999/XSL/Transform"
  xmlns:svg="http://www.w3.org/2000/svg"
  xmlns:svgu="http://www.ora.com/XSLTCookbook/ns/svg-utils"
  xmlns:test="http://www.ora.com/XSLTCookbook/ns/test"
  exclude-result-prefixes="svgu test">

<xsl:import href="svg-utils.xslt"/>

<xsl:output method="xml" version="1.0" encoding="UTF-8" indent="yes"
  doctype-public="-//W3C//DTD SVG 1.0/EN"
  doctype-system="http://www.w3.org/TR/2001/REC-SVG-20010904/DTD/svg10.dtd"/>

<test:xdata>0</test:xdata>
<test:xdata>5</test:xdata>
<test:xdata>10</test:xdata>
<test:xdata>15</test:xdata>
<test:xdata>20</test:xdata>
<test:xdata>25</test:xdata>
<test:xdata>30</test:xdata>
<!-- Rest of x data elided ... -->

<test:ydata>0</test:ydata>
<test:ydata>0.087155743</test:ydata>
<test:ydata>0.173648178</test:ydata>
<test:ydata>0.258819045</test:ydata>
<test:ydata>0.342020143</test:ydata>
<test:ydata>0.422618262</test:ydata>
<test:ydata>0.5</test:ydata>
<!-- Rest of y data elided ... -->

<xsl:variable name="w" select="400"/>
<xsl:variable name="h" select="300"/>
<xsl:variable name="pwidth" select="$w * 0.8"/>
<xsl:variable name="pheight" select="$h * 0.8"/>
<xsl:variable name="offsetX" select="($w - $pwidth) div 2"/>
<xsl:variable name="offsetY" select="($h - $pheight) div 2"/>

<xsl:template match="/">

<svg:svg width="{$w}" height="{$h}">

  <xsl:call-template name="svgu:xyPlot">
    <xsl:with-param name="dataX" select="document('')/*/test:xdata"/>
    <xsl:with-param name="dataY" select="document('')/*/test:ydata"/>
    <xsl:with-param name="offsetX" select="$offsetX"/>
    <xsl:with-param name="offsetY" select="$offsetY"/>
    <xsl:with-param name="width" select="$pwidth"/>
    <xsl:with-param name="height" select="$pheight"/>
    <!--
    <xsl:with-param name="minY" select="-1"/>
    <xsl:with-param name="maxY" select="1"/>
    -->
  </xsl:call-template>

  <xsl:call-template name="svgu:xAxis">
    <xsl:with-param name="min" select="0"/>
    <xsl:with-param name="max" select="360"/>
    <xsl:with-param name="offsetX" select="$offsetX"/>
    <xsl:with-param name="offsetY" select="-$pheight div 2 + $offsetY"/>
    <xsl:with-param name="width" select="$pwidth"/>
    <xsl:with-param name="height" select="$pheight"/>
    <xsl:with-param name="majorTicks" select="6"/>
      <!-- Number of major axis divisions -->
    <xsl:with-param name="minorTicks" select="4"/>
      <!-- Number of major axis divisions -->
  </xsl:call-template>

  <xsl:call-template name="svgu:yAxis">
    <xsl:with-param name="min" select="-1"/>
    <xsl:with-param name="max" select="1"/>
    <xsl:with-param name="offsetX" select="$offsetX"/>
    <xsl:with-param name="offsetY" select="$offsetY"/>
    <xsl:with-param name="width" select="$pwidth"/>
    <xsl:with-param name="height" select="$pheight"/>
  </xsl:call-template>

</svg:svg>

</xsl:template>

</xsl:stylesheet>
The following code, whose results are shown in Figure 9-11, demonstrates how to plot multiple data sets and customize the line style by overriding a template:
<xsl:stylesheet version="1.0"
  xmlns:xsl="http://www.w3.org/1999/XSL/Transform"
  xmlns:svg="http://www.w3.org/2000/svg"
  xmlns:svgu="http://www.ora.com/XSLTCookbook/ns/svg-utils"
  xmlns:test="http://www.ora.com/XSLTCookbook/ns/test"
  exclude-result-prefixes="svgu test">

<xsl:import href="svg-utils.xslt"/>

<xsl:output method="xml" version="1.0" encoding="UTF-8" indent="yes"
  doctype-public="-//W3C//DTD SVG 1.0/EN"
  doctype-system="http://www.w3.org/TR/2001/REC-SVG-20010904/DTD/svg10.dtd"/>

<!-- Data values elided ... -->

<xsl:variable name="w" select="400"/>
<xsl:variable name="h" select="300"/>
<xsl:variable name="pwidth" select="$w * 0.8"/>
<xsl:variable name="pheight" select="$h * 0.8"/>
<xsl:variable name="offsetX" select="($w - $pwidth) div 2"/>
<xsl:variable name="offsetY" select="($h - $pheight) div 2"/>

<xsl:template match="/">

<svg:svg width="{$w}" height="{$h}">

  <xsl:call-template name="svgu:xyPlot">
    <xsl:with-param name="dataX" select="document('')/*/test:xdata"/>
    <xsl:with-param name="dataY" select="document('')/*/test:ydata"/>
    <xsl:with-param name="offsetX" select="$offsetX"/>
    <xsl:with-param name="offsetY" select="$offsetY"/>
    <xsl:with-param name="width" select="$pwidth"/>
    <xsl:with-param name="height" select="$pheight"/>
    <xsl:with-param name="maxY" select="40"/>
  </xsl:call-template>

  <xsl:call-template name="svgu:xyPlot">
    <xsl:with-param name="dataX" select="document('')/*/test:xdata"/>
    <xsl:with-param name="dataY" select="document('')/*/test:y2data"/>
    <xsl:with-param name="offsetX" select="$offsetX"/>
    <xsl:with-param name="offsetY" select="$offsetY"/>
    <xsl:with-param name="width" select="$pwidth"/>
    <xsl:with-param name="height" select="$pheight"/>
    <xsl:with-param name="maxY" select="40"/>
    <xsl:with-param name="context" select="2"/>
  </xsl:call-template>

  <xsl:call-template name="svgu:xAxis">
    <xsl:with-param name="min" select="0"/>
    <xsl:with-param name="max" select="6"/>
    <xsl:with-param name="offsetX" select="$offsetX"/>
    <xsl:with-param name="offsetY" select="$offsetY"/>
    <xsl:with-param name="width" select="$pwidth"/>
    <xsl:with-param name="height" select="$pheight"/>
    <xsl:with-param name="majorTopExtent" select="$pheight"/>
    <xsl:with-param name="minorTopExtent" select="$pheight"/>
  </xsl:call-template>

  <xsl:call-template name="svgu:yAxis">
    <xsl:with-param name="min" select="0"/>
    <xsl:with-param name="max" select="40"/>
    <xsl:with-param name="offsetX" select="$offsetX"/>
    <xsl:with-param name="offsetY" select="$offsetY"/>
    <xsl:with-param name="width" select="$pwidth"/>
    <xsl:with-param name="height" select="$pheight"/>
    <xsl:with-param name="majorRightExtent" select="$pwidth"/>
    <xsl:with-param name="minorRightExtent" select="$pwidth"/>
  </xsl:call-template>

</svg:svg>

</xsl:template>

<!— Custom style uses context to figure out what line is being drawn —>
                  <xsl:template name="svgu:xyPlotStyle">
                  <xsl:param name="context"/>
                  <xsl:param name="scale"/>
                  <xsl:choose>
                  <xsl:when test="$context = 2">
                  <xsl:value-of select="concat('fill: none; stroke: red;
                  stroke-width:',16 div $scale,'; ')"/>
                  </xsl:when>
                  <xsl:otherwise>
                  <xsl:value-of select="concat('fill: none; stroke: black;
                  stroke-width:',1 div $scale,'; ')"/>
                  </xsl:otherwise>
                  </xsl:choose>
                  </xsl:template>

</xsl:stylesheet>
Pie charts provide another common way to compare data. You can create a utility for generating these charts. The key to creating a pie chart is having a means to create the slices of the pie, which invariably involves trigonometry. Since XSLT does not come with trigonometric functions, you will use a Java-based extension. Of course, this immediately limits the portability of our stylesheet. If portability is a must, you could implement sine and cosine functions in XSLT (see Recipe 2.5 for guidance.) Otherwise, include the following code in stylesheets that require Java math extensions. Details vary from processor to processor, so see Chapter 12 for more detailed information. This example works for Saxon:
<xsl:stylesheet
  <!-- v. 1.1 is defunct but works in Saxon to enable the -->
  <!-- xsl:script feature. -->
  version="1.1"
  xmlns:xsl="http://www.w3.org/1999/XSL/Transform"
  xmlns:svg="http://www.w3.org/2000/svg"
  xmlns:svgu="http://www.ora.com/XSLTCookbook/ns/svg-utils"
  xmlns:emath="http://www.exslt.org/math"
  xmlns:Math="java:java.lang.Math" extension-element-prefixes="Math"
       exclude-result-prefixes="svgu">

  <xsl:script implements-prefix="Math"
                   xmlns:Math="java:java.lang.Math"
                   language="java"
                   src="java:java.lang.Math"/>

  <!-- We use some XSLT stuff already developed in chatper 2 -->
  <xsl:include href="../math/math.max.xslt"/>
  <xsl:include href="../math/math.min.xslt"/>
...
</xsl:stylesheet>
The routine that does most of the mathematical work is
svgu:pieSlice. This routine was adapted from a
Perl program in SVG Essentials by J. David
Eisenberg (O’Reilly, 2002). The trigonometry is
beyond the scope of this book, but essentially, the routine lets you
draw arcs
(based on
rotations around a center coordinate) to compensate for
SVG’s less-intuitive specification of arcs:
<xsl:variable name="svgu:pi" select="3.1415927"/>
<xsl:template name="svgu:pieSlice">
<xsl:param name="cx" select="100"/> <!-- Center x -->
<xsl:param name="cy" select="100"/> <!-- Center y -->
<xsl:param name="r" select="50"/> <!-- Radius -->
<xsl:param name="theta" select="0"/> <!-- Beginning angle in degrees-->
<xsl:param name="delta" select="90"/> <!-- Arc extent in degrees -->
<xsl:param name="phi" select="0"/> <!-- x-axis rotation angle -->
<xsl:param name="style" select=" 'fill: red;' "/>
<xsl:param name="num"/>
<xsl:param name="context"/>
<!--Convert angles to radians -->
<xsl:variable name="theta1"
select="$theta * $svgu:pi div 180"/>
<xsl:variable name="theta2"
select="($delta + $theta) * $svgu:pi div 180"/>
<xsl:variable name="phi_r" select="$phi * $svgu:pi div 180"/>
<!--Figure out begin and end coordinates -->
<xsl:variable name="x0"
select="$cx + Math:cos($phi_r) * $r * Math:cos($theta1) +
Math:sin(-$phi_r) * $r * Math:sin($theta1)"/>
<xsl:variable name="y0"
select="$cy + Math:sin($phi_r) * $r * Math:cos($theta1) +
Math:cos($phi_r) * $r * Math:sin($theta1)"/>
<xsl:variable name="x1"
select="$cx + Math:cos($phi_r) * $r * Math:cos($theta2) +
Math:sin(-$phi_r) * $r * Math:sin($theta2)"/>
<xsl:variable name="y1"
select="$cy + Math:sin($phi_r) * $r * Math:cos($theta2) +
Math:cos($phi_r) * $r * Math:sin($theta2)"/>
<xsl:variable name="large-arc" select="($delta > 180) * 1"/>
<xsl:variable name="sweep" select="($delta > 0) * 1"/>
<svg:path style="{$style} id="{$context}_pieSlice_{$num}">
<xsl:attribute name="d">
<xsl:value-of select="concat('M ', $x0,' ',$y0,
' A ', $r,' ',$r,',',
$phi,',',
$large-arc,',',
$sweep,',',
$x1,' ',$y1,
' L ',$cx,' ',$cy,
' L ', $x0,' ',$y0)"/>
</xsl:attribute>
</svg:path>
</xsl:template>
<xsl:template name="svgu:pieSliceLabel">
<xsl:param name="label" /> <!-- Label -->
<xsl:param name="cx" select="100"/> <!-- Center x -->
<xsl:param name="cy" select="100"/> <!-- Center y -->
<xsl:param name="r" select="50"/> <!-- Radius -->
<xsl:param name="theta" select="0"/> <!-- Beginning angle in degrees-->
<xsl:param name="delta" select="90"/> <!-- Arc extent in degrees -->
<xsl:param name="style" select=" 'font-size: 18;' "/>
<xsl:param name="num"/>
<xsl:param name="context"/>
<!--Convert angles to radians -->
<xsl:variable name="theta2" select="(($delta + $theta) mod 360 + 360) mod 360"/>
<!-- normalize angles -->
<xsl:variable name="theta2_r" select="$theta2 * $svgu:pi div 180"/>
<xsl:variable name="x" select="$cx + $r * Math:cos($theta2_r)"/>
<xsl:variable name="y" select="$cy + $r * Math:sin($theta2_r)"/>
<!-- Compute the point to anchor text based on position -->
<!-- around the pie. This create a more or less uniform spacing -->
<xsl:variable name="anchor">
<xsl:choose>
<xsl:when test="contains($style,'text-anchor')"></xsl:when>
<xsl:when test="$theta2 >= 0 and $theta2 <= 45">start</xsl:when>
<xsl:when test="$theta2 > 45 and
$theta2 <= 135">middle</xsl:when>
<xsl:when test="$theta2 > 135 and $theta2 <= 225">end</xsl:when>
<xsl:when test="$theta2 > 225 and
$theta2 <= 315">middle</xsl:when>
<xsl:otherwise>start</xsl:otherwise>
</xsl:choose>
</xsl:variable>
<svg:text x="{$x}" y="{$y}"
style="text-anchor:{$anchor};{$style}"
id="{$context}_pieSliceLabel_{$num}">
<xsl:value-of select="$label"/>
</svg:text>
</xsl:template>
<xsl:template name="svgu:pie">
<xsl:param name="data" select="/.."/> <!-- Data to chart -->
<xsl:param name="cx" select="100"/> <!-- Center x -->
<xsl:param name="cy" select="100"/> <!-- Center y -->
<xsl:param name="r" select="50"/> <!-- Radius -->
<xsl:param name="theta" select="-90"/> <!-- Beginning angle for first
slice in degrees-->
<xsl:param name="context"/> <!-- User data to identify this
invocation -->
<xsl:call-template name="svgu:pieImpl">
<xsl:with-param name="data" select="$data"/>
<xsl:with-param name="cx" select="$cx"/>
<xsl:with-param name="cy" select="$cy"/>
<xsl:with-param name="r" select="$r"/>
<xsl:with-param name="theta" select="$theta"/>
<xsl:with-param name="sum" select="sum($data)"/>
<xsl:with-param name="context" select="$context"/>
</xsl:call-template>
</xsl:template>
<!-- Recursive implementation -->
<xsl:template name="svgu:pieImpl">
<xsl:param name="data" />
<xsl:param name="cx" />
<xsl:param name="cy" />
<xsl:param name="r" />
<xsl:param name="theta"/>
<xsl:param name="sum"/>
<xsl:param name="context"/>
<xsl:param name="i" select="1"/>
<xsl:if test="count($data) >= $i">
<xsl:variable name="delta" select="($data[$i] * 360) div $sum"/>
<!-- Draw slice of pie -->
<xsl:call-template name="svgu:pieSlice">
<xsl:with-param name="cx" select="$cx"/>
<xsl:with-param name="cy" select="$cy"/>
<xsl:with-param name="r" select="$r"/>
<xsl:with-param name="theta" select="$theta"/>
<xsl:with-param name="delta" select="$delta"/>
<xsl:with-param name="style">
<xsl:call-template name="svgu:pieSliceStyle">
<xsl:with-param name="i" select="$i"/>
<xsl:with-param name="context" select="$context"/>
</xsl:call-template>
</xsl:with-param>
<xsl:with-param name="num" select="$i"/>
<xsl:with-param name="context" select="$context"/>
</xsl:call-template>
<!-- Recursive call for next slice -->
<xsl:call-template name="svgu:pieImpl">
<xsl:with-param name="data" select="$data"/>
<xsl:with-param name="cx" select="$cx"/>
<xsl:with-param name="cy" select="$cy"/>
<xsl:with-param name="r" select="$r"/>
<xsl:with-param name="theta" select="$theta + $delta"/>
<xsl:with-param name="sum" select="$sum"/>
<xsl:with-param name="context" select="$context"/>
<xsl:with-param name="i" select="$i + 1"/>
</xsl:call-template>
</xsl:if>
</xsl:template>
<!-- Arranges the lables around the chart for each slice -->
<xsl:template name="svgu:pieLabels">
<xsl:param name="data" select="/.."/> <!-- Data for slices -->
<xsl:param name="labels" select="$data"/> <!-- Node set of labels to
chart. Defaults to data -->
<xsl:param name="cx" select="100"/> <!-- Center x -->
<xsl:param name="cy" select="100"/> <!-- Center y -->
<xsl:param name="r" select="50"/> <!-- Radius -->
<xsl:param name="theta" select="-90"/> <!-- Beginning angle for first
slice in degrees-->
<xsl:param name="context"/> <!-- User data to identify this
invocation -->
<xsl:call-template name="svgu:pieLabelsImpl">
<xsl:with-param name="data" select="$data"/>
<xsl:with-param name="labels" select="$labels"/>
<xsl:with-param name="cx" select="$cx"/>
<xsl:with-param name="cy" select="$cy"/>
<xsl:with-param name="r" select="$r"/>
<xsl:with-param name="theta" select="$theta"/>
<xsl:with-param name="sum" select="sum($data)"/>
<xsl:with-param name="context" select="$context"/>
</xsl:call-template>
</xsl:template>
<xsl:template name="svgu:pieLabelsImpl">
<xsl:param name="data" />
<xsl:param name="labels"/>
<xsl:param name="cx" />
<xsl:param name="cy" />
<xsl:param name="r" />
<xsl:param name="theta"/>
<xsl:param name="sum"/>
<xsl:param name="context"/>
<xsl:param name="i" select="1"/>
<xsl:if test="count($data) >= $i">
<xsl:variable name="delta" select="($data[$i] * 360) div $sum"/>
<!-- Draw slice of pie -->
<xsl:call-template name="svgu:pieSliceLabel">
<xsl:with-param name="label" select="$labels[$i]"/>
<xsl:with-param name="cx" select="$cx"/>
<xsl:with-param name="cy" select="$cy"/>
<xsl:with-param name="r" select="$r"/>
<xsl:with-param name="theta" select="$theta"/>
<xsl:with-param name="delta" select="$delta div 2"/>
<xsl:with-param name="style">
<xsl:call-template name="svgu:pieSliceLabelStyle">
<xsl:with-param name="i" select="$i"/>
<xsl:with-param name="value" select="$data[$i]"/>
<xsl:with-param name="label" select="$labels[$i]"/>
<xsl:with-param name="context" select="$context"/>
</xsl:call-template>
</xsl:with-param>
<xsl:with-param name="num" select="$i"/>
<xsl:with-param name="context" select="$context"/>
</xsl:call-template>
<!-- Recursive call for next slice label -->
<xsl:call-template name="svgu:pieLabelsImpl">
<xsl:with-param name="data" select="$data"/>
<xsl:with-param name="labels" select="$labels"/>
<xsl:with-param name="cx" select="$cx"/>
<xsl:with-param name="cy" select="$cy"/>
<xsl:with-param name="r" select="$r"/>
<xsl:with-param name="theta" select="$theta + $delta"/>
<xsl:with-param name="sum" select="$sum"/>
<xsl:with-param name="context" select="$context"/>
<xsl:with-param name="i" select="$i + 1"/>
</xsl:call-template>
</xsl:if>
</xsl:template>
<!-- Override to alter a slice's style -->
<xsl:template name="svgu:pieSliceStyle">
<xsl:param name="i"/>
<xsl:param name="context"/>
<xsl:variable name="colors" select="document('')/*/svgu:color"/>
<xsl:value-of select="concat('stroke:black;
stroke-width:0.5;
fill: ',$colors[($i - 1 ) mod
count($colors) + 1])"/>
</xsl:template>
<!-- Override to alter a slice label's style -->
<xsl:template name="svgu:pieSliceLabelStyle">
<xsl:param name="i"/>
<xsl:param name="value"/>
<xsl:param name="label" />
<xsl:param name="context"/>
<xsl:text>font-size: 16;</xsl:text>
</xsl:template>The following stylesheet creates a pie chart, as shown in Figure 9-12, from sample data:
<xsl:stylesheet version="1.0"
  xmlns:xsl="http://www.w3.org/1999/XSL/Transform"
  xmlns:svg="http://www.w3.org/2000/svg"
  xmlns:svgu="http://www.ora.com/XSLTCookbook/ns/svg-utils"
  xmlns:test="http://www.ora.com/XSLTCookbook/ns/test"
  exclude-result-prefixes="svgu test">

<xsl:include href="svg-utils.xslt"/>

<xsl:output method="xml" version="1.0" encoding="UTF-8" indent="yes"
  doctype-public="-//W3C//DTD SVG 1.0/EN"
  doctype-system="http://www.w3.org/TR/2001/REC-SVG-20010904/DTD/svg10.dtd"/>

<test:data>1.0</test:data>
<test:data>2.0</test:data>
<test:data>3.0</test:data>
<test:data>4.0</test:data>
<test:data>5.0</test:data>
<test:data>13.0</test:data>

<xsl:template match="/">

<svg:svg width="500" height="500">

  <xsl:call-template name="svgu:pie">
    <xsl:with-param name="data" select="document('')/*/test:data"/>
    <xsl:with-param name="cx" select="250"/>
    <xsl:with-param name="cy" select="250"/>
    <xsl:with-param name="r" select="100"/>
    <xsl:with-param name="theta" select="-90"/>
  </xsl:call-template>

  <xsl:call-template name="svgu:pieLabels">
    <xsl:with-param name="data" select="document('')/*/test:data"/>
    <xsl:with-param name="cx" select="250"/>
    <xsl:with-param name="cy" select="250"/>
    <xsl:with-param name="r" select="125"/>
    <xsl:with-param name="theta" select="-90"/>
  </xsl:call-template>

</svg:svg>

</xsl:template>
Open-Hi-Lo-Close plots are commonly used to plot securities data, but can be used in other applications (for example, to show min, max, mean, and median). The data is passed into this template as four different node sets representing each series. Only the high and low sets are required. The template also handles series with missing data points:
  <xsl:template name="svgu:openHiLoClose">
    <xsl:param name="openData" select="/.."/>
    <xsl:param name="hiData" select="/.."/>
    <xsl:param name="loData" select="/.."/>
    <xsl:param name="closeData" select="/.."/>
    <xsl:param name="width" select=" '500' "/>
    <xsl:param name="height" select=" '500' "/>
    <xsl:param name="offsetX" select="0"/>
    <xsl:param name="offsetY" select="0"/>
    <xsl:param name="openCloseExtent" select="8"/>
    <xsl:param name="max">
     <xsl:call-template name="emath:max">
       <xsl:with-param name="nodes" select="$hiData"/>
     </xsl:call-template>
    </xsl:param>
    <xsl:param name="min">
     <xsl:call-template name="emath:min">
       <xsl:with-param name="nodes" select="$loData"/>
     </xsl:call-template>
    </xsl:param>
    <xsl:param name="context"/>

    <xsl:variable name="hiCount" select="count($hiData)"/>
    <xsl:variable name="loCount" select="count($loData)"/>
    <xsl:variable name="openCount" select="count($openData)"/>
    <xsl:variable name="closeCount" select="count($closeData)"/>

    <xsl:variable name="numBars" select="Math:min($hiCount, $loCount)"/>

    <xsl:variable name="spacing" select="$width div ($numBars + 1)"/>

    <xsl:variable name="range" select="$max - $min"/>
    <xsl:variable name="scale" select="$height div $range"/>

    <svg:g transform="translate({$offsetX},{$offsetY+$height})
                            scale(1,{-$scale})
                            translate(0,{-$min})">

      <xsl:for-each select="$hiData">
        <xsl:variable name="pos" select="position(  )"/>

        <!--draw hi-lo line -->
        <svg:line x1="{$spacing * $pos}"
                y1="{$loData[$pos]}"
                x2="{$spacing * $pos}"
                y2="{current(  )}"id="{$context}_highLow_{$pos}">
           <xsl:attribute name="style">
             <xsl:call-template name="svgu:hiLoBarStyle">
               <xsl:with-param name="pos" select="$pos"/>
               <xsl:with-param name="context" select="$context"/>
             </xsl:call-template>
           </xsl:attribute>
        </svg:line>

        <!--draw open mark if opening data present -->
        <xsl:if test="$openCount >= $pos">
          <svg:line x1="{$spacing * $pos - $openCloseExtent}"
                  y1="{$openData[$pos]}"
                  x2="{$spacing * $pos}"
                  y2="{$openData[$pos]}"
                  id="{$context}_open_{$pos}">
             <xsl:attribute name="style">
               <xsl:call-template name="svgu:openCloseBarStyle">
                 <xsl:with-param name="pos" select="$pos"/>
                 <xsl:with-param name="scale" select="$scale"/>
                 <xsl:with-param name="context" select="$context"/>
               </xsl:call-template>
             </xsl:attribute>
          </svg:line>
        </xsl:if>

        <!--draw close mark if closing data present -->
        <xsl:if test="$closeCount >= $pos">
          <svg:line x1="{$spacing * $pos}"
                  y1="{$closeData[$pos]}"
                  x2="{$spacing * $pos +  $openCloseExtent}"
                  y2="{$closeData[$pos]}"
                  id="{$context}_close_{$pos}">
             <xsl:attribute name="style">
               <xsl:call-template name="svgu:openCloseBarStyle">
                 <xsl:with-param name="pos" select="$pos"/>
                 <xsl:with-param name="scale" select="$scale"/>
                 <xsl:with-param name="context" select="$context"/>
               </xsl:call-template>
             </xsl:attribute>
          </svg:line>
        </xsl:if>

      </xsl:for-each>
    </svg:g>

  </xsl:template>

   <xsl:template name="svgu:hiLoBarStyle">
     <xsl:param name="pos"/>
     <xsl:param name="context"/>
     <xsl:text>stroke: black; stroke-width: 1 </xsl:text>
   </xsl:template>

   <xsl:template name="svgu:openCloseBarStyle">
     <xsl:param name="pos"/>
     <xsl:param name="scale"/>
     <xsl:param name="context"/>
     <xsl:text>stroke: black; stroke-width: </xsl:text><xsl:value-of select="2 div
$scale"/>
   </xsl:template>

</xsl:stylesheet>
You can use this routine to plot stock data, as shown in Figure 9-13:
<xsl:stylesheet version="1.0"
  xmlns:xsl="http://www.w3.org/1999/XSL/Transform"
  xmlns:svg="http://www.w3.org/2000/svg"
  xmlns:svgu="http://www.ora.com/XSLTCookbook/ns/svg-utils"
  exclude-result-prefixes="svgu">

<xsl:include href="svg-utils.xslt"/>

<xsl:output method="xml" version="1.0" encoding="UTF-8" indent="yes"
  doctype-public="-//W3C//DTD SVG 1.0/EN"
  doctype-system="http://www.w3.org/TR/2001/REC-SVG-20010904/DTD/svg10.dtd"/>

<xsl:template match="/">

<svg:svg width="600" height="400">

  <xsl:call-template name="svgu:openHiLoClose">
    <xsl:with-param name="openData" select="*/row/open"/>
    <xsl:with-param name="hiData" select="*/row/high"/>
    <xsl:with-param name="loData" select="*/row/low"/>
    <xsl:with-param name="closeData" select="*/row/close"/>
    <xsl:with-param name="min" select="30"/>
    <xsl:with-param name="max" select="80"/>
    <xsl:with-param name="width" select="600"/>
    <xsl:with-param name="height" select="350"/>
    <xsl:with-param name="offsetX" select="20"/>
    <xsl:with-param name="offsetY" select="20"/>
    <xsl:with-param name="boundingBox" select="1"/>
  </xsl:call-template>

  <xsl:call-template name="svgu:yAxis">
    <xsl:with-param name="min" select="30"/>
    <xsl:with-param name="max" select="80"/>
    <xsl:with-param name="offsetX" select="20"/>
    <xsl:with-param name="offsetY" select="20"/>
    <xsl:with-param name="width" select="600"/>
    <xsl:with-param name="height" select="350"/>
  </xsl:call-template>

</svg:svg>

</xsl:template>

</xsl:stylesheet>
XML-to-SVG transformations are
not usually trivial. Graphical layout of
data requires careful planning, even to get the relatively modest
results obtained by these examples. Approaching every XML-to-SVG
transformation anew would be foolhardy—a toolbox of reusable
utilities is essential. I have concentrated on utilities for
charting, but you can certainly come up with utilities for other
domains. The technique used to design these utilities breaks the
construction of a graphic into component parts and creates templates
that construct those parts in a way that allows mixing and matching.
A key consideration in employing this technique is to make sure that
each template can accept enough information to scale its coordinate
system in a way that is compatible with graphics created by
independent templates. For example, most of these templates contain
$min and $max parameters, even
when reasonable values can be computed from the input data. This
situation lets the caller override the defaults to consider the range
of data appearing in the graph as a whole.
One design decision made in these templates was to allow style information to be obtained via calls to default templates that can be overridden by an importing stylesheet. In many cases, this information could have been supplied by additional parameters. This callback-driven approach was selected because it provides a flexible way to stylize as a function of the plotted data. For example, consider how the pie slice or bars can vary as a function of the data point being plotted at any instant:
  <xsl:template name="svgu:pieSliceStyle">
    <xsl:param name="i"/>
    <xsl:param name="context"/>
    <xsl:variable name="colors" select="document('')/*/svgu:color"/>
    <xsl:value-of select="concat('stroke:black;
                                  stroke-width:0.5;
                                  fill: ',$colors[($i - 1 ) mod
                                           count($colors) + 1])"/>
  </xsl:template>
You might even consider passing additional parameters to such
functions from the main template. One obvious addition would pass the
actual data point so that, for example, the actual data magnitude can
drive the choice of color. One limitation of this technique is that
any given stylesheet can only override a template one time. This
section compensates for the limitation by using a user-specified
context parameter. This parameter allows overridden templates to
alter their behavior based on the context. The context plays double
duty; you can use it as a basis for generating identifiers for an SVG
Element’s id attribute. This is
useful if you want to interact with the generated SVG (see Recipe 9.4).
The final example creates a complex chart that utilizes Open-High-Low-Close bars for stock data, a bar chart for volume, an XY-plot for volume-moving average, and two y-axes for the price and volume scales. The results are shown in Figure 9-14.
<xsl:stylesheet version="1.0"
  xmlns:xsl="http://www.w3.org/1999/XSL/Transform"
  xmlns:svg="http://www.w3.org/2000/svg"
  xmlns:svgu="http://www.ora.com/XSLTCookbook/ns/svg-utils"
  xmlns:emath="http://www.exslt.org/math"
  exclude-result-prefixes="svgu">

  <xsl:include href="svg-utils.xslt"/>

  <xsl:output method="xml" version="1.0" encoding="UTF-8" indent="yes"
    doctype-public="-//W3C//DTD SVG 1.0/EN"
    doctype-system="http://www.w3.org/TR/2001/REC-SVG-20010904/DTD/svg10.dtd"/>

  <xsl:variable name="width" select="600"/>
  <xsl:variable name="height" select="500"/>
  <xsl:variable name="pwidth" select="$width * 0.8"/>
  <xsl:variable name="pheight" select="$height * 0.8"/>
  <xsl:variable name="offsetX" select="($width - $pwidth) div 2"/>
  <xsl:variable name="offsetY" select="10"/>

  <xsl:variable name="dataMin">
    <xsl:call-template name="emath:min">
      <xsl:with-param name="nodes" select="//Low"/>
    </xsl:call-template>
  </xsl:variable>

  <xsl:variable name="dataMax">
    <xsl:call-template name="emath:max">
      <xsl:with-param name="nodes" select="//High"/>
    </xsl:call-template>
  </xsl:variable>

  <xsl:variable name="min" select="$dataMin * 0.9"/>
  <xsl:variable name="max" select="$dataMax * 1.1"/>

  <xsl:template match="/">

  <svg:svg width="{$width}" height="{$height}">

  <svg:text x="{$width div 2}" y="{2 * $offsetY}"
      style="text-anchor:middle; font-size:24">MSFT Stock Chart</svg:text>
  <svg:text x="{$width div 2}" y="{4 * $offsetY}"
      style="text-anchor:middle; font-size:12">05/23/2002 to 08/16/2002</svg:text>
  <!-- PRICE -->

    <xsl:call-template name="svgu:openHiLoClose">
      <xsl:with-param name="openData" select="*/row/Open"/>
      <xsl:with-param name="hiData" select="*/row/High"/>
      <xsl:with-param name="loData" select="*/row/Low"/>
      <xsl:with-param name="closeData" select="*/row/Close"/>
      <xsl:with-param name="min" select="$min"/>
      <xsl:with-param name="max" select="$max"/>
      <xsl:with-param name="width" select="$pwidth"/>
      <xsl:with-param name="height" select="$pheight"/>
      <xsl:with-param name="offsetX" select="$offsetX"/>
      <xsl:with-param name="offsetY" select="$offsetY"/>
      <xsl:with-param name="boundingBox" select="1"/>
    </xsl:call-template>

    <xsl:call-template name="svgu:yAxis">
      <xsl:with-param name="offsetX" select="$offsetX"/>
      <xsl:with-param name="offsetY" select="$offsetY"/>
      <xsl:with-param name="width" select="$pwidth"/>
      <xsl:with-param name="height" select="$pheight"/>
      <xsl:with-param name="min" select="$min"/>
      <xsl:with-param name="max" select="$max"/>
      <xsl:with-param name="context" select=" 'price' "/>
    </xsl:call-template>

  <!-- VOLUME -->
  <xsl:variable name="vheight" select="100"/>

  <xsl:call-template name="svgu:bars">
    <xsl:with-param name="data" select="*/row/Volume"/>
    <xsl:with-param name="width" select="$pwidth"/>
    <xsl:with-param name="height" select="$vheight"/>
    <xsl:with-param name="orientation" select="0"/>
    <xsl:with-param name="offsetX" select="$offsetX"/>
    <xsl:with-param name="offsetY" select="$pheight - $offsetY"/>
    <xsl:with-param name="barLabel" select="false(  )"/>
    <xsl:with-param name="min" select="0"/>
    <xsl:with-param name="max" select="1500000"/>
  </xsl:call-template>

  <!-- This is to make the line plot start on first bar and end on last bar -->
  <xsl:variable name="spacing" select="$pwidth div count(*/row/High) + 1"/>

  <xsl:call-template name="svgu:xyPlot">
    <xsl:with-param name="dataY" select="*/row/Vol10MA"/>
    <xsl:with-param name="width" select="$pwidth - 2 * $spacing"/>
    <xsl:with-param name="height" select="$vheight"/>
    <xsl:with-param name="offsetX" select="$offsetX + $spacing"/>
    <xsl:with-param name="offsetY" select="$pheight - $offsetY"/>
    <xsl:with-param name="minY" select="0"/>
    <xsl:with-param name="maxY" select="1500000"/>
  </xsl:call-template>

    <xsl:call-template name="svgu:yAxis">
      <xsl:with-param name="offsetX" select="$width - $offsetX"/>
      <xsl:with-param name="offsetY" select="$height - $vheight - $offsetY"/>
      <xsl:with-param name="width" select="$pwidth"/>
      <xsl:with-param name="height" select="$vheight"/>
      <xsl:with-param name="min" select="0"/>
      <xsl:with-param name="max" select="1500000"/>
      <xsl:with-param name="context" select=" 'volume' "/>
    </xsl:call-template>

  </svg:svg>

</xsl:template>

 <xsl:template name="svgu:barStyle">
    <xsl:text>stroke: black; stroke-wdth: 0.15</xsl:text>
 </xsl:template>

 <xsl:template name="svgu:xyPlotStyle">
   <xsl:param name="context"/>
   <xsl:param name="scale"/>
   <xsl:value-of select="concat('fill: none; stroke: black; stroke-width:',4 div
       $scale,'; ')"/>
 </xsl:template>

   <xsl:template name="yAxisLabelStyle">
     <xsl:param name="context"/>
     <xsl:choose>
      <xsl:when test="$context = 'price'">
       <xsl:text>text-anchor:end;font-size:8;baseline-shift:-50%</xsl:text>
      </xsl:when>
      <xsl:otherwise>
       <xsl:text>text-anchor:start;font-size:8;baseline-shift:-50%</xsl:text>
      </xsl:otherwise>
    </xsl:choose>
   </xsl:template>

  <!-- Shift the volume labels away from the tick marks -->
   <xsl:template name="yAxisLabelXOffset">
     <xsl:param name="context"/>
     <xsl:if test="$context = 'volume'">
       <xsl:value-of select="6"/>
     </xsl:if>
   </xsl:template>

</xsl:stylesheet>
[19] If you want to annoy an anal-retentive boss, you can generate a bar chart with an orientation of 72 degrees. Better still, plot the data using an orientation of 1 degree and get your colleagues to swear it looks perfectly straight to them!