
Chapter 6: Debugging JavaScript with the Node Debugger
by Camilo Reyes
It’s a trap! You’ve spent a good amount of time making changes, nothing works. Perusing through the code shows no signs of errors. You go over the logic once, twice or thrice, and run it a few times more. Even unit tests can’t save you now, they too are failing. This feels like staring at an empty void without knowing what to do. You feel alone, in the dark, and starting to get pretty angry.
A natural response is to throw code quality out and litter everything that gets in the way. This means sprinkling a few print lines here and there and hope something works. This is shooting in pitch black and you know there isn’t much hope.
Does this sound all too familiar? If you’ve ever written more than a few lines of JavaScript, you may have experienced this darkness. There will come a time when a scary program will leave you in an empty void. At some point, it is not smart to face peril alone with primitive tools and techniques. If you are not careful, you’ll find yourself wasting hours to identify trivial bugs.
The better approach is to equip yourself with good tooling. A good debugger shortens the feedback loop and makes you more effective. The good news is Node has a very good one out of the box. The Node debugger is versatile and works with any chunk of JavaScript.
Below are strategies that have saved me from wasting valuable time in JavaScript.
The Node CLI Debugger
The Node debugger command line is a useful tool. If you are ever in a bind and can’t access a fancy editor, for any reason, this will help. The tooling uses a TCP-based protocol to debug with the debugging client. The command line client accesses the process via a port and gives you a debugging session.
You run the tool with node debug myScript.js, notice the debug flag between the two. Here are a few commands I find you must memorize:
sb('myScript.js', 1)set a breakpoint on first line of your scriptccontinue the paused process until you hit a breakpointreplopen the debugger’s Read-Eval-Print-Loop (REPL) for evaluation
Don't Mind the Entry Point
When you set the initial breakpoint, one tip is that it's not necessary to set it at the entry point. Say myScript.js, for example, requires myOtherScript.js. The tool lets you set a breakpoint in myOtherScript.js although it is not the entry point.
For example:
// myScript.js
var otherScript = require('./myOtherScript');

var aDuck = otherScript();
Say that other script does:
// myOtherScript.js
module.exports = function myOtherScript() {
  var dabbler = {
    name: 'Dabbler',
    attributes: [
      { inSeaWater: false },
      { canDive: false }
    ]
  };

  return dabbler;
};
If myScript.js is the entry point, don’t worry. You can still set a breakpoint like this, for example, sb('myOtherScript.js', 10). The debugger does not care that the other module is not the entry point. Ignore the warning, if you see one, as long as the breakpoint is set right. The Node debugger may complain that the module hasn’t loaded yet.
Time for a Demo of Ducks
Time for a demo! Say you want to debug the following program:
function getAllDucks() {
  var ducks = { types: [
    {
      name: 'Dabbler',
      attributes: [
        { inSeaWater: false },
        { canDive: false }
      ]
    },
    {
      name: 'Eider',
      attributes: [
        { inSeaWater: true },
        { canDive: true }
      ]
    } ] };

  return ducks;
}

getAllDucks();
Using the CLI tooling, this is how you'd do a debugging session:
> node debug debuggingFun.js
> sb(18)
> c
> repl
Using the commands above it is possible to step through this code. Say, for example, you want to inspect the duck list using the REPL. When you put a breakpoint where it returns the list of ducks, you will notice:
> ducks
{ types:
   [ { name: 'Dabbler', attributes: [Object] },
     { name: 'Eider', attributes: [Object] } ] }
The list of attributes for each duck is missing. The reason is the REPL only gives you a shallow view when objects are deeply nested. Keep this in mind as you are spelunking through code. Consider avoiding collections that are too deep. Use variable assignments to break those out into reasonable chunks. For example, assign ducks.types[0] to a separate variable in the code. You’ll thank yourself later when pressed for time.
For example:
var dabbler = {
  name: 'Dabbler',
  attributes: [
    { inSeaWater: false },
    { canDive: false }
  ]
};

// ...

var ducks = { types: [
  dabbler,
  // ...
] };
Client-Side Debugging
That’s right, the same Node tool can debug client-side JavaScript. If you conceptualize this, the Node debugger runs on top of the V8 JavaScript engine. When you feed it plain old vanilla JavaScript, the debugger will just work. There is no crazy magic here, only making effective use of the tool. The Node debugger does one job well, so take advantage of this.
Take a look at the following quick demo:
A List of Ducks
See the Pen A List of Ducks.
If you click on a duck, say an Eider, it will fade out. If you click it once more it will reappear. All part of fancy DOM manipulations, yes? How can you debug this code with the same server-side Node tooling?
Take a peek at the module that makes this happen:
// duckImageView.js
var DuckImageView = function DuckImageView() {
};

DuckImageView.prototype.onClick = function onClick(e) {
  var target = e.currentTarget;

  target.className = target.className === 'fadeOut' ? '' : 'fadeOut';
};

// The browser will ignore this
if (typeof module === 'object') {
  module.exports = DuckImageView;
}
How Is This Debuggable Through Node?
A Node program can use the code above, for example:
var assert = require('assert');
var DuckImageView = require('./duckImageView');

var event = { currentTarget: { } };

var view = new DuckImageView();
view.onClick(event);

var element = event.currentTarget;

assert.equal(element.className, 'fadeOut', 'Add fadeOut class in element');
As long as your JavaScript is not tightly coupled to the DOM, you can debug it anywhere. The Node tooling doesn’t care that it is client-side JavaScript and allows this. Consider writing your modules in this way so they are debuggable. This opens up radical new ways to get yourself out of the empty void.
If you’ve ever spent time staring at an empty void, you know how painful it is to reload JavaScript in a browser. The context switch between code changes and browser reloads is brutal. With every reload, there is the opportunity to waste more time with other concerns. For example, a busted database or caching.
A better approach is to write your JavaScript so it gives you a high level of freedom. This way you can squash big nasty bugs with ease and style. The aim is you keep yourself focused on the task at hand, happy and productive. By decoupling software components, you reduce risk. Sound programming is not only about solving problems but avoiding self-inflicted issues too.
Debugging inside an Editor
Now debugging via the command line is pretty slick, but most developers don’t code in it. At least, personally, I’d prefer to spend most of my time inside a code editor. Wouldn’t it be nice if the same Node tooling could interact with the editor? The idea is to equip yourself with tooling right where you need it and that means the editor.
There are many editors out there and I can’t cover all of them here. The tool that you pick needs to make debugging accessible and easy. If you ever find yourself stuck, it’s valuable to be able to hit a shortcut key and invoke a debugger. Knowing how the computer evaluates your code as you write it is important. As for me, there is one editor that stands out as a good tool for debugging JavaScript.
Visual Studio Code is one tool I recommend for debugging JavaScript. It uses the same debugging protocol the command line tooling uses. It supports a shortcut key (F5 on both Windows and Mac), inspections, everything you expect from a good debugger.
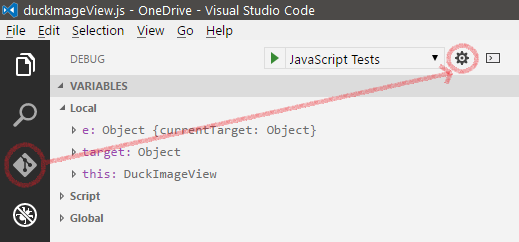
If you already have VS Code installed and haven’t played with the debugger, do yourself a favor. Click on the debugging tab on the left and click the gear button:
A launch.json file will open up. This allows you configure the debugging entry point, for example:
{
  "type": "node",
  "request": "launch",
  "name": "JavaScript Tests",
  "program": "${workspaceRoot}\entryPoint.js",
  // Point this to the same folder as the entry point
  "cwd": "${workspaceRoot}"
}
At a high level, you tell VS Code what to run and where. The tool supports both npm and Node entry points.
Once it is set up, set a breakpoint, hit a shortcut key and done:

The Node debugger enables you to inspect variables and step through the code. The tooling is happy to reveal what happens to the internals when it evaluates changes. All part of the necessary equipment to destroy nasty bugs.
The same principles apply across the board. Even if VS Code, for example, is not your tool of choice. You tell the tooling what to run and where. You set a breakpoint, hit a shortcut key, and get dropped into a debugging session.
Debugging Transpiled JavaScript
The same Node tooling supports transpiled JavaScript through npm packages. Each language has its own set of tools. One gotcha is each language is very different. TypeScript, for example, has different debugging tools from other transpilers. Node debugging with transpilers boils down to your framework choices and tools.
One idea is to pick the tool that integrates with your workflow. Stay close to where you are making changes and shorten the feedback loop. Give yourself the capability to set a breakpoint and hit it in less than a second.
Editors make use of source maps for debugging, so consider enabling this.
Anything short of a quick feedback loop is only asking for punishment. Your tool choices must not get in the way of sound debugging practices.
Conclusion
I can’t discourage enough the use of console.log() for debugging. Often I find myself in panic mode when I choose this route. It feels like shooting in the dark.
If the analogy holds true, shots fired at random can ricochet off walls and hurt you or cause friendly fire. Littering the code base with a ton of logging commands can confuse you or the next person to look at the code. I find debugging lines from a previous commit say nothing about nothing and only obfuscate the code. JavaScript can also throw exceptions if the variable does not exist, which adds to the maelstrom.
Developers at times make themselves believe they can run programs with their eyes. If one gets philosophical, the naked human eye can lie and it’s not a reliable source of truth. Your feeble sense of sight can make you believe whatever it is you want to believe and leave you in the dark.
A good debugger will give you a peek inside what the computer does with your program. This empowers you to write better software that the computer understands. The Node debugger enables you to verify changes and eliminates wishful thinking. It is a tool every good programmer should master.