
Multifunctional Software-Defined Radar Sensors for Detection, Imaging, and Navigation |
|
CONTENTS
6.2 Software-Defined Radar System Architecture
6.2.3 Sensor Signal Processing
6.3.2 Angle-Frequency Reconstructions
6.3.3 Data Communications Experiment Setup
6.4 UWB-OFDM Radar-Assisted Navigation
6.4.2 Navigation Filter Design
Multifunctional radio frequency (RF) sensors are a natural evolution of radar. When first deployed in World War II, the early radar systems were tasked with estimating the range to the potential targets of interest only, and even due to this single functionality it has been claimed that it “is obvious that radar transformed the nature of war more than has any other single invention” [1]. Less than two decades after this triumphant entrance, the radar functionalities were enriched with imaging [2]. This, too, signaled a fundamental change in a number of fields—from the military, which could now perform all-weather, day or night surveillance of obscured targets [3], to the civilian applications of radar, such as monitoring ice sheets or obtaining imagery of space bodies [4]. In parallel, the radar as a navigational tool was also explored, primarily for airborne and seaborne navigation [5]. Once these capabilities were established, the need to distinguish between the targets and objects of different shapes and dimensions quickly emerged and, with it, the automatic target recognition (ATR) field [6]. Thus, the functionalities of imaging and detection began to converge.
As radar technology has further developed, the desire for better, more high-resolution imagery has strengthened, as a better image would produce better ATR and detection results. A fundamental law of radar dictates that range resolution is inversely proportional to the radar signal’s bandwidth [7], which, in turn, led to the development of wideband and ultra-wideband (UWB) radar systems [3,8]. The downside of this technology, however, is the vast amount of information that UWB signals can provide, which initially made their real-time processing a near impossibility, especially on board of airborne vehicles that carried the actual radar platform for, e.g., reconnaissance purposes, thus necessitating off-line image formation and processing in a ground-based facility. Furthermore, the growing list of onboard devices and their functionalities—detection, imaging, communications, location—combined with the desire to utilize them in ever smaller, autonomous systems, such as unmanned aerial vehicles (UAVs) started to present a challenge in terms of increased weight, size, power consumption, and interoperability. A potential solution to these problems can consist of two parts:
• Better (more computationally efficient) data processing algorithms run on ever faster computing platforms [9]
• Employing multifunctional, software-defined sensor architectures, which enable multiple tasks to be carried out via a single analog front end (AFE) and processed locally in real time
The focus of this chapter is on the latter approach.
The interest in multifunctional systems can be traced back to a 1978 paper on the Ku-band NASA Space Shuttle Orbiter subsystem, which combined the radar and communication functionalities [10]. The subsystem described in the paper could perform as a wideband data communication device, with a data rate up to 216 kb/s, or as frequency-hopping pulse-Doppler radar, providing range accuracy of 80 ft and velocity accuracy of 1 ft/s. The authors indicated that the radar and communication functions shared a wideband, multifunction transmitter, a two-channel receiver, and an antenna, while each function had its own signal processing mechanisms. This description provides a natural connection of the dual-use concept and a concept of software-defined radar sensor (SDRS) suggested in 2001 by Wiesbeck [11]. In SDRS and in software-defined synthetic aperture radar (SD-SAR) systems, the concept of fully software-configurable transmitters and modular digital receiver data processors with downloadable software for a variety of scenarios is envisioned. Conceptual design of a multifunctional RF system test bed developed for the Advanced Multifunction Radio Frequency Concept (AMRFC) Program is summarized in Tavik et al. [12].
In recent years there have been explorations of radar and communications functionalities’ fusion via several different approaches; for example, in Saddik, Singh, and Brown [13], a system based on implementing UWB linear frequency modulated (LFM) signals of opposite chirp slopes to achieve orthogonality between the radar and communications channels is described. In Sturm and Wiesbeck [14], a conceptual approach to fusing ranging and communications for vehicular applications is presented. Furthermore, software-defined sensor systems have been recently researched and reported as well. For example, a UWB stepped-frequency radar sensor for subsurface probing is presented in Park and Nguyen [15] and a high-resolution multiband UWB short-pulse radar sensor is described in Han and Nguyen [16]. A software-defined radar system for high-precision range measurements was also recently described in Zhang, Li, and Wu [17].
In our work we merged the radar/communications functionality with the SDRS concept and UWB performance. Our system was designed as a UWB orthogonal frequency-division multiplexing (OFDM) architecture, which has been shown to possess high spectral efficiency, excellent spectral flexibility with the potential to coexist with narrowband systems and/or effectively combat narrowband interference, and good performance in multipath scenarios [18]. UWB-OFDM in communications has been researched and quickly accepted by the industry as a system architecture and coding method of choice for low power, broadband data communications [19]. In radar, UWB-OFDM signaling and system architecture has not been explored as much; OFDM coding structure was first used to create a multifrequency complementary phase-coded radar signal concept by Levanon [20,21]. OFDM was proposed to be used for interferometer implementation [22]. Then, in recent years the interest in OFDM in radar has intensified and resulted in several works on various aspects of it [23–24,25,26,27]. In our work, we suggested using UWB-OFDM SDRS for ranging, communications [28], adaptive imaging [29], detection [30], and navigation [31]. In the following sections we will summarize the current state of the art in multifunctional UWB-OFDM SDRS.
6.2 SOFTWARE-DEFINED RADAR SYSTEM ARCHITECTURE
OFDM lends itself very well to implementation in software—from spectrum allocation and signal construction to frequency-domain signal processing upon reception. A conceptual diagram showing the frequency composition of an OFDM pulse transmitted at a carrier frequency f0 is shown in Figure 6.1. From it, it is easy to see that any OFDM signal is essentially a linear combination of RF pulses, each at the carrier frequency that is a multiple of
(6.1) |
where Fs is the sampling frequency of the digital-to-analog converter (DAC)—a principal component of an SDRS—and N is the desired total number of such RF pulses, or sub-bands in frequency domain, which is arbitrary and can even be changed in an OFDM SDRS on a pulse-to-pulse basis.
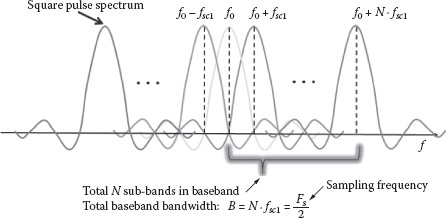
FIGURE 6.1 Conceptual representation of an OFDM pulse in frequency domain.
It can be seen that the OFDM pulse can be designed using both the sub-band weighting (in which each RF pulse obtains an individual amplitude and phase characteristics) and sub-band turning on or off (in which some RF pulses are simply eliminated from the sum). Once the signal is created in frequency domain, it can be translated to time domain via a simple inverse fast Fourier transform (IFFT) operation, which also lends itself well to efficient software implementation. These operations are performed on signal samples—that is, frequency-domain wave forming amounts to creating a complex vector of amplitude and phase coefficients of OFDM signal values at the sub-carrier locations (multiples of fsc1).
The transceiver in our system consists of the two principal parts: the software-defined part and the hardware-implemented AFE. Naturally, the former will contain as much functionality as possible, as dictated by the SDRS concept. The conceptual representation of the software-enabled functions is shown in Figure 6.2. It is easy to see that, with such architecture, the following parameters of the transmit signal can be changed on a pulse-to-pulse basis: duration, spectral composition, bandwidth, envelope shape, and phase characteristic of individual frequency components.
After passing through the software-defined part of the SDRS, the signal is passed to the DAC in the form of discrete samples. The output from the DAC is sent to the AFE portion of the system, where it is up-converted to a 7.5 GHz carrier frequency and is transmitted as a 1 GHz bandwidth pulse using the horn antenna. Upon signal reception with a second horn antenna, the signal is amplified using ultralow noise amplifiers (ULNA) and is down-converted to baseband before being sent to the high-speed digitizer in the software-controlled part of the system. The block diagram of the AFE is illustrated in Figure 6.3.
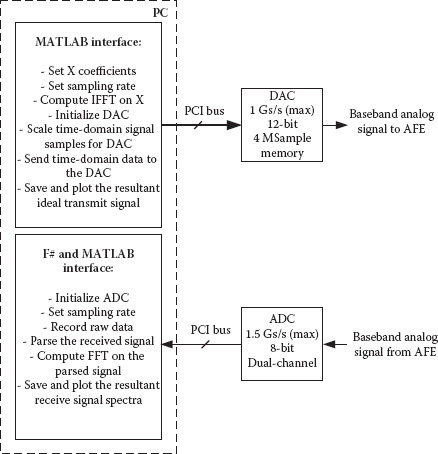
FIGURE 6.2 Conceptual representation of the software-defined part of the SDRS.
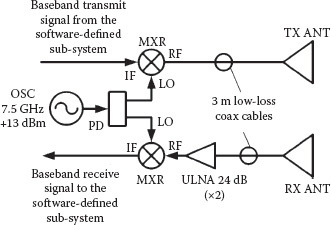
FIGURE 6.3 Conceptual representation of the AFE.
6.2.3 SENSOR SIGNAL PROCESSING
Upon transmission, the receiver part of the AFE starts to receive the signals, which may consist of reflections from targets and noise, or contain noise only. Once the signal is received, it is sampled and passed through the FFT to arrive at the frequency-domain representation. We aim to reconstruct the target response (consisting of M targets), which is a part of the response vector:
(6.2) |
where αk is frequency response of the qth target; w is cumulative disturbance vector consisting of clutter, noise, and system nonlinearity; and ψk is the vector:
(6.3) |
where Δtq is the round-trip time delay associated with the received signal reflected by the qth target and the exponential values are shown for the samples associated with the sub-carrier locations only. The rest of the values can be interpolated without loss of generality.
For range compression, the conventional technique in radar is to perform matched filtering of the received signal with the transmit signal replica stored locally. This is often done in frequency domain to take advantage of the fast and efficient FFT algorithm implementation. Since OFDM signals are converted into the frequency domain upon reception by default, this makes it a natural choice for our system as well. The received signal will contain K samples associated with K individual ranges, as determined by the system’s sampling rate and the maximum range. Then, the original transmit signal is up-sampled (zero-padded) by a factor of K/(2N + 1) to ensure dimension match. The resultant range profile can then be computed as
(6.4) |
where ℱ −1 denotes inverse Fourier transform, H denotes Hermitian operator, and XK denotes the original frequency-domain vector of the transmit OFDM signal’s coefficients, which had been up-sampled to the length K via time-domain zero-padding. In the next section we will present some of the experimental results of this signal processing approach.
The experimental tests took place in an indoor laboratory setting with a multipath environment. Three types of experimental results are presented: (1) single-target SAR imaging, (2) angle-frequency profile reconstruction, and (3) communication performance in radar setup.
We created a distributed aperture by moving the antenna platform along a straight path and taking radar measurements of the reflections from a single target at a number of positions, as shown in Figure 6.4, thus performing SAR imaging test.
The signals used in this experiment were constructed from N = 129 sub-bands, with the sub-bands weighted with vectors of random real coefficients Xm, where m = 1 … 11 is the index of radar cross-range position. Range compression was achieved, as in the case of ranging tests, via matched filtering of the received and reference waveforms. Azimuth compression was achieved via matched filtering of the radar signal’s phase history with a reference phase history, as described, for example, in Soumekh [32]; however, instead of Doppler centroid estimation (which is required in a general case for phase history reconstruction of a wideband signal), we implemented a novel method of single subcarrier phase recovery, suitable for OFDM:
(6.5) |
where is the phase estimate of kth OFDM subcarrier at the mth radar position. In our experiment we have arbitrarily selected the 10th sub-band (centered on f10 = 38.7597 MHz) for phase reconstruction.
Then, the cross-range profile for a kth sub-band and range bin value is found conventionally via the matched filtering of the received signal’s phase history and the reference phase history [32]. Finally, the SAR image is formed via multiplication of the range profile data and the cross-range profile data. A simulated ideal SAR image for the geometry described in Figure 6.4 was generated; no noise and clutter were added and the target was modeled as a point reflector. As in experiment, the 10th sub-band of the OFDM signals was used for phase history reconstruction and its coefficient was set to a constant value for all modeled pulses, whereas the rest of the sub-bands’ coefficients were generated randomly for each pulse. A representative resultant image is shown in Figure 6.5. The experimental SAR image generated using actual test data is shown in Figure 6.6. It is seen that the images are fairly similar, thus confirming the functionality of the system and the processing method.
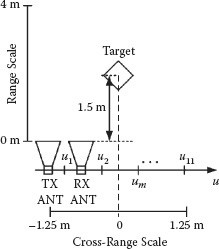
FIGURE 6.4 Short-range SAR experiment setup.
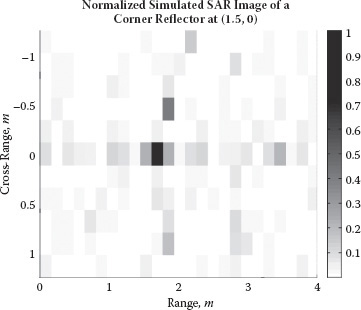
FIGURE 6.5 Normalized simulated SAR image of a 1 ft corner reflector at (1.5, 0) meter coordinates.
It is also seen that the true position of the target is reconstructed fairly well, with less than 10 cm of error in both range and cross range. An interesting possibility that arises from the use of a multifrequency waveform such as OFDM is cross-range profile reconstruction using several various sub-carriers.
6.3.2 ANGLE-FREQUENCY RECONSTRUCTIONS
We further explored the benefits of the multifrequency signal transmission and reception afforded by the UWB-OFDM system architecture by reconstructing target scenes in angle and frequency domains. Matched-filtered returns were collected from a single corner reflector (described in the preceding subsection), as well as from a piece of drywall for each of the 16 subcarriers that together composed a 500 MHz baseband spectrum of the OFDM signal. The experimental setup is illustrated in Figure 6.7.
After the data were averaged over 100 trials, the angle-frequency graphs were plotted; two examples are shown in Figure 6.8. It can be seen that the signatures for two different targets can, indeed, be discerned, making it potentially possible to perform automatic target detection and identification based on the observed angle-frequency profiles.
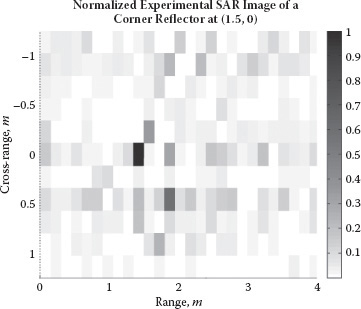
FIGURE 6.6 Normalized experimental SAR image of a 1 ft corner reflector at (1.5, 0) meter coordinates.
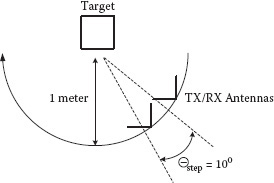
FIGURE 6.7 Data collection setup for angle-frequency target reconstructions.
6.3.3 DATA COMMUNICATIONS EXPERIMENT SETUP
In this experiment we performed wireless data transfer from the transmitter to the receiver without any hardware adjustments in either of them, and also without changing the basic radar geometry: transmit and receive antennas both faced a single corner reflector. Randomly generated binary messages were coded onto the OFDM pulses using a simple on/off keying (OOK) modulation technique. For this experiment the number of sub-bands was chosen to be N = 64 and the total pulse length was 128 ns. Through initial tests it was found that transmission quality of several sub-bands was significantly degraded by systemic in-band noise caused by the DC offset and switching noise in the DAC/ADC; specifically, sub-bands in the range from DC to approximately 100 MHz and also from 470 to 500 MHz were found unusable. After usable sub-band allocation, the total number of bits per each OFDM pulse was set to 19. Additionally, the guard interval between any two OFDM message pulses was set to be four times the length of the typical delay spread of UWB signals in an indoor environment [33], or Lguard = 200 ns.
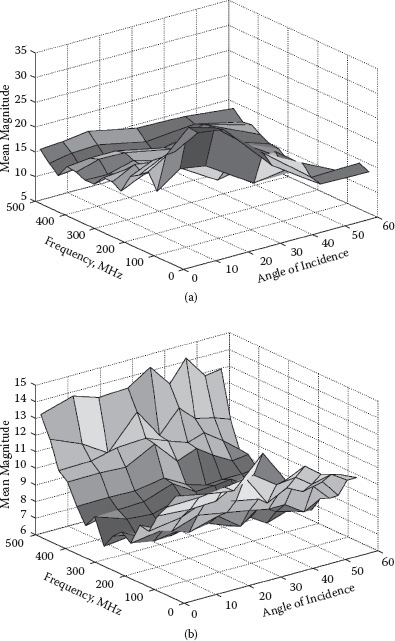
FIGURE 6.8 Angle-frequency profiles of (a) corner reflector; (b) drywall segment at 1 m range.
The resultant data rate achievable under this scenario is 57 Mb/s. Communication tests were run for the antenna to target distances varying from 1 to 5 m. Signals reflected from the corner reflector were collected by the receive antenna and compared to the original message after detection. The results of the simulations, using the work of Santhananthan and Tellambura [34] and Dharmawansa, Rajatheva, and Minn [35] for various numbers of OFDM subcarriers, along with the overlaid experimental bit error rate (BER) curve, are shown in Figure 6.9. Here, the deterioration factor was the intercarrier interference (ICI), expressed in terms of frequency offset resultant from the loss of subcarrier orthogonality ε.
It can be seen that the frequency offset-induced ICI is, indeed, a strong factor in BER degradation. At ε ≈ 0.25, the dependence of BER on the number of subcarriers is quite evident as well: The more subcarriers are used, the less BER depends on the range and the faster it converges to a vicinity of 1% to 2%. This characteristic is not observed for the cases with ε ≈ 0.5, however. It can also be seen from the plot that within the tested ranges, experimental BER stays below approximately 3% and does not exhibit strong dependence on distance, leading us to believe that the frequency offset in our system is probably close to 0.25, or approximately 2 MHz.
Thus, compared to the results reported in Saddik et al. [13], we have demonstrated true wireless communication performance of a dual-use system in an indoor laboratory environment—as opposed to a direct transmitter–receiver connection via an attenuator—while achieving the functionality in which the same signals could be used for high-resolution radar and communication purposes in the presence of multiple system platforms. This capability makes the proposed system very viable for implementation in radar sensor networks.
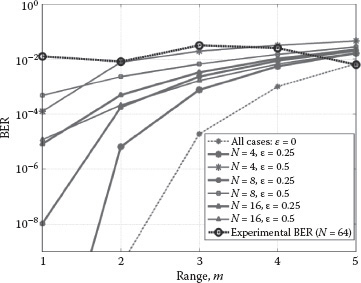
FIGURE 6.9 Simulated and experimental BER performance.
6.4 UWB-OFDM RADAR-ASSISTED NAVIGATION
The UWB-OFDM radar system was simulated to measure its performance as an integrated sensor in a navigation system. In the simulation, the radar is modeled using the parameters of the experimental system, and is mounted as a side-looking radar on board an aerial vehicle (AV). As the AV flies with continuously changing velocity, the radar collects backscatter from reflective surfaces on the ground. The collected backscatter (analogous to the phase history in SAR imaging) is then used to gain information about the relative position of the (assumed) stationary reflectors on the ground and the AV. This relative motion information can be used in a navigation filter to provide additional information about the velocity and position of the AV.
The raw data are the baseband samples collected at the receiver. For navigation, it is necessary to use a two-channel in-phase and quadrature-phase (I/Q) demodulator, yielding samples from two channels at the baseband. The detection of persistent, strong, stationary reflectors on the ground is performed via thresholding the normalized MF output between the received signal and the OFDM reference pulse. Let xk(n) = xI,k(n) + xQ,k(n) be the two-channel raw data collected at a particular time instant k. Then the MF output is
(6.6) |
where x are time-domain samples of an OFDM signal and * is the complex conjugate. Assuming that a single reflector is present, the detection statistic is the peak output of mk(n) over all n normalized by the noise level is
(6.7) |
where P is the average power of the samples. The detection is then performed on mmax,k at every time k, using a threshold for detection that sets the probability of false alarm as desired. Figure 6.10 shows a histogram of the values calculated for mmax,k with no target and a single target present. In general, multiple reflectors may be present. Multiple reflectors are detected by repeatedly selecting the next highest peak output of the MF and performing threshold detection as described earlier.
Simple detection as described before produces a set of detection locations at every time instant. A tracking algorithm must be used to associate detections at one time instance with those at the next, which is vital for navigation as we are interested in the position of the reflectors relative to ours over time. This problem was solved by using a global nearest neighbor (GNN) tracking algorithm combined with an M/N detector to validate detected reflector tracks as persistent. In order to be used in the navigation filter, a tracked reflector must have had an observation (MF output peak above detection threshold) associated with it by the GNN association algorithm at M of the last N data collections. When this condition is met, the track is inserted into the navigation filter as used to correct position updates, as discussed in the next section.
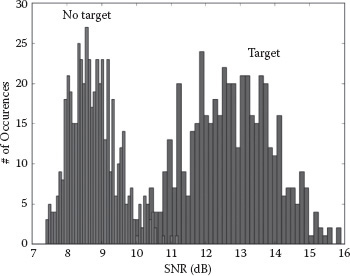
FIGURE 6.10 Histogram of calculated MF SNRs with true MF SNR of 18 dB.
6.4.2 NAVIGATION FILTER DESIGN
The navigation filter combines information from an inertial navigation system (INS) and the tracked reflectors from the previous section to generate an optimal estimate of the position of the AV. Figure 6.11 illustrates the integration process. This design is called an error-state model, as the quantity being estimated by an extended Kalman filter (EKF) is actually the error in the INS position estimate. To generate the best position estimate known to the filter, the calculated INS error is subtracted from the INS position estimate. The performance of the filter is measured by the error between this estimate and the true location of the AV.
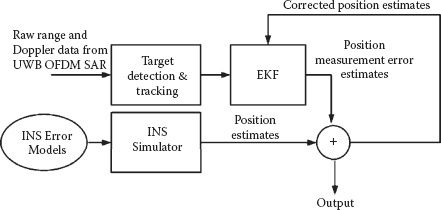
FIGURE 6.11 Block diagram of INS and radar integration.
Table 6.1 Position Error in Latitude (Initial AV Direction of Travel) after 10 Minutes of Flight
Aiding |
No aiding |
|
Commercial grade |
4.0 m |
1700 km |
Tactical grade |
1.2 m |
600 km |
Navigation grade |
0.5 m |
15 m |
Table 6.2 Position Error in Longitude after 10 Minutes of Flight
Aiding |
No aiding |
|
Commercial grade |
15 m |
1700 km |
Tactical grade |
10 m |
600 km |
Navigation grade |
4 m |
15 m |
The navigation filter performance was simulated for two cases: INS-only position estimates and INS + radar aiding position estimates. Tables 6.1 and 6.2 show the resulting error between truth and estimate for varying grades of INS. We see that aiding greatly decreases the error in position, with a larger correction the worse the grade of the inertial becomes. Commercial grade INS would not ordinarily be appropriate for flight navigation; however, with an onboard UWB-OFDM radar aiding system, the commercial grade INS was simulated to perform better than a stand-alone navigation grade INS.
Modern technology allows for inexpensive and efficient implementation of software-defined systems with excellent potential for multiple functionalities. In this work we describe the UWB system, which was designed, constructed, and tested to achieve the goals of radar and communications without any hardware adjustments. The system described here was also intended as a test vehicle of UWB-OFDM implementation for radar imaging, angle-frequency target profile reconstruction, and radar-assisted navigation. The design is simple, fully software configurable, and cost effective.
Experimental results have confirmed the range resolution of approximately 30 cm and have shown the applicability of the system to SAR imaging. The latter was achieved via a relatively simple and computationally efficient method of range-Doppler reconstruction, where range profiles were obtained via matched filtering of the returns (range compression) and cross-range profiles were obtained via matched filtering of the phase history. The obtained image of a trihedral corner reflector shows good target localization with less than 10 cm error in range and cross range. We further investigated the topic by creating angle-frequency graphs for a variety of target scenes. Angle of incidence was varied in steps of 10° and, owing to the simplicity of extracting individual frequency components from an OFDM signal, frequencies in the baseband bandwidth of 500 MHz were used to form two-dimensional angle-frequency graphs. Communication capability using the same hardware configuration was also tested; with an OOK scheme, the data rate of approximately 57 Mb/s was experimentally confirmed in the laboratory setup in which communication signals reflected from a large-RCS target were detected and analyzed. The experimental BER was measured and contrasted with computationally feasible results obtained for OFDM OOK signals with fewer sub-carriers; the comparison suggested prevalence of frequency offset-induced ICI over the noise effects at the given ranges; the BER was found to vary between approximately 0.625% and 3.125%. Furthermore, the potential of the system to be used for navigation via referencing the position of the radar platform to the detected targets (and ranges to them) in real time is shown to be achievable.
The possibilities for future work using the designed system as a test vehicle include advanced indoor ranging and imaging at greater distances and involving multiple platforms. The ultimate goal is the creation of a unified framework for target scene reconstruction, data communications with friendly platforms, and platform self-positioning in real time, using the single software-defined UWB radar sensor system.
The authors wish to thank graduate assistants Brian Jameson and Scott Spalding for help in radar testing. We are also grateful to Dr. Jon Sjogren of AFOSR for program management and reviews during the radar system design and validation.
1. L. Brown, A radar history of World War II: Technical and military imperatives. London, UK: Institute of Physics Publishing, 1999.
2. W. L. Cowperthwait, Reconnaissance with a side-looking, modified, APQ-7 radar. Proceedings of 1956 Symposium for Advanced Technology in Radar Components and Systems for Battlefield Surveillance, Univ. of Michigan, Ann Arbor, MI, pp. 631–660, 1956.
3. M. Soumekh, Reconnaissance with ultra wideband UHF synthetic aperture radar. IEEE Signal Processing Magazine, vol. 12, no. 4, pp. 21–40, July 1995.
4. W. T. K. Johnson, Magellan imaging radar mission to Venus. Proceedings of IEEE, vol. 79, no. 6, pp. 777–790, June 1991.
5. R. A. Smith, Radar navigation. Journal of Institute of Electrical Engineers, vol. 93, no. 1, pp. 331–342, 1946.
6. P. Tait, Introduction to automatic target recognition. London, UK: Institution of Engineering and Technology, 2006.
7. M. Skolnik, Introduction to radar systems. New York: McGraw–Hill, 2002.
8. D. R. Wehner, High resolution radar. Norwood, MA: Artech House, 1987.
9. A. Fasih and T. Hartley, GPU-accelerated synthetic aperture radar back projection in CUDA. Proceedings of 2010 IEEE Radar Conference, Arlington, VA, pp. 1408–1413, 2010.
10. R. H. Cager, Jr., D. T. LaFlame, and L. C. Parode, Orbiter Ku-band integrated radar and communications subsystem. IEEE Transactions Communications, vol. COM-26, pp. 1604–1619, Nov. 1978.
11. W. Wiesbeck, SDRS: Software-defined radar sensors. Proceedings of 2001 IEEE International Geoscience and Remote Sensing Symposium (IGARSS’01), Sydney, Australia, pp. 3259–3261, 2001.
12. G. C. Tavik, C. L. Hilterbrick, J. B. Evins, J. J. Alter, J. G. Crnkovich, Jr., J. W. de Graaf, W. Habicht II, et al., The advanced multifunction RF concept. IEEE Transactions Microwave Theory Technology, vol. 53, pp. 1009–1020, March 2005.
13. G. N. Saddik, R. S. Singh, and E. R. Brown, Ultra-wideband multifunctional communications/radar system. IEEE Transactions Microwave Theory Technology, vol. 55, pp. 1431–1437, July 2007.
14. C. Sturm and W. Wiesbeck, Waveform design and signal processing aspects for fusion of wireless communications and radar sensing. Proceedings of IEEE, vol. 99, no. 7, pp. 1236–1259, July 2011.
15. J. Park and C. Nguyen, An ultra-wideband microwave radar sensor for non-destructive evaluation of pavement subsurface. IEEE Sensors Journal, vol. 5, no. 5, pp. 942–949, Oct. 2005.
16. J. Han and C. Nguyen, Development of a tunable multiband UWB radar sensor and its applications to subsurface sensing. IEEE Sensors Journal, vol. 7, no. 1, pp. 51–58, Jan. 2007.
17. H. Zhang, L. Li, and K. Wu, Software-defined six-port radar technique for precision range measurements. IEEE Sensors Journal, vol. 8, no. 10, pp. 1745–1751, Oct. 2008.
18. A. Batra, J. Balakrishnan, G. R. Aiello, J. R. Foerster, and A. Dabak, Design of a multiband OFDM system for realistic UWB channel environments. IEEE Transactions Microwave Theory Technology, vol. 52, pp. 2123–2138, Sept. 2004.
19. H. Yin and S. Alamouti, OFDMA: A broadband wireless access technology. Proceedings of 2006 IEEE Sarnoff Symposium, Princeton, NJ, pp. 1–4, 2006.
20. N. Levanon, Multifrequency complementary phase-coded radar signal. IEE Proceedings of Radar, Sonar Navigation, vol. 147, pp. 276–284, Dec. 2000.
21. E. Mozeson and N. Levanon, Multicarrier radar signals with low peak-to-mean envelope power ratio. IEE Proceedings of Radar, Sonar Navigation, vol. 150, pp. 71–77, April 2003.
22. P. A. Antonik, H. Griffiths, D. D. Weiner, and M. C. Wicks, Novel diverse waveforms. Air Force Research Laboratory, Rome, NY, AFRL-SN-RS-TR-2001-52 in-house report, June 2001.
23. G. E. A. Franken, H. Nikookar, and P. van Genderen, Doppler tolerance of OFDM-coded radar signals. Proceedings of 2006 European Radar Conference, Manchester, UK, pp. 108–111, 2006.
24. M. Ruggiano and P. van Genderen, Wideband ambiguity function and optimized coded radar signals. Proceedings of 2007 European Radar Conference, Munich, Germany, pp. 142–145, 2007.
25. S. C. Thompson and J. P. Stralka, Constant-envelope OFDM for power-efficient radar and data communications. Proceedings of 2009 International Waveform Diversity and Design Conference, Kissimmee, FL, pp. 291–295, 2009.
26. S. Sen, M. Hurtado, and A. Nehorai, Adaptive OFDM radar for detecting a moving target in urban scenarios. Proceedings of 2009 International Waveform Diversity and Design Conference, Kissimmee, FL, pp. 264–268, 2009.
27. B. J. Donnet and I. D. Longstaff, Combining MIMO radar with OFDM communications. Proceedings of 2006 European Radar Conference, Manchester, UK, pp. 37–40, 2006.
28. D. Garmatyuk, J. Schuerger, and K. Kauffman, Multifunctional software-defined radar sensor and data communication system. IEEE Sensors Journal, vol. 11, no. 1, pp. 99–106, Jan. 2011.
29. D. Garmatyuk and M. Brenneman, Adaptive multicarrier OFDM SAR signal processing. IEEE Transactions Geoscience and Remote Sensing, vol. 49, no. 10, pp. 3780–3790, Oct. 2011.
30. B. Jameson, A. Curtis, D. Garmatyuk, Y. T. Jade Morton, P. Plummer, and K. Thompson, Detection of behind-the-wall targets with adaptive UWB OFDM radar: Experimental approach. Proceedings of 2011 IEEE Radar Conference, Kansas City, MO, May 2011.
31. K. Kauffman, D. Garmatyuk, and J. Morton, Efficient sparse target tracking algorithm for navigation with UWB-OFDM sensors. Proceedings of 2009 IEEE National Aerospace & Electronics Conference (NAECON), Dayton, OH, pp. 14–17, July 2009.
32. M. Soumekh, Synthetic aperture radar signal processing with MATLAB algorithms. New York: John Wiley & Sons, chapters 2 and 6, 1999.
33. T. Jamsa, V. Hovinen, A. Karjalainen, and J. Iinatti, Frequency dependency of delay spread and path loss in indoor ultra-wideband channels. Proceedings of 2006 IET Seminar on Ultra Wideband Systems, Technology and Applications, London, UK, pp. 254–258, 2006.
34. K. Santhananthan and C. Tellambura, Probability of error calculation of OFDM systems with frequency offset. IEEE Transactions Communications, vol. 49, no. 11, pp. 1884–1888, Nov. 2001.
35. P. Dharmawansa, N. Rajatheva, and H. Minn, An exact error probability analysis of OFDM systems with frequency offset. IEEE Transactions Communications, vol. 57, no. 1, pp. 26–31, Jan. 2009.