
CONTENTS
53.3.2 Relationship between Ag Coverage and SERS Intensity
53.3.3 GaN Contribution to the SERS Effect
53.4.1 SERS as a Biosensing Tool
53.4.2 SERS for Environmental Detection
53.4.3 SERS as an Analytical Tool
Surface-enhancement Raman spectroscopy (SERS) is a technique to observe analytes such as molecules, polymers, or biological materials at low concentration per surface area by high amplification of the Raman signal [1, 2 and 3]. Every molecule has its unique Raman spectrum, which makes SERS a powerful tool for detection [4]. SERS effect was discovered by Fleischmann et al. [5]. He reported the first high-quality Raman spectra of pyridine adsorbed on an electrochemically roughened surface of a silver electrode. However, understanding the new phenomena came rather through other researchers. High-enhancement SERS substrate was discovered independently by Craighton et al. [6] and Van Duyne et al. [7] in 1977. In 1980, theoretical explanations of the SERS effect were given by Gersten and Nitzan [8].
Most of the SERS enhancement occurs due to the electromagnetic contribution which causes the Raman signals to be enhanced by a factor of 106−108. An electromagnetic effect occurs when the absorption of light creates an enhanced local electric field at the location of the adsorbed species due to the surface plasmon resonance. The local electric field decays within 10 nm of the metallic source [8]. Therefore, the analyte should be close to the metal enhancer but not necessarily in contact with it. The electromagnetic effect gives an enhancement of the 4th power of the surrounding electric field that was created by plasmon resonance [9]. Another source of the SERS effect arises from the chemical contribution [10,11], which further increases the SERS signal. A chemical effect may occur due to resonance Raman if the target analyte absorbs the laser wavelength significantly [4]. An additional source for the chemical effect occurs from a metal to a molecule charge transfer [12]. In contrast to the electromagnetic effect, the chemical effect causes at most 102 enhancements [13]. Moreover, the analyte must be adsorbed on the SERS enhancer.
Every molecule has its unique Raman spectrum, which makes SERS a powerful tool for detection. The SERS technique was used to detect a variety of analytes from pollutants and explosives to biological matter such as cancer cells and viruses. SERS as an analytical tool is extensively reviewed in the application chapter.
Because porous GaN was used as a SERS template with a deposited Ag or Au film [14], we assumed that GaN nanowires (GaN NWs) can also be used as a template for SERS. They have already been used for many nanoscale applications [15] due to the wide bandgap of GaN (3.4 eV at room temperature) [16], low refractive index [17], and chemical and thermal stability [18].
This chapter shows high SERS amplification of a composite nanostructure made of Ag NPs as SERS enhancers adsorbed on GaN NWs. GaN NWs were synthesized by vapor–liquid–solid chemical vapor deposition (CVD) on a Pt nanofilm-coated Si substrate. Ag NPs were adsorbed on the GaN NWs by electron beam physical vapor deposition. Rhodamine-6G (R6G) was applied to the surface at different concentrations (10−3–10−12 M) to measure the detection limit and to derive the enhancement factor. Relationships between the percentage of Ag coverage and SERS intensity are also discussed.
Ga was reacted with ammonia in a CVD furnace to produce GaN NWs on an Si substrate. A detailed description of the CVD synthesis was reported elsewhere [19]. Briefly, GaN NWs were grown by reacting metallic Ga with NH3 at 950°C, 0.347 bar, and 0.5 L/min flow rate for 30 min in a horizontal quartz-tube furnace with a diameter of 80 mm and length of 120 cm; a platinumcoated 10-nm-thick Si(111) substrate was placed 2 cm downstream from the Ga source. GaN NWs were checked by x-ray diffraction (Rigaku, D-Max-IV scanned from 30° to 70°, scanning rate 2°/min) and a scanning electron microscope (SEM) (Zeiss, EVO50). Ag was deposited by an E-beam machine (ULVAC VT1-10CE) at a deposition rate of 3 Å/s. Two series of experiments were conducted at a different calibration of the E-beam machine. After silver deposition, samples were examined again by SEM and XRD. Energy-dispersive x-ray spectroscopy (EDS) (EDΛX, TSC) was used to show Ag coverage on the GaN NWs. Transmission electron microscope (TEM) (JEOL, JEM-2100F) measurements were conducted to show the morphology of the Ag-deposited particles and to calculate the percentage of Ag coverage. A volume of 5 µL of Rhodamine-6G (R6G) (Sigma Aldrich) in ethanol solution was dropped on the GaN NWscoated surface. Then the drop was evaporated in an oven at 80 °C. Raman (Jobin Yvon, Labram HR) laser measurements at 532 and 633 nm were carried out after calibration with a silicon scattering peak at 520 cm−1; laser spot diameter was around 1 µm. Five SERS measurements in different spots of the ensemble were carried out for 1 s each to ensure reproducibility of the results. An SERS signal was given as the average signal of these five measurements. Graphs are obtained after reduction of cosmic rays, polynomial fittings, and then finally by smoothing. R6G were checked at concentrations of 10−3, 10−6, 10−9, and 10−12 M, all of which were prepared from a stock solution of 50 mL 10−2 M R6G. GaN NWs with 1 M R6G were also checked to calculate the enhancement factor.
Size and morphology of the Ag NPs are the main factors which determine the intensity of the SERS signal [20]. Therefore, we analyzed the samples by TEM, XRD, and EDX. A clear XRD pattern of cubic Ag (38, 44, 64, 77, 81°, and wurtzite hexagonal GaN NWs (32°, 34°, 36°, 48°, 57°, 63°, 69°, and 70°) was observed. Also the broad XRD peaks mentioned earlier indicate a nanoscale structure. Successful Ag deposition was also supported by the EDX spectra. EDX results show 13% ± 2.5 at% of Ag, 42 ± 1.3 at% of Ga, and 44 ± 2.1 at% of N were also detected, indicating the presence of GaN NWs. Figure 53.1 compares TEM images of E-beam physical vapor deposition Ag NPs on GaN NWs at different deposition times. Figure 53.1a shows isolated oval and spherical NPs (major axis 2–25 nm) deposited on the NWs. Figure 53.1b shows both isolated NPs (major axis 15–45 nm long) and smaller aggregates (40–300 nm long). In Figures 53.1c and d, there is a different pattern from Figure 53.1a; more NPs cover the GaN NWs and some of them were aggregated to form nanorodlike bodies longer than 100 nm. Ag NPs size distribution was similar to other studies as shown in Table 53.1.
We used R6G, investigated by Hildebrandt et al. [21] as an enhancement reagent, as an SERS probe analyte. R6G is an established SERS probe molecule with a known peak assignment [22]. The key peaks of the R6G spectrum are 1124, 1189, 1310, 1360, 1508, 1577, and 1649 cm−1. To compare the SERS effect for R6G at 532 and 633 nm, Raman laser measurement with R6G for both laser wavelengths was carried out. We showed that using a 532 nm laser gives a 2–4 times higher SERS effect, depending on the peak. This effect is probably due to the resonance of the R6G absorption at 532 nm [21]. Therefore, we chose to continue the study with the 532 nm Raman laser. In this study, the highest SERS intensity was achieved by growing Ag NPs by E-beam for only 3 s. When we deposited Ag NPs by E-beam for longer deposition times than 3 s, detection limit was 10−9 M for 30 and 60 s or even 10−6 M R6G for 180 and 600 s deposition time. Figure 53.2a–c shows the results from 3-s E-beam deposition time; all R6G peaks are observed at high intensity. Measuring the R6G at a concentration of 10−12 M (Figure 53.2d) showed the four highest peaks of R6G (1360, 1508, 1577, and 1649 cm−1). This lowest concentration to be detected, that is, detection limit, is comparable to the results of Leng [23], Galopin [24], and Deng [25] but lower than Shao’s results [26] (Table 53.1). However, the Raman wavelength was different, and the amount of R6G and the measured time were higher. Moreover, GaN NWs can be used in some conditions, which are not suitable for Si NWs due to better oxidation resistance. Furthermore, reaction temperature was higher and the experimental session was longer, implying that Si NWs are a less favorable SERS substrate than GaN NWs. To ensure reproducibility of the SERS signals, any given result is an average of five measurements of different spots on the substrate. However, studies carried out by Shao et al. [26] have repletion of the same results. Also, studies carried out by Zhou et al. [27], even though they measured the R6G signal, showed repeatability but not for the R6G (Table 53.1).
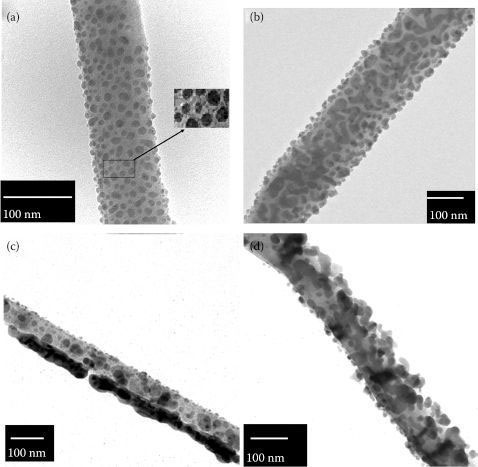
FIGURE 53.1 TEM images of E-beam-deposited Ag NPs grown at different deposition times: (a) 3 s, (b) 15 s, (c) 30 s, (d) 60 s (location of the hot spots shown in the inset of (a)). (D. Nitzan et al., High surface-enhanced Raman scattering (SERS) sensitivity of R6G by fabrication of silver nanoparticles over GaN nanowires, 2011 11th IEEE International Conference on Nanotechnology, Portland, OR, August 15–18, pp. 297–300, © (2011) IEEE. With permission.)
TABLE 53.1
Comparison of the SERS Detection Limit of R6G by Various Research Groups
Research group |
Detection Limit (M) |
Repetition No. of Scans |
Ag NPs Size Distribution (nm) |
Leng et al. [23] |
10−7 |
No data |
30–100 |
Galopin et al. [24] |
10−12 |
No data |
4–40 |
Deng et al. [25] |
10−7 |
No data |
a:6–14; b:80–220 |
Shao et al. [26] |
10–16 |
20 Spots (R6G) |
5–20 |
Zhou el al. [27] |
10−5 |
40 Spots (4-MPY) |
a:50–60; b:80–90 c:120 |
Our paper |
10−12 |
5 Spots (R6G) |
a:2–25; b: >100 |
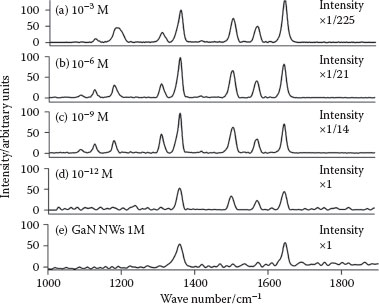
FIGURE 53.2 SERS enhancement of R6G at 3 s deposition time and at different concentrations. (a) 10−3 M, (b) 10−6 M, (c) 10−9 M, (d) 10−12 M, and (e) Raman spectrum of GaN with 1M R6G reference. Intensity is normalized for clear comparison.
53.3.2 RELATIONSHIP BETWEEN AG COVERAGE AND SERS INTENSITY
To investigate the relationships between adsorbed Ag morphology, silver NPs’ coverage, and SERS intensity and magnification, silver% coverage was calculated as shown in Equation 53.1.
(53.1) |
When we investigated the relationships between % coverage and deposition time, we found that at short deposition times, there was a linear relationship between deposition time and % coverage, reaching a plateau when the deposition time was over a minute (% coverage becomes constant). SERS intensity of the 1360 cm−1 peak was lower when the % of coverage was higher (Figure 53.3a). Therefore, SERS intensity decreased slightly with increased deposition time. We hypothesized that not all particles increase the SERS intensity equally; the aggregated bigger particles do not contribute to the SERS amplification as much as the smaller nano-sized ones. To test this hypothesis, we calculated the % coverage of only Ag NPs on the GaN NWs in respect of their SERS intensity (Figure 53.3b). We found a linear relationship between the coverage of Ag NPs and SERS intensity, results which supported the hypothesis. Theoretical predictions of SERS intensity versus particle size, studied by Boyack et al. [28], are in agreement with our results. The “hot-spot” effect, which causes high SERS intensity, occurs in a site between two NPs, where the distance between them is less than 5 nm due to the high-induced electric field in the vicinity of the NPs [29]. An example of a plausible “hot-spot” site was shown in the inset of Figure 53.2a.
There is a trade-off between % coverage and SERS amplification. On the one hand, too low a % coverage (i.e., too few NPs) decreases the enhancement factor. On the other hand, too high a coverage is characterized by a few larger NPs, an island growth pattern which decreases the enhancement factor. Also, too high a % coverage is rather characterized by an island growth pattern with a few NPs, which decreases the SERS intensity. Wang [30] et al. investigated the SERS intensity of 4-mercaptopyridine absorbed on a silicon nanostructure with Ag NPs. He found a similar relationship between SERS intensity and coverage. To conclude, isolated spherical Ag NPs improve the SERS effect, and the higher their planar density, the better the SERS amplification. However, % NP coverage is the way to measure the density of the Ag NPs, which causes the hot-spot effect.
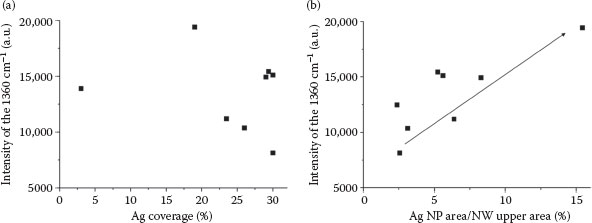
FIGURE 53.3 (a) Relationship between total Ag% coverage and SERS of the 1360 cm−1 peak of 10−3 M R6G. (b) Relationship between Ag NPs’ % coverage and SERS intensity of the 1360 cm−1 peak of 10−3 M R6G. (D. Nitzan et al., High surface-enhanced Raman scattering (SERS) sensitivity of R6G by fabrication of silver nanoparticles over GaN nanowires, 2011 11th IEEE International Conference on Nanotechnology, Portland, OR, August 15–18, pp. 297–300, © (2011) IEEE. With permission.)
53.3.3 GAN CONTRIBUTION TO the SERS EFFECT
Figure 53.2e shows that the SERS intensity of 1 M R6G on GaN NWs without Ag NPS is very low. However, the amount of R6G which adsorbed on the GaN NWs is unknown. The effect of GaN on the SERS intensity is still unclear since GaN cannot be an ordinary Raman enhancer. In general, Raman enhancers are conductive materials, such as silver or gold, which create plasmon resonance through absorption of light. It is suggested that tuning the plasmon resonance maxima due to its dielectric medium properties such as refractive index and dielectric constant [31] may enhance the R6G signal. Also, Ag NPs-coated GaN can transfer the surface plasmon energy due to the waveguide effect [32].
53.4.1 SERS AS a BIOSENSING TOOL
As already written, SERS technique is feasible for the analytical detection of various substrates such as biological materials and for environmental analysis. For using SERS as a biosensing tool, SERS was used to examine the structure, conformation, or charge transfer of biochemicals [33]. The protein redox structure of cytochrome C has been studied by SERS on Ag electrodes by various research groups [34]. Using the recognition chemistry principles of biotin–avidin, researchers have detected 10−7 M of dyed label biotin [35]. Detection of the DNA, which is interesting and important for basic research and technology, has been studied by Vo-Dinh and coworkers [36]. They have immobilized a single DNA strand on a nitrocellulose fiber, followed by exposure of a SERSsensitive dye-labeled hybrid DNA that yields a strong SERS signal. Washing the unbound labeled DNA and measuring the remaining hybrid DNA removed and transferred on a SERS substrate helps detect the initial DNA concentration. Using similar procedures, HIV genes [37] and cancer markers [38] can also be detected. Detection of DNA without markers was carried out by using silver nanoparticles on silicon nanowires [36]. An influenza virus was also detected using a focused ion beam Au nanostructure growth technique [39]. Detection of bacteria can be indirect [40] using Ag nanoparticles synthesized by silver mirror reaction for the detection of dipicolinic acid. Direct pathogen detection was also carried out by Reinhard et al. [41]. They have made nanocluster arrays for SERS substrates to discriminate among different species of bacteria. The SERS technique was also used for the detection of natural products that occur in the environment and in the detection of polysaccharides [42] and natural pigments [43]. SERS was also used for the in vivo chemical mapping of plants and seeds [44]. Water quality (i.e., presence of bacteria, eukaryotes, and viruses) was also detected by SERS [45].
53.4.2 SERS FOR ENVIRONMENTAL DETECTION
SERS has been applied in environmental science for trace analysis of pollutants in water, soil, and the atmosphere [46]. Trace detection of pollutants in natural water and waste water was achieved by SERS by the addition of a small volume of the contaminant onto the metallic SERS enhancer. Trace amounts of pesticides, industrial waste, and other contaminants were detected by SERS in natural water [47,48]. Detection of pollutants in air is more challenging due to the difficulties in the suspended particles in air making contact with the metal enhancer. Contaminants which have functional groups with high affinity to gold or silver enhancers can be naturally adsorbed onto these surfaces. These surfaces were produced from colloids [49,50] and by nanosphere lithography [51]. However, most pollutants are not readily adsorbed on metallic enhancers [46]. To overcome this problem, hybrid materials with hydrophobic interfaces were made [52,53]. They were used to detect polycyclic aromatic hydrocarbons, well known as human carcinogens. In a similar way, mechanical trapping was used for the detection of dioxin and by SERS in aqueous solutions [54].
For the detection of contaminants in the soil by SERS, soil lixiviates are analyzed. SERS was applied for the detection of organo-phosphorous compounds [55]. Humic acids, the major constituent of organic matter in soil, can be detected by SERS using colloidal silver [56]. The behavior of humic acids in natural colloids for understanding their fate as well as the soil structure was studied by [57] using the deposition of humic acid on silver island films. Humic acid reduces gold to make gold colloids [58]. This makes it an excellent substrate for contaminant SERS detection in the soil [59]. Real-time studies with remote monitoring of contaminants in the environment were carried out by Lim et al. [60]. Inorganic ions such as perchlorate, sulfate, nitrate, cyanide, and sulfocyanide were also detected by SERS [61]. Metallic inorganic ions were also detected by complexation of metallic ions to organic ligands [62]. However, the detection of metals that do not have a Raman vibration signal still need to be developed for the actual use as a tool for field measurements [46].
The overall feasibility of the SERS technique for environmental detection has been proved. It is a mature technique with a wide range in fields and applications. It can be used both for solids and solutions, as well as in the lab and for field assays, whenever a portable Raman spectrophotometer is available. However, the real implementation of the SERS technique in the marketplace and routine analysis require valid quantitative analysis and reproducibility, which have not been reported so far. The SERS system should be implemented for molecular and ionic species, regardless of their size composition and aggregation state [46].
53.4.3 SERS AS an ANALYTICAL TOOL
To assess the feasibility of SERS as an analytical tool, important factors should be taken into account. These factors are: uniformity of the substrates, reproducibility of the results, SERS enhancement, and cost [63]. Although virtually every molecule has its unique spectrum, it is quite difficult to interpret signals when a mixture of molecules are adsorbed on the substrate [3]; therefore, a separation technique should be applied to obtain a few kinds of molecules on the substrate that make the signal meaningful. For trace analysis, high enhancement can be obtained for many analytes; sometimes even a single molecule can be detected [64]. The SERS acquisition time is usually very short; it takes just seconds; also, the operation of SERS is easy, which makes it a good choice for industrial purposes. However, for quantitative analysis, reproducibility is still a problem due to the hot-spot effect [24]. Sometimes laser-induced photodesorption as well as photochemistry may occur [65]. Unless the former cases occur, SERS is usually a nondistractive analysis [3]. However, the SERS intensity is linearly related to the molecule’s concentration [3], also due to the hot-spot effect. Substrates can also adsorb molecules which interfere with the SERS signal [66]. It is a problem especially when the signal is weak due to the low concentration of the analyte or when impurities are adsorbed that are much stronger than the analyte. To solve that problem to get mainly the analyte signal without interference, vacuum or plasma cleaning can be introduced [67]. However, if the substrate is reexposed to air, impurities will readsorb on the substrate [68].
Our study shows both high enhancement factor and good reproducibility of the SERS signal ensemble made of GaN NWs partially coated with AgNPs. The SERS substrate has good enough uniformity. The E-beam growing method to prepare SERS substrates was recently used for cancer cell detection [38] and for the analysis of biomolecules [69]. Proven as a good SERS substrate for the R6G dye, apparently, it can be used for the detection of other molecules and substrates at low concentration and high reproducibility.
An ensemble of GaN NWs partially coated with Ag NPs was shown to be an effective SERS template. R6G, which was chosen as a reagent for SERS detection, was detected at concentrations as low as 10−12 M. We have shown that SERS intensity has a linear relationship with the % of coverage of Ag NPs. Also, Ag NPs show better enhancement than larger particles. The SERS technique has been applied for many kinds of substances such as SERS as a biosensing tool for DNA, viruses, bacteria, and cells. SERS was also applied for environmental detection in air, water, and soil. Other applications of SERS are in forensic science and explosive detection. However, for the actual use of SERS as a commercial tool, research should overcome some drawbacks, especially reproducibility of the substrate, detection limit (for trace detection), and substrate contamination.
1. Kneipp, K., M. Moskovits, and H. Kneipp, Surface-Enhanced Raman Scattering: Physics and Applications. Vol. 103. 2006: Springer Verlag, pp. 1–17.
2. Stiles, P.L. et al., Surface-enhanced Raman spectroscopy. Annual Review of Analytical Chemistry, 2008. 1: 601–626.
3. Aroca, R. and E. Corporation, Surface Enhanced Vibrational Spectroscopy. 2006: Wiley Online Library, pp. 73–176.
4. Kneipp, K. et al., Ultrasensitive chemical analysis by Raman spectroscopy. Chemical Reviews, 1999. 99: 2957–2976.
5. Fleischmann, M, P.J. Hendra, and A.J. McQuillan, Raman spectra of pyridine adsorbed at a silver electrode. Chemical Physics Letters, 1974. 26(2): 163–166.
6. Albrecht, M.G. and J.A. Creighton, Anomalously intense Raman spectra of pyridine at a silver electrode. Journal of the American Chemical Society, 1977. 99(15): 5215–5217.
7. Jeanmaire, D.L. and R.P. Vanduyne, Surface Raman spectro electrochemistry 1: Heterocyclic, aromatic and aliphatic-amines adsorbed on anodized silver electrode. Journal of Electroanalytical Chemistry, 1977. 84(1): 1–20.
8. Gersten, J. and A. Nitzan, Electromagnetic theory of enhanced Raman scattering by molecules adsorbed on rough surfaces. Journal of Chemical Physics, 1980. 73(7): 3023–3037.
9. Williamson, T.L. et al., Porous GaN as a template to produce surface-enhanced Raman scattering-active surfaces. The Journal of Physical Chemistry B, 2005. 109(43): 20186–20191.
10. Moskovits, M., Surface-enhanced spectroscopy. Reviews of Modern Physics, 1985. 57(3): 783–826.
11. Persson, B.N.J., K. Zhao, and Z. Zhang, Chemical contribution to surface-enhanced Raman scattering. Physical Review Letters, 2006. 96(20): 207401.
12. Moskovits, M., Surface-enhanced Raman spectroscopy: A brief retrospective. Journal of Raman Spectroscopy, 2005. 36(6–7): 485–496.
13. Lombardi, J.R. et al., Charge-transfer theory of surface enhanced Raman spectroscopy: Herzberg–Teller contributions. The Journal of Chemical Physics, 1986. 84: 4174.
14. Persson, B.N.J., On the theory of surface enhanced Raman scattering. Chemical Physics Letters, 1981. 82(3): 561–565.
15. Chattopadhyay, S. et al., One-dimensional group III-nitrides: Growth, properties, and applications in nanosensing and nano-optoelectronics. Critical Reviews in Solid State and Materials Sciences, 2009. 34(3–4): 224–279.
16. Bloom, S. et al., Band-structure and reflectivity of GaN. Physica Status Solidi B-Basic Research, 1974. 66(1): 161–168.
17. Goldberger, J. et al., Single-crystal gallium nitride nanotubes. Nature, 2003. 422(6932): 599–602.
18. Kang, B. et al., Capacitance pressure sensor based on GaN high-electron-mobility transistor-on-Si membrane. Applied Physics Letters, 2005. 86(25): 253502–253502-3.
19. Lee, K.-H. et al., The effect of nanoscale protrusions on field-emission properties for GaN nanowires. Journal of the Electrochemical Society, 2007. 154(10): K87–K91.
20. Stamplecoskie, K.G. et al., Optimal size of silver nanoparticles for surface-enhanced Raman spectroscopy. Journal of Physical Chemistry C, 2011. 115(5): 1403–1409.
21. Hildebrandt, P. and M. Stockburger, Surface-enhanced resonance Raman spectroscopy of rhodamine 6G adsorbed on colloidal silver. Journal of Physical Chemistry, 1984. 88(24): 5935–5944.
22. Nie, S. and S.R. Emory, Probing single molecules and single nanoparticles by surface-enhanced Raman scattering. Science, 1997. 275(5303): 1102.
23. Leng, W. et al., Silver nanocrystal-modified silicon nanowires as substrates for surface-enhanced Raman and hyper-Raman scattering. Analytical Chemistry, 2006. 78(17): 6279–6282.
24. Galopin, E. et al., Silicon nanowires coated with silver nanostructures as ultrasensitive interfaces for surface-enhanced Raman spectroscopy. ACS Applied Materials & Interfaces, 2009. 1(7): 1396–1403.
25. Deng, S. et al., An effective surface-enhanced Raman scattering template based on a Ag nanocluster–ZnO nanowire array. Nanotechnology, 2009. 20: 175705.
26. Shao, M.-W. et al., Ag-modified silicon nanowires substrate for ultrasensitive surface-enhanced Raman spectroscopy. Applied Physics Letters, 2008. 93(23): 233118(1–3).
27. Zhou, J. et al., In situ nucleation and growth of silver nanoparticles in membrane materials: A controllable roughened SERS substrate with high reproducibility. Journal of Raman Spectroscopy, 2009. 40(1): 31–37.
28. Boyack, R. and E.C. Le Ru, Investigation of particle shape and size effects in SERS using T-matrix calculations. Physical Chemistry Chemical Physics, 2009. 11(34): 7398–7405.
29. Hao, E. and G.C. Schatz, Electromagnetic fields around silver nanoparticles and dimers. Journal of Chemical Physics, 2004. 120(1): 357–366.
30. Wang, Z. and L. Rothberg, Silver nanoparticle coverage dependence of surface-enhanced Raman scattering. Applied Physics B: Lasers and Optics, 2006. 84(1): 289–293.
31. Miller, M.M. and A.A. Lazarides, Sensitivity of metal nanoparticle surface plasmon resonance to the dielectric environment. The Journal of Physical Chemistry B, 2005. 109(46): 21556–21565.
32. Hutchison, J.A. et al., Subdiffraction limited, remote excitation of surface enhanced Raman scattering. Nano Letters, 2009. 9(3): 995–1001.
33. Picorel, R. et al., Surface-enhanced resonance Raman scattering spectroscopy of photosystem II pigment-protein complexes. The Journal of Physical Chemistry, 1994. 98(23): 6017–6022.
34. Feng, J.J. et al., Gated electron transfer of yeast Iso-1 cytochrome c on self-assembled monolayer-coated electrodes. The Journal of Physical Chemistry B, 2008. 112(47): 15202–15211.
35. Pieczonka, N.P.W., P.J.G. Goulet, and R.F. Aroca, Chemically selective sensing through layer-by-layer incorporation of biorecognition into thin film substrates for surface-enhanced resonance Raman scattering. Journal of the American Chemical Society, 2006. 128(39): 12626–12627.
36. Culha, M. et al., Surface-enhanced Raman scattering substrate based on a self-assembled monolayer for use in gene diagnostics. Analytical Chemistry, 2003. 75(22): 6196–6201.
37. Isola, N.R., D.L. Stokes, and T. Vo-Dinh, Surface-enhanced Raman gene probe for HIV detection. Analytical Chemistry, 1998. 70(7): 1352–1356.
38. Liu, Y. et al., Fabrication of silver ordered nanoarrays SERS-active substrates and their applications in bladder cancer cells detection. Spectroscopy and Spectral Analysis, 2012. 32(2): 386–390.
39. Fan, M., G.F.S. Andrade, and A.G. Brolo, A review on the fabrication of substrates for surface enhanced Raman spectroscopy and their applications in analytical chemistry. Analytica Chimica Acta, 2011. 693(1–2): 7–25.
40. Daniels, J.K. and G. Chumanov, Nanoparticle-mirror sandwich substrates for surface-enhanced Raman scattering. The Journal of Physical Chemistry B, 2005. 109(38): 17936–17942.
41. Yan, B. et al., Engineered SERS substrates with multiscale signal enhancement: Nanoparticle cluster arrays. ACS Nano, 2009. 3(5): 1190–1202.
42. Shafer-Peltier, K.E. et al., Toward a glucose biosensor based on surface-enhanced Raman scattering. Journal of the American Chemical Society, 2003. 125(2): 588–593.
43. Schulte, F. et al., Characterization of pollen carotenoids with in situ and high-performance thinlayer chromatography supported resonant Raman spectroscopy. Analytical Chemistry, 2009. 81(20): 8426–8433.
44. Rösch, P., J. Popp, and W. Kiefer, Raman and surface enhanced Raman spectroscopic investigation on Lamiaceae plants. Journal of Molecular Structure, 1999. 480–481(0): 121–124.
45. Shanmukh, S. et al., Rapid and sensitive detection of respiratory virus molecular signatures using a silver nanorod array SERS substrate. Nano Letters, 2006. 6(11): 2630–2636.
46. Alvarez-Puebla, R. and L. Liz-Marzan, Environmental applications of plasmon assisted Raman scattering. Energy & Environmental Science, 2010. 3(8): 1011–1017.
47. Weiβenbacher, N. et al., Continuous surface enhanced Raman spectroscopy for the detection of trace organic pollutants in aqueous systems. Journal of Molecular Structure, 1997. 410: 539–542.
48. Taurozzi, J.S. and V.V. Tarabara, Silver nanoparticle arrays on track etch membrane support as flow-through optical sensors for water quality control. Environmental Engineering Science, 2007. 24(1): 122–137.
49. Ayora, M. et al., Detection of atmospheric contaminants in aerosols by surface-enhanced Raman spectrometry. Analytica Chimica Acta, 1997. 355(1): 15–21.
50. Fernandez-Lopez, C. et al., Highly controlled silica coating of PEG-capped metal nanoparticles and preparation of SERS-encoded particles. Langmuir, 2009. 25(24): 13894–13899.
51. Biggs, K.B. et al., Surface-enhanced Raman spectroscopy of benzenethiol adsorbed from the gas phase onto silver film over nanosphere surfaces: Determination of the sticking probability and detection limit time†. The Journal of Physical Chemistry A, 2009. 113(16): 4581–4586.
52. Jones, C.L., K.C. Bantz, and C.L. Haynes, Partition layer-modified substrates for reversible surface-enhanced Raman scattering detection of polycyclic aromatic hydrocarbons. Analytical and Bioanalytical Chemistry, 2009. 394(1): 303–311.
53. Guerrini, L. et al., Sensing polycyclic aromatic hydrocarbons with dithiocarbamate-functionalized Ag nanoparticles by surface-enhanced Raman scattering. Analytical Chemistry, 2009. 81(3): 953–960.
54. Aldeanueva-Potel, P. et al., Recyclable molecular trapping and SERS detection in silver-loaded agarose gels with dynamic hot spots. Analytical Chemistry, 2009. 81(22): 9233–9238.
55. Alak, A.M. and T. Vo-Dinh, Surface-enhanced Raman spectrometry of organo phosphorus chemical agents. Analytical Chemistry, 1987. 59(17): 2149–2153.
56. Sánchez-Cortés, S. et al., pH-dependent adsorption of fractionated peat humic substances on different silver colloids studied by surface-enhanced Raman spectroscopy. Journal of Colloid and Interface Science, 1998. 198(2): 308–318.
57. Alvarez-Puebla, R.A., J.J. Garrido, and R.F. Aroca, Surface-enhanced vibrational microspectroscopy of fulvic acid micelles. Analytical Chemistry, 2004. 76(23): 7118–7125.
58. Machesky, M.L., W.O. Andrade, and A.W. Rose, Interactions of gold (III) chloride and elemental gold with peat-derived humic substances. Chemical Geology, 1992. 102(1–4): 53–71.
59. Baigorri, R. et al., Optical enhancing properties of anisotropic gold nanoplates prepared with different fractions of a natural humic substance. Chemistry of Materials, 2008. 20(4): 1516–1521.
60. Lim, C. et al., Optofluidic platforms based on surface-enhanced Raman scattering. Analyst, 2010. 135(5): 837–844.
61. Gu, B., C. Ruan, and W. Wang, Perchlorate detection at nanomolar concentrations by surface-enhanced Raman scattering. Applied Spectroscopy, 2009. 63(1): 98–102.
62. Bhandari, D. et al., Characterization and detection of uranyl ion sorption on silver surfaces using surface enhanced Raman spectroscopy. Analytical Chemistry, 2009. 81(19): 8061–8067.
63. Tripp, R.A., R.A. Dluhy, and Y. Zhao, Novel nanostructures for SERS biosensing. Nano Today, 2008. 3(3–4): 31–37.
64. Kneipp, K. et al., Single molecule detection using surface-enhanced Raman scattering (SERS). Physical Review Letters, 1997. 78(9): 1667–1670.
65. Zhdanov, V.P. and B. Kasemo, Specifics of substrate-mediated photo-induced chemical processes on supported nm-sized metal particles. Journal of Physics: Condensed Matter, 2004. 16: 7131.
66. Lin, X.M. et al., Surface-enhanced Raman spectroscopy: Substrate-related issues. Analytical and Bioanalytical Chemistry, 2009. 394(7): 1729–1745.
67. Norrod, K.L. and K.L. Rowlen, Removal of carbonaceous contamination from SERS-active silver by self-assembly of decanethiol. Analytical Chemistry, 1998. 70(19): 4218–4221.
68. Taylor, C.E., S.D. Garvey, and J.E. Pemberton, Carbon contamination at silver surfaces: Surface preparation procedures evaluated by Raman spectroscopy and X-ray photoelectron spectroscopy. Analytical Chemistry, 1996. 68(14): 2401–2408.
69. David, C. et al., SERS detection of biomolecules using lithographed nanoparticles towards a reproducible SERS biosensor. Nanotechnology, 2010. 21: 475501.
70. D., Nitzan, W.-J. Wang, K.-H. Lee, and I.-G. Chen, High surface-enhanced Raman scattering (SERS) sensitivity of R6G by fabrication of silver nanoparticles over GaN nanowires, 2011 11th IEEE International Conference on Nanotechnology, Portland, OR, August 15–18, 2011, pp. 297–300.