

At this point, you have learned how to use fundamentals and technicals to find the right stock at the right time to buy. You have learned how to set an exit strategy and not to get emotionally attached to a stock. You have learned how to use insider buying and institutional ownership to further refine your stock selection process.
But if all you do is find the right stocks to buy at the right time, you can still fail (and fail miserably) at building a world-class portfolio of stocks. Rules 8 and 9 will teach you how to balance your investments based on the amount of money you have to invest in the stock market and, at the same time, avoid putting too many of your eggs in one basket.
Rule 8 is all about diversification. In this rule, you will learn how proper diversification can save your investment life when all else fails.
You have heard all your life that you shouldn't put all your eggs in one basket. In other words, you should not put your entire life's financial security into a single investment or single type of investment. The reason is obvious, of course. The risk is just too high that something unforeseen could happen and either financially cripple you or, worse, wipe you out completely.
I doubt there are very many investors who do not clearly recognize the truth in that saying. But you might be surprised at how few investors do much more than pay lip service to this axiom of life.
It amazes me how most investors either do not know how to stay diversified or they simply believe the worst cannot happen to them. I was at a meeting recently where I was extolling the importance of a sensible, rules-based approach to diversification. From the back of the room, a gentleman raised his hand and said that well-diversified portfolios couldn't make enough profit for him. He went on to say that he purposely keeps his portfolio undiversified.
I'll admit that his remarks surprised me. I'm sure a lot of investors may think that, but it is rare to hear someone actually proclaim it as a strategy.
My response to him was that I place too high a value on low risk and that I am quite satisfied to make 20 percent or more per year with highly diversified portfolios. I could tell from his body language that he was skeptical. I wasn't sure if his skepticism was about the 20 percent or the risk comment.
It is possible that you can be lucky and bet the farm on a single strategy that pays off in huge returns. But do you really want to "bet the farm" when the "farm" is your entire financial life? I don't know of anyone willing to put everything at risk on one spin of the roulette wheel. Because that is exactly what it is—gambling. A poorly diversified portfolio is virtually the same as a turning your portfolio into a game of chance.
Stock market investing is not gambling if you are a rules-based investor and follow a regimented and disciplined investment strategy. However, if you guess at what to buy and when to sell and ignore diversification, you would likely be just as well off to go to Vegas and hit the gambling tables.
Smart diversification can turn your investments into money-making strategies. Lack of diversification will turn your investments into a game of chance.
Let me illustrate what I mean with a personal story.
Several years ago, when I only had 3 or 4 of my 10 rules in place, I was investing heavily in the stock market. It just so happened that real estate investment trusts (REITs) were doing extremely well. In fact, they were doing so well that you could hardly lose money if you invested in REITs. In many ways, it was kind of like printing money. It didn't really matter which REIT you bought; it would move higher in price. Several of the REITs hadn't issued a sell signal for more than two years!
I began buying more and more REITs. It wasn't long before REITs made up more than 60 percent of my portfolio. It wasn't uncommon to make more than 6 percent and sometimes more than 10 percent gains in my entire portfolio on a weekly basis. I would give a huge excited whoop every time I looked at my portfolio! I was a genius! There was no doubt that I was becoming one of the most successful stock market investors to have ever lived! My name would soon be in lights!
I was bragging about my stock market prowess to one of my investor friends who had been investing in the market for decades before I began investing. He asked me, "What percent of your total portfolio is devoted to REITs?"
I said, "60 percent and I'm thinking about adding more!"
He said, "Don't you think you are a little overweighted in REITs?"
I told him, "Absolutely not. I've got many different types of REITs, including rental property, commercial property, mortgages, land, malls, and so on. I am extremely diversified. And besides, it doesn't really matter. I've got stop loss settings on all my REITs, so if something bad happens, I'll be more than okay. In the meantime, I want to keep this thing going!"
Well (some of you already know this next part, because perhaps you experienced it, too), it was only about a month later that the bottom fell out of the REIT industry. Some REITs lost more than 40 percent within a matter of hours. I lost more than 20 percent of my portfolio's value in just a few days' time. I saw more than eight months of growth in my portfolio's value lost—in less than two weeks.
I had no excuse. It was my ego, arrogance, greed, and stupidity that put my financial net worth at serious risk. That was an extremely valuable lesson to learn. Why is it that it seems the best lessons learned are almost always the most expensive?
I learned more than one lesson in that REIT debacle. I learned that unrealized gain is a fleeting mistress that looks real in one moment and vaporizes in the next. I learned that older, wiser investors should be carefully and respectfully listened to. I learned that the less diversified my portfolio, the more risk is in my portfolio. I also learned that regardless of how successful you are in the stock market, the market has a very bad habit of knocking you down when you least expect it. I learned to hope for the best, but plan for the worst—always!
Of course, to be properly diversified, you must first understand what it means to be diversified. Owning three different types of REITs is not diversification.
Assuming you read the definition of diversification, your objective is to not own too many stocks that belong to the same group. You remember, of course, our beloved wildebeest. In this case, think of the herd as an entire sector of stocks, where each Wildebeest is a different stock. Now, let's assume the herd is merrily romping across the savanna when a pride of lions lunges out of the tall grass right in the path of the herd. In a heartbeat, the whole herd suddenly changes from romping to running hard and moves quickly in the opposite direction. If all your stocks were in that herd, you could go from gaining share price to suddenly losing share price and in a big way.
Staying with that analogy, you can think of industries as small herds of stocks. Sectors are large herds of stocks. In either case, you do not want to have all of your stocks in a single herd. A good approach to diversification would be to keep a reasonable limit of stocks in each different industry and different sector. That way, you could be reasonably assured that the lions would not attack all herds at the same time from the same direction. In this way, you have lessened your risk to significant loss.
Moving away from the wildebeest analogy, diversification is nothing more than making sure you don't have too much of your money tied up in too few sectors and industries. Since every stock belongs to an industry and a sector, the simplest way to maintain reasonable diversification is to control the percentage of your portfolio by sector and industry.
Currently, there are about 11 sectors and over 250 industries. Every stock belongs to one and only one sector and one and only one industry. Every industry belongs to one and only one sector. Some sectors have dozens of industries and several hundred stocks. Some sectors have only a couple industries and very few stocks. Some industries have many stocks and some have only a few.
It is not important that you know how many stocks are in each sector and industry as much as you know that sectors are comprised of groups of industries and industries are comprised of groups of stocks.
In this way, you can quantify how much of your portfolio is devoted, by percentage, to sectors and industries.
Following is a series of lists[14] of the 11 major sectors. Below each sector is a list of industries associated with or belonging to the sector.
I show you this list to make sure you understand the granularity of the groupings. Too many times, you hear a comment from a financial pundit stating something about the Energy sector or the Oil sector or the Precious Metals sector. None of those terms are correct. There is no such designation as "Energy sector." There is a "Basic Materials" sector that has a lot of energy-related stocks in various industries, such as Oil and Gas operations, but nowhere is there a designation of "Energy." All this means that various organizations arbitrarily assign a different classification to various groups of stocks. It doesn't matter which nomenclature you use as long as you use the classification to help you stay diversified in your portfolio.
As for this list of sectors and industries, I am totally agnostic. It matters not a bit to me which of these sectors or industries or the stocks contained therein that I select for my portfolios, and I strongly suggest you remain just as agnostic. What matters is whether the stock selected meets your requirements for quality, as defined in Rules 1, 2, 6, and 7; that the stock meets your requirements for the right time to buy as defined in Rules 3 and 10; and that the stock stays within your diversification requirements as defined in Rules 8 and 9.
Following this list, you will learn how to set the limits of how much of your portfolio can be allocated to sectors and industries.
The Basic Materials sector is a group of industries that are involved with the discovery, development, and processing of raw materials. The industries in the Basic Materials sector are:
Agricultural Chemicals
Aluminum
Chemical Manufacturing
Chemicals—Major Diversified
Chemicals—Plastics and Rubber
Coal
Copper
Gold and Silver
Gold Industry
Independent Oil and Gas
Industrial Metals and Minerals
Iron and Steel
Major Integrated Oil and Gas
Metal Mining
Miscellaneous Fabricated Products
Nonmetallic Mineral Mining
Oil and Gas—Integrated
Oil and Gas Drilling and Exploration
Oil and Gas Equipment and Services
Oil and Gas Operations
Oil and Gas Pipelines
Oil and Gas Refining and Marketing
Oil Well Services and Equipment
Paper and Paper Products
Silver
Specialty Chemicals
Synthetics
The Capital Goods sector is a relatively small group of industries that are related to the manufacture or distribution of goods. There is a small number of industries, but those industries contain a diverse set of companies. The industries in the Capital Goods sector are:
Aerospace and Defense
Construction—Supplies and Fixtures
Construction Services
Miscellaneous Capital Goods
The Consumer Cyclical sector is a group of consumer-related industries that are sensitive to business cycles, whose performance is strongly tied to the overall economy. Consumer Cyclical companies tend to make products or provide services that are in lower demand during economic downturns and higher demand during economic upswings. Following is a list of industries in the Consumer Cyclical sector:
Apparel—Accessories
Audio and Video Equipment
Auto and Truck Manufacturers
Auto and Truck Parts
Furniture and Fixtures
Jewelry and Silverware
Photography
Recreational Products
The Consumer Goods sector includes a wide range of industries' products, from clothing and footwear to household and personal products. Within this diverse sector are the following industries.
Appliances
Auto Manufacturers—Major
Auto Parts
Beverages—Brewers
Beverages—Soft Drinks
Beverages—Wineries and Distillers
Business Equipment
Cleaning Products
Confectioners
Dairy Products
Electronic Equipment
Farm Products
Food—Major Diversified
Home Furnishings and Fixtures
Housewares and Accessories
Meat Products
Office Supplies
Packaging and Containers
Personal Products
Photographic Equipment and Supplies
Processed and Packaged Goods
Recreational Goods, Other
Recreational Vehicles
Rubber and Plastics
Sporting Goods
Textile—Apparel Clothing
Textile—Apparel Footwear and Accessories
Tobacco Products, Other
Toys and Games
Trucks and Other Vehicles
The Consumer Non-Cyclical sector is a group of consumer-related industries that are not sensitive to business cycles, whose performance is not strongly tied to the overall economy. Consumer Non-Cyclical companies tend to make products or provide services that are consistently in demand during all economic fluctuations. Following is a list of industries in the Consumer Non-Cyclical sector:
Beverages (Alcoholic)
Beverages (Nonalcoholic)
Crops
Food Processing
Personal and Household Products
The Financial sector is a group of industries that comprise financial institutions and financial markets. It has often been said that the Financial sector leads the economy into and out of recessions. The following industries are included in the Financial sector:
Asset Management
Closed-End Fund—Debt
Closed-End Fund—Equity
Closed-End Fund—Foreign
Consumer Financial Services
Credit Services
Diversified Investments
Foreign Money Center Banks
Foreign Regional Banks
Insurance (Accident and Health)
Insurance (Life)
Insurance (Property and Casualty)
Insurance Brokers
Investment Brokerage—National
Investment Brokerage—Regional
Investment Services
Miscellaneous Financial Services
Money Center Banks
Mortgage Investment
Property Management
Real Estate Development
Regional—Mid-Atlantic Banks
Regional—Midwest Banks
Regional—Northeast Banks
Regional—Pacific Banks
Regional—Southeast Banks
Regional—Southwest Banks
Regional Banks
REIT—Diversified
REIT—Healthcare Facilities
REIT—Hotel-Motel
REIT—Office
REIT—Residential
REIT—Retail
S&Ls—Savings Banks
Surety and Title Insurance
The Health Care sector is comprised of a group of industries that focus on medical and health care goods or services. Stocks in the Health Care sector are frequently considered to be defensive because the products and services are essential. This means that even during economic downturns, people will still require medical aid and medicine to overcome illness. This consistent demand for goods and services makes this sector less sensitive to business cycle fluctuations. The industries in the Health Care sector are:
Biotechnology
Biotechnology and Drugs
Diagnostic Substances
Drug Delivery
Drug Manufacturers—Major
Drug Manufacturers—Other
Drug-Related Products
Drugs—Generic
Health Care Plans
Health Care Facilities
Home Health Care
Hospitals
Long-Term Care Facilities
Medical Appliances and Equipment
Medical Equipment and Supplies
Medical Instruments and Supplies
Medical Laboratories and Research
Medical Practitioners
Specialized Health Services
The Industrial Goods sector is comprised of a group of industries that focus on machinery, manufacturing plants, materials, and other goods or component parts for use or consumption by other industries or firms. Generally, when demand for Consumer Goods increases, the demand for Industrial Goods also increases. The industries in the Industrial Goods sector are:
Aerospace-Defense—Major Diversified
Aerospace-Defense—Products and Services
Cement
Diversified Machinery
Farm and Construction Machinery
General Building Materials
General Contractors
Heavy Construction
Industrial Electrical Equipment
Industrial Equipment and Components
Lumber, Wood Production
Machine Tools and Accessories
Manufactured Housing
Metal Fabrication
Pollution and Treatment Controls
Residential Construction
Small Tools and Accessories
Textile Industrial
Waste Management
The Services sector is a group of industries that provide intangible products (services) that are not goods (tangible products) to consumers. Industries included in the Services sector are:
Advertising
Advertising Agencies
Air Delivery and Freight Services
Air Services, Other
Apparel Stores
Auto Dealerships
Auto Parts Stores
Auto Parts Wholesale
Basic Materials Wholesale
Broadcasting—Radio
Broadcasting—TV
Broadcasting and Cable TV
Building Materials Wholesale
Business Services
Casinos and Gaming
Catalog and Mail Order Houses
CATV Systems
Communications Services
Computers Wholesale
Consumer Services
Department Stores
Discount, Variety Stores
Drug Stores
Drugs Wholesale
Education and Training Services
Electronics Stores
Electronics Wholesale
Entertainment—Diversified
Food Wholesale
Gaming Activities
General Entertainment
Grocery Stores
Home Furnishing Stores
Home Improvement Stores
Hotels and Motels
Industrial Equipment Wholesale
Jewelry Stores
Lodging
Major Airlines
Management Services
Marketing Services
Medical Equipment Wholesale
Movie Production, Theaters
Music and Video Stores
Personal Services
Printing and Publishing
Publishing—Newspapers
Publishing—Periodicals
Railroads
Real Estate Operations
Recreational Activities
Regional Airlines
Rental and Leasing Services
Research Services
Resorts and Casinos
Restaurants
Retail—Apparel
Retail—Catalog and Mail Order
Retail—Department and Discount
Retail—Home Improvement
Retail—Specialty
Retail—Technology
Schools
Security and Protection Services
Shipping
Specialty Eateries
Specialty Retail, Other
Sporting Activities
Sporting Goods Stores
Staffing and Outsourcing Services
Technical Services
Toy and Hobby Stores
Trucking
Wholesale, Other
The Technology sector is a comprised of a group of industries that focus on the application of information in the design, production, and utilization of goods and services, and in the organization of human activities. Industries belonging in the Technology sector are:
Application Software
Business Software and Services
Communication Equipment
Computer-Based Systems
Computer Networks
Computer Peripherals
Computer Services
Computer Storage Devices
Data Storage Devices
Diversified Communication Services
Diversified Computer Systems
Diversified Electronics
Electronic Instruments and Controls
Healthcare Information Services
Information and Delivery Services
Information Technology Services
Internet Information Providers
Internet Service Providers
Internet Software and Services
Long Distance Carriers
Multimedia and Graphics Software
Networking and Communication Devices
Personal Computers
Printed Circuit Boards
Processing Systems and Products
Scientific and Technical Instruments
Security Software and Services
Semiconductor—Broad Line
Semiconductor—Integrated Circuits
Semiconductor—Specialized
Semiconductor Equipment and Materials
Semiconductor—Memory Chips
Semiconductors
Software and Programming
Technical and System Software
Telecom Services—Domestic
Telecom Services—Foreign
Wireless Communications
The Transportation sector is comprised of a group of industries that focus on transporting people and/or goods from one physical location to another.
The Utilities sector is comprised of a group of industries that focus on utilities such as gas and power. The Utilities sector typically performs best when interest rates are falling or remain low. The industries included in the Utilities sector are:
Diversified Utilities
Electric Utilities
Foreign Utilities
Gas Utilities
Natural Gas Utilities
Water Utilities
A little later in this rule, you will see an example portfolio that is well diversified by sector and industry. Remember, from an agnostic point of view—the view I want you to have—it doesn't matter which stock or which industry or which sector. The right stock within the right industry and the right sector will be determined through your application of Rules 1, 2, 3, 6, 7, and 10. Once you have selected the stocks you are considering to buy, you will use Rules 8 and 9 to see if you have sufficient room, on a percentage basis, to add those stocks to your portfolio.
If you already have too much of your portfolio invested in a certain sector or industry, you will have to bypass adding another stock in that sector or industry to your portfolio, regardless of how much you want to buy the stock and regardless of how great the stock looks from your application of these 10 Rules in your analysis of the stock.
So just how do you determine if you can add a great stock to your portfolio? The answer is all about how you enforce diversification in your portfolio.
The wonderful part about following the diversification rule is that it allows you to add further distance between your investment decisions and your emotions. As I have said before, emotions are an anathema to your ability to make money in the stock market.
As I alluded to in my story on failing to heed a strong diversification strategy at the beginning of this rule, markets tend to move up or down in large groups of stocks. Right now, commodity stocks are universally surging higher almost every day, while the homebuilder stocks have plummeted to decade lows.
You could buy stocks that focus on gold, oil, wheat, silver, gas, corn—it doesn't matter. If it is a commodity stock, it is going higher. And there are dozens of stocks from which to choose. It would be easy to load your portfolio up with stocks that would make you a lot of money, but if or when those stocks quit moving higher, they most likely won't be sending you a message telling you to sell at the top. Odds are, you will get caught in a big pullback in these stocks as the big institutions unload them in order to capture profits. When that time comes—and come it will—you won't be able to get out of those stocks fast enough. If they occupy too large of a position in your portfolio, you could easily lose a significant portion of your net worth.
So it is important to have some kind of control or limit on how many stocks of a certain type you can or should have in your portfolio at any one time, regardless of how strong those stocks might be with regard to share price appreciation.
Like everything else in this book, I have a formula for diversification that should be zealously followed, and this rule is no exception.
The Diversification Rule: Do not invest more than 30 percent of the total value of your portfolio in any one sector and no more than 20 percent of the total value of your portfolio in any one industry.
As simple as this rule is, it is profoundly helpful as you build, manage, and grow your portfolio of stocks. Often, you will find several great stocks you want to have in your portfolio, and if you were not following this rule, you could easily find yourself significantly overweighted in one sector or industry.
Staying diversified will keep you out of trouble. It will keep you from letting greed manage your portfolio instead of commonsense rules. Table 8.1 is an example portfolio that will help illustrate how to implement this rule.
The column entitled "Pct by Basis" is the percentage of the portfolio used to buy each of the 10 positions. You should note that the approximate distribution is about 10 percent (there will be more on this in Rule 9). The assumption is that the portfolio started out with $30,000 to invest in the market.
Table 8.1. Example Portfolio
Basis per Share | Total Basis | Pct by Basis | Current Price | Total Value | Pct by Value | ||
|---|---|---|---|---|---|---|---|
GNA | 240 | 12.90 | 3,096.00 | 10.32% | 14.99 | 3,597.60 | 11.99% |
AGU | 40 | 65.10 | 2,604.00 | 8.68% | 73.77 | 2,950.80 | 9.84% |
APA | 30 | 107.01 | 3,210.30 | 10.70% | 114.71 | 3,441.30 | 11.47% |
NEU | 50 | 61.18 | 3,059.00 | 10.20% | 66.95 | 3,347.50 | 11.16% |
RNST | 140 | 21.47 | 3,005.80 | 10.02% | 21.06 | 2,948.40 | 9.83% |
WMT | 60 | 49.78 | 2,986.80 | 9.96% | 49.59 | 2,975.40 | 9.92% |
BVN | 100 | 32.50 | 3,250.00 | 10.83% | 76.30 | 7,630.00 | 25.43% |
DVN | 40 | 74.13 | 2,965.20 | 9.88% | 102.72 | 4,108.80 | 13.70% |
ECA | 50 | 58.98 | 2,949.00 | 9.83% | 76.21 | 3,810.50 | 12.70% |
GGB | 200 | 14.22 | 2,844.00 | 9.48% | 32.77 | 6,554.00 | 21.85% |
Total Percent | 99.90% | 137.88% |
The total percent of the portfolio, from a basis perspective, is 99.90 percent. This means virtually the entire portfolio is invested.
The column entitled "Pct by Value" represents how much of the original $30,000 is held by each position. Some positions have lost some money; others have gained. The total percent of the portfolio, based on the current share price (lower right corner) is 137.88 percent. This means the portfolio has a profit of 37.88 percent.
Just by looking at the list of stocks in the table and the percentages, would you say this portfolio is appropriately diversified? You will find out whether it is diversified as we work our way through the analysis of the portfolio.
Now, let's look at the same example, but include a column for industry and see how much of the basis investment of the portfolio is devoted to each industry (see Table 8.2).
Remember the rule: no more than 20 percent in any one industry.
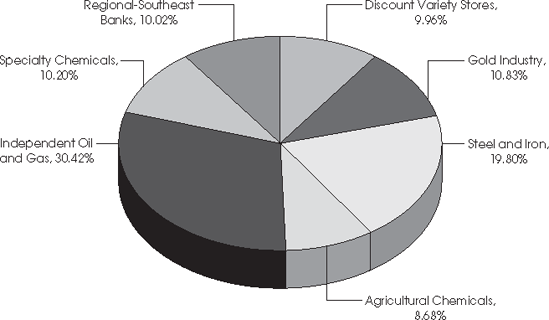
Figure 8.1 shows a pie chart of the portfolio by industry, using the original basis investment. It is a graphic representation of the Total Basis column from Table 8.2. You should note that this portfolio is overweighted in the Independent Oil and Gas industry. The maximum allowable is 20 percent. In this example, the total amount invested is 30.42 percent, which is 10.42 percent over the limit.
There are three stocks listed as having Independent Oil and Gas as the associated industry: APA, DVN, and ECA. The Oil and Gas industry is overweighted in the portfolio by more than a third. The maximum amount of the portfolio that should be allocated to one industry is 20 percent. Something has to be done to correct this overweight situation. There are two choices:
Sell enough shares of each of the three holdings in that industry (APA, DVN, ECA) to get it down to 20 percent.
Sell all of one of the holdings.
Either way, other than adding more money to the portfolio, the total number of shares held in this industry has to be reduced.
Table 8.2. Example Portfolio—Industry View
Industry | Shares | Basis per Share | Total Basis | Pct by Basis | Current Price | Total Value | Pct by Value | |
|---|---|---|---|---|---|---|---|---|
GNA | Steel and Iron | 240 | 12.90 | 3,096.00 | 10.32% | 14.99 | 3,597.60 | 11.99% |
AGU | Agricultural Chemicals | 40 | 65.10 | 2,604.00 | 8.68% | 73.77 | 2,950.80 | 9.84% |
APA | Independent Oil and Gas | 30 | 107.01 | 3,210.30 | 10.70% | 114.71 | 3,441.30 | 11.47% |
NEU | Specialty Chemicals | 50 | 61.18 | 3,059.00 | 10.20% | 66.95 | 3,347.50 | 11.16% |
RNST | Regional—Southeast Banks | 140 | 21.47 | 3,005.80 | 10.02% | 21.06 | 2,948.40 | 9.83% |
WMT | Discount, Variety Stores | 60 | 49.78 | 2,986.80 | 9.96% | 49.59 | 2,975.40 | 9.92% |
BVN | Gold Industry | 100 | 32.50 | 3,250.00 | 10.83% | 76.30 | 7,630.00 | 25.43% |
DVN | Independent Oil and Gas | 40 | 74.13 | 2,965.20 | 9.88% | 102.72 | 4,108.80 | 13.70% |
ECA | Independent Oil and Gas | 50 | 58.98 | 2,949.00 | 9.83% | 76.21 | 3,810.50 | 12.70% |
GGB | Steel and Iron | 200 | 14.22 | 2,844.00 | 9.48% | 32.77 | 6,554.00 | 21.85% |
Total Percent | 99.90% |
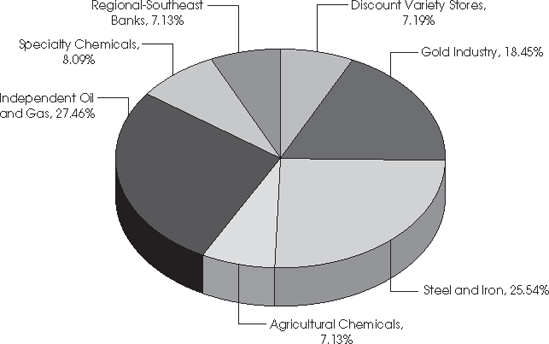
Now let's look at the same industry distribution, but instead of looking at what we paid for the stocks, let's look at the industry distribution based on each stock's current value. Figure 8.2 shows the value distribution represented in the Total Value column derived from the example portfolio shown in Table 8.2.
Hopefully, you can see that this portfolio is in even more trouble with regard to diversification. Independent Oil and Gas is still 8 percent overweight, and the Steel and Iron industry has jumped from about 20 percent to nearly 25 percent, which is 5 percent overweight.
The fact that the portfolio is growing is a good thing—it is, after all, what we want to have happen. But this growth has added a lot more risk to the portfolio by concentrating too much of your net worth in these two industries. A sudden downward change in investor sentiment in either of these industries could cost you a lot of lost profit. One of your goals is to gain and retain profits. This portfolio is now so badly diversified that you can only hope to get it back under control before something catastrophic happens in the market.
What do you do to fix this? The answer is simple: Just sell enough shares to get the total value of the portfolio by industry down to or below 20 percent per industry. What do you do with the cash generated from the sale of shares? Keep the cash in the portfolio for the time being or, if you can find suitable stocks in other industries, consider adding those stocks to the portfolio. Regardless of your actions, do not let any industry occupy more than 20 percent of your portfolio.
Now, let's turn our attention to the sector distribution. Take a look at Table 8.3, which is the same portfolio, but now you can see how the sectors are represented.
If you thought this portfolio needed work from an industry perspective, I hope you can readily see that there is a very serious problem in Table 8.3. Just look at how many positions are represented by the same sector: Basic Materials. The complete lack of diversification is obvious, but look at Figure 8.3 to really put this in perspective.
Nearly 80 percent of the basis in the portfolio (the amount you originally invested) is devoted to just one sector. This portfolio is extremely at risk of a potential market correction and a resulting huge loss in your net worth. It is critically important that this portfolio be rebuilt to where no more than 30 percent of the portfolio is devoted to any one sector.
Table 8.3. Example Portfolio—Sector View
Sector | Shares | Basis per Share | Total Basis | Pct by Basis | Current Price | Total Value | Pct by Value | |
|---|---|---|---|---|---|---|---|---|
GNA | Basic Materials | 750 | 12.90 | 3,096.00 | 10.32% | 14.99 | 3,597.60 | 11.99% |
AGU | Basic Materials | 40 | 65.10 | 2,604.00 | 8.68% | 73.77 | 2,950.80 | 9.84% |
APA | Basic Materials | 30 | 107.01 | 3,210.30 | 10.70% | 114.71 | 3,441.30 | 11.47% |
NEU | Basic Materials | 50 | 61.18 | 3,059.00 | 10.20% | 66.95 | 3,347.50 | 11.16% |
RNST | Financial | 140 | 21.47 | 3,005.80 | 10.02% | 21.06 | 2,948.40 | 9.83% |
WMT | Services | 60 | 49.78 | 2,986.80 | 9.96% | 49.59 | 2,975.40 | 9.92% |
BVN | Basic Materials | 100 | 32.50 | 3,250.00 | 10.83% | 76.30 | 7,630.00 | 25.43% |
DVN | Basic Materials | 40 | 74.13 | 2,965.20 | 9.88% | 102.72 | 4,108.80 | 13.70% |
ECA | Basic Materials | 50 | 58.98 | 2,949.00 | 9.83% | 76.21 | 3,810.50 | 12.70% |
GGB | Basic Materials | 200 | 14.22 | 2,844.00 | 9.48% | 32.77 | 6,554.00 | 21.85% |
Total Percent | 99.90% | 137.88% |


The distribution using the current value of all positions in the portfolio paints an even worse picture (see Figure 8.4).
What is the solution? Sell. Sell enough shares in the Basic Materials sector to bring the portfolio's commitment to Basic Materials to 30 percent or less. This may require that you sell out of some positions. This will also generate a significant amount of cash that you can use to buy other stocks. But in no case should any one sector occupy more than 30 percent of the total value of your portfolio.
The charts in Figures 8.5 and 8.6 are more in line with a good diversification strategy. In a 10-position portfolio, an industry chart should look like Figure 8.5.
The sector distribution chart should look more like Figure 8.6.

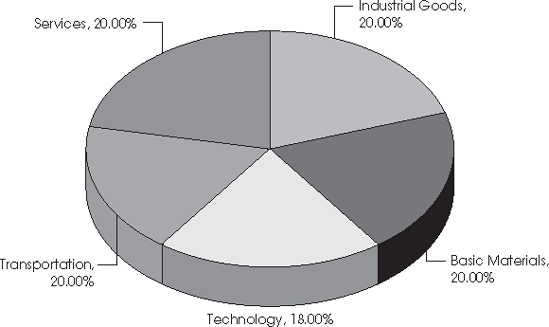
This means that when you are looking for that next stock to add to your portfolio, you must first check the percentage distribution of the current value of the portfolio by industry and by sector.
I hope this rule has prompted you to take a few minutes and actually examine the stocks in your portfolio. Perhaps you even went so far as to build a pie chart to see where your distribution of stocks actually falls. I am thinking that some of you are a little surprised at how your pie chart is divided. You may be saying to yourself right now, "Good grief! I need to make some adjustments." It will be more comforting to you once you have your stocks in a more even distribution. You will definitely sleep better at night.
I zealously stay diversified, and I sleep very well at night!
[14] The sector and industry naming convention is the standard designation provided by Interactive Data Corporation.