
In this rule, you will learn how to use pricing trends to tell you when to buy a stock. In Rules 1 and 2, you learned how to find the stocks that you should consider buying. In Rule 3, you will learn the first step in timing your purchase. This is the "When to Buy" rule.
If you are new to technical analysis or have never used technicals to make trading decisions, all you have to know is that to trade like a technician, you have to learn how to read charts.
Just as there are fundamental analysts, there are also technical analysts. These two camps have a certain distain for one another. Fundamental analysts don't believe in charting. They don't believe in the concept of telling the future by looking at the past. And technical analysts believe that fundamental analysts are out of touch with reality. They say that regardless of the fundamentals, the pricing trend could go lower or higher. Technicians want to buy on the way up and sell on the way down, regardless of the fundamentals.
I believe you have to look at both the fundamentals and the technical aspects of any stock you are about to buy or sell. You will gain insight in both approaches that significantly outweigh just using one or the other. The whole, in this case, is far more valuable than the sum of the parts.
This rule focuses on the technical aspect of stock selection.
Perhaps you already consider yourself an accomplished "technician." That is great! Some of this rule will be somewhat remedial for you, but not all of it. I use a technical approach to charting stocks that you likely will not have seen before. It is not complicated, but it has an uncanny ability to time when to buy and when to sell short. Even if you have used technicals in your stock investment methodology for years, you should read this rule. It is likely that regardless of how much you know about reading charts, trends, oscillators, patterns and triggers, you still need this rule.
But if you have never stepped foot into the technical waters, we will cover the elementary components of technical trading so you won't be left out. In Rule 10, which is the rule on timing the market, we will take this process to a whole new level of sophistication and understanding. Don't jump ahead, though. This book is meant to be read from the front to the back—one rule at a time.
I know you just spent the last two rules learning why fundamentals matter. Now, as we move on to why technicals matter, I want to make sure you are not confused.
I don't believe that fundamental analysis and technical analysis methodologies are mutually exclusive. Indeed, I believe that one without the other is like trying to swim with one arm while letting the other arm hang by your side. It is possible to swim with one arm, but it is very difficult. However, making stock investment decisions based on both a fundamental and a technical analysis is much like watching a champion swimmer, with both arms used to propel the swimmer forward. Indeed, swimming with two arms is far more efficient and effective than just doubling the success of swimming with one arm. Likewise, using both fundamentals and technicals, the stock market investor has the best chance of being more efficient and effective at generating significant and consistent profits.
With regard to technical analysis, I believe in "keeping it simple." My technical analysis methodology is simple but powerful. It is something you can actually use without spending hours and hours of studying and screening and doing what-if scenarios.
As we go through them, you will learn:
The basic theory of technical analysis.
How to build a simple but powerful trend line.
How to determine what triggers a buy and what triggers a sell short, from a technical perspective.
All technical analysts have one simple objective: to determine whether a stock's price is going to move up or down in the future based on how that stock's price has moved in the past. It doesn't matter which technical system you learn or which technical charts you follow. In the end, your goal will be the same as all other technicians: you want to figure out the pricing trend of a stock. Will that trend be down so that a short trade makes sense? Or will that trend be up so that a long trade makes sense? Will the stock stop moving higher so that it can be sold at or near its top? Or will the stock stop moving lower so that it can be covered at or near its bottom?
There are many types of technical analysis systems, including:
Accumulation/distribution index: A momentum indicator that tries to gauge supply and demand by discovering if investors are generally "accumulating" (buying) or "distributing" (selling) a certain stock by identifying divergences between stock price and volume flow.
Average true range: A technical analysis indicator developed by J. Welles Wilder, based on trading ranges smoothed by an N-day exponential moving average (EMA).
Bollinger bands: Developed by John Bollinger, Bollinger bands (lines) are plotted above and below the 21-day moving average of a stock's price. These upper and lower boundaries factor in two standard deviations (about 95 percent) of the price movement over the previous 21 days.
Breakout: A chart pattern used to indicate a rise in a stock's price above its resistance level (such as its previous high price) or a drop below its support level (commonly the last lowest price).
The Dahl theory: The primary theory used in this book for technical analysis wherein a stock's pricing trend is determined by how its week-ending closing price crosses a 10-week moving average of week-ending closing prices, with this trendline shifted forward in time by three weeks.
Hikkake pattern: A technical analysis pattern used for determining market turning points and continuations. It is a simple pattern that can be observed in market price data, using traditional bar charts, or Japanese candlestick charts. The pattern is comprised of a measurable period of rest and volatility contraction in the market, followed by a relatively brief price move that encourages unsuspecting traders and investors to adopt a false assumption regarding the likely future direction of price.
Moving average convergence/divergence (MACD): A technical analysis indicator created by Gerald Appel in the 1960s. It shows the difference between a fast and slow EMA of closing prices.
Momentum and rate of change: Simple technical analysis indicators showing the difference between today's closing price and the close N days ago.
Money flow in technical analysis: Typical price multiplied by volume, a kind of approximation to the dollar value of a day's trading.
On-balance volume: A measure of volume distinguished as to whether trades take place on rising prices or on falling prices. Technical analysts consider great volume on rising prices bullish because it indicates the possibility that large traders are accumulating investment positions in a security.
Price activity (PAC) charts: PAC charts are unique in the way they represent "volume" (the number of shares traded every day), where compound estimated volume data at each price level is plotted and color-coded.
Parabolic stop and reverse (SAR): A method devised by J. Welles Wilder Jr., to find trends in market prices or securities. The concept draws on the idea that time is an enemy, and unless a security can continue to generate more profits over time, it should be liquidated.
Pivot point: A means to calculate resistance and support levels, which are, in turn, used as visual cues to execute trades. Pivot point calculations provide traders with objective visual benchmarks, which some use to predict price changes.
Point and figure charts: Show trends in price by, in theory, filtering out the "noise" (unimportant price movement) and focus on the main direction of the price trend and are used for longer-term price movements.
Relative strength index: Developed by J. Welles Wilder, it is a financial technical analysis oscillator that shows price strength by comparing upward and downward close-to-close movements.
Rahul Mohindar oscillator (RMO): A type of technical analysis developed by Rahul Mohindar of Viratech India, which detects trends in financial markets and is designed to work on open-high-low-close charts.
Stochastic oscillator: A momentum indicator, introduced by George Lane in the 1950s, to compare the closing price of a commodity to its price range over a given time span.
Trix oscillator: Shows the slope (i.e., derivative) of a triple-smoothed exponential moving average. The name trix is from "triple exponential." It was developed in the 1980s by Jack Hutson, editor of Technical Analysis of Stocks and Commodities magazine.
Williams %R oscillator: Developed by Larry Williams, it is a technical analysis oscillator that shows the current closing price in relation to the high and low of the past N days (for a given N).
Don't be daunted by the idea of learning to read charts. If you have never attempted to follow or even understand the concept of technical analysis, reading and studying this rule will turn you into an excellent stock technician.

Figure 3.1 shows a simple technical chart[12] of AAPL (Apple, Inc.).
This is an easy chart to read, and as we move further into the book, the charts don't get much more complicated.
The black line (Circle A) is just a 10-week moving average trend line.
This moving average is based on the average of the 10 most recent week-ending closing prices of a stock. The only complicated thing I do with this trend line is slide it from left to right three weeks. This "time-shifted" trend line has proven to provide a better basis from which to judge when a stock is in an uptrend or a downtrend. You can use any trend line that you like.
The other line in Figure 3.1 is the week-ending closing price of the stock (see Circle B). You will note, from the legend on the chart, the week-ending price line can be "out," "short," or "long." Here's what this means:
When the week-ending price line (see Circle B) is black, it means that there is not enough of a directional movement in the price line to determine if it is trending higher or lower. When the line is black, it means:
You should not buy the stock.
You should not sell the stock short.
If you own the stock, you should sell it.
If you are short the stock, you should cover it.
When the pricing line is above the trend line and changes from black to light gray, it is your signal that the stock has likely moved into a trend from lower left to upper right and that it is also likely that this upward sloping trend will continue for some time. This is a good time to buy the stock.
When the pricing line is below the trend line and changes from black to light gray, it is your signal that the stock has likely moved into a trend from upper left to lower right and that it is also likely that this downward sloping trend will continue for some time. This is a good time to short the stock.
There are many nuances to technical charts, and we will get into some of the more important nuances in Rule 10. But, the concept is no more complicated than this: You will time when you buy and when you sell short by watching how the price of a stock moves above or below a moving average trend line.
When the stock's price moves above the trend line, you buy.
When the stock's price moves below the trend line, you sell short.
It doesn't get a lot more complicated than that. But there is one thing that I must hasten to add at this point:
You don't have enough information to start buying and shorting yet. This is just Rule 3. You must put all 10 rules in your investment methodology before jumping into the market. It would be a big mistake for you to chart a few stocks, slap on a trend line, and start buying and shorting. Please wait until you have finished this book before putting any of these rules to work.
I use stock charts to tell me when to get in the market (buy or short), but I use what I call my "Intelligent Stop Loss®" formula, which is registered with the U.S. Patent Office, to tell me when to get out. You will learn all about the Intelligent Stop Loss® formula in Rule 4.
The objective of every technical chart of every technical system ever created is to achieve the following goal: to tell you the difference between normal volatility and a change in direction of a stock's trend line.
Every investor wants to buy stocks that are trending higher in market price, and for stocks that are trending lower in market price, investors will either sell their long positions or sell short.
It doesn't matter what technical system you use; your goal will be to know the difference between normal volatility and a change in the overall direction of the stock's market price.
Remember: Never buy a stock unless it is supported by both technical and fundamental buy signals.
As I mentioned earlier, you can use any technical system you want, but you must use one. A little earlier in this rule, you learned how to read a very simple chart of AAPL. You learned about a moving average and what to do when a stock's price moved above or below the moving average trend line.
Take a look at the chart in Figure 3.2. This is an expanded set of charts all pertaining to AAPL.
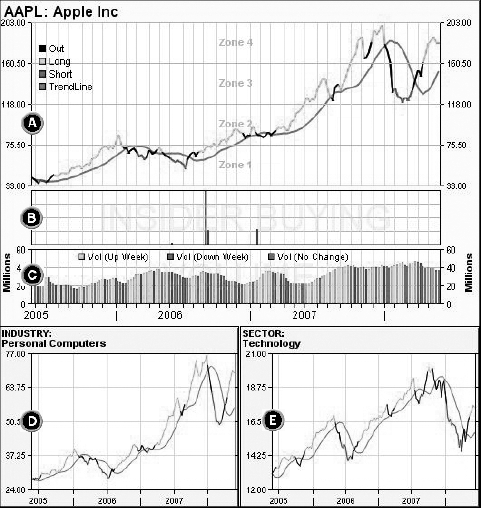
You will notice that the main (upper) chart is a three-year chart of Apple just like the chart you saw in Figure 3.1. There is a lot of information in Figure 3.2, including:
Main chart (see Circle A)
On this chart, you can see the week-ending market price of AAPL, including the 10-week moving average (trend line). This chart gives you an easy-to-read indication of whether you should own the stock, have a short position in the stock, or have no position in the stock at all. As you learned earlier in this rule, depending on whether the stock's week-ending price is above the trend line or below it, you will immediately know if you should have any position in the stock. If the week-ending share price is sufficiently above the trend line, it is okay to own the stock. If the week-ending share price is sufficiently below the trend line, it is okay to short the stock. If the week-ending share price is not sufficiently above or below the trend line, then you should not be long or short the stock. The indicators are:
Out: This means you should have no position in the stock and the price line is black.
Long: This means the chart supports you holding a long position in the stock. When the price line moves from black to gray and is above the trend line, the chart is giving a "buy signal."
Short: This means the chart supports you holding a short position in the stock. When the price line moves from black to gray and is below the trend line, the chart is giving a "sell short signal."
There are four zones. These zones are nothing more than the difference between the stock's lifetime highest share price and the stock's lifetime lowest share price, adjusted for splits. The purpose of the zones is to give you an idea of how much risk you might want to make in a stock, as follows:
It is not a good idea to short a stock in the lower half of Zone 1. This is because the stock is very near its lifetime lowest low and it is less likely that it will, in the near future, start making lower lifetime lows.
You have the greatest potential for return if you buy a stock that is giving a buy signal as it moves out of Zone 1 into Zone 2. This is because the stock has already demonstrated that it can trade at the top of Zone 4, so its potential for growth is greater in Zone 1, 2, or 3 than in Zone 4 (with the following caveat).
Winners tend to win. Stocks that give buy signals in the upper half of Zone 4 tend to move higher making new lifetime highest highs. In upward trending markets (see Rule 10), buying stocks that are giving buy signals in the upper half of Zone 4 can produce exceptional returns.
You will learn more about insider buying in Rule 6.
This chart does not have an enumerated y-axis, which means the vertical black bars are relative only. The total number of shares being bought by insiders is not nearly as important as knowing if there is increasing or decreasing amounts of insider buying.
Weekly trading volume (see Circle C): Watching the total trading volume of a stock can tell you a lot of information about the strength or weakness of the stock's market pricing trend. I use a 10-week moving average volume on this chart. The details on this chart are:
The black vertical bars are "up volume," which tells you that the stock's market price is increasing as the trade volume of shares increases. You can infer from this action that the market likes this stock and it is likely that more investors are buying more shares. At the very least, you know that more shares are being traded at increasing market prices.
The light gray vertical bars are "down volume," which tells you that the stock's market price is decreasing as the trade volume of shares decreases. You can infer from this action that the market is not as enamored with the stock at that time, as more investors are selling more shares. At the very least, you know that more shares are being traded as the stock's market price is decreasing.
Industry chart (see Circle D): There is no better gauge of how strong a stock's pricing trend is than by knowing how a particular stock's "market" is moving. The two best indicators of how bullish or bearish the market is, with regard to a specific stock, are its industry and sector (more on sector later). The industry chart is a chart of the average market price of every stock in a particular stock's industry. In this case, with AAPL, the industry is "personal computers." This industry chart includes:
A 10-week moving average trend line, which charts the average week-ending closing price of all the stocks in the personal computers industry.
If the average price of every stock in the industry is above the trend line, the industry is considered in "bull mode." This means that more money is flowing into this industry than out of it. It means that more investors have a positive opinion of this industry than a negative opinion. In a "rising-tide-lifts-all-boats" environment, a stock that has strong Demand Fundamentals and is in a technical buy mode, and has its industry and sector in bull mode, you should draw the conclusion that there is a lot of pressure on your stock's market price to move higher. This is the exact scenario that you must look for in your technical analysis.
Sector chart (see Circle E): Although I put more emphasis on a stock's industry bull or bear mode condition, certainly it is a major positive when both the stock's industry and sector are bull mode. In Figure 3.2, Circle E, you can see AAPL's sector chart. The sector chart is a chart of the average market price of every stock in the stock's sector. In this case, AAPL's sector is "technology." This sector chart includes:
A 10-week moving average trend line, which charts the average week-ending closing price of all the stocks in the technology sector.
If the average price of every stock in the sector is above the trend line, the sector is considered in "bull mode." This means that more money is flowing into this sector than out of it. It means that more investors have a positive opinion of this sector.
By looking at Figure 3.3, you get information telling you when to get into a stock for either a long or a short trade. You also can use this chart to help you determine your exit strategy (more on this later).

When a stock's week-ending closing price moves above the trend line, the stock has given a technical buy signal. When the week-ending closing price moves below the trend line, the stock has given a technical short sell signal.
I use a stop loss strategy (The Intelligent Stop Loss® strategy, which will be covered in Rule 4) to tell me when to sell a long position or cover a short position. When a stock triggers its stop loss setting, the color-coding on the market price line turns black. This signifies that no trend has been sufficiently established and the stock should not be owned or shorted.
I realize all of this can be a bit overwhelming, especially since these charts cannot be easily reproduced without a program designed and written specifically for this technical strategy. However, you can get very close to this same concept by using a standard 50-day moving average and Bollinger bands set at a 50-day time period and utilizing one standard deviation. Of course, all of these charts are available for free on my web site.
So, the actual concept is very simple:
You execute a buy or short sell when the weekending price of the stock crosses the trend line. You buy when it crosses the trend line moving up and you short when it crosses the trend line moving down.
You sell when the stock's price reaches the stop loss price.
Allow me to summarize to this point. In Rule 1, you learned how to pick the stocks that you would consider buying if the timing was right. In Rule 2, you learned how to spend your money wisely when buying a stock. And here, in Rule 3, you are learning how to know when it is the right time to buy one of the stocks you have selected in Rules 1 and 2. You should consider buying a stock only if it has strong Demand Fundamentals and its price has moved above the trend line.
As you develop your trading and investment strategy, you have to make very singular decisions (buy, sell, sell short, cover) from a plethora of inputs. These 10 rules provide you with an easy-to-follow road map that simply and effectively navigates your decision-making process through a maze of data to a decision that you can believe in and that will give you confidence in your stock selections.
As investors, we are inundated with information. The vast amount of information spewing from the Internet, TV, radio, newspapers, analysts, company financial reports, and the like is indeed mind-boggling. Buried within that mountain of data is the knowledge that we seek. The knowledge that we want is: what to buy; when to buy; and, most importantly, when to sell.
If you master these 10 rules, you will learn how to emotionally distance yourself from the minute-by-minute, hour-by-hour, or day-by-day vagaries of the market. You will learn how to rapidly turn overwhelming amounts of information into a few wonderful and critically important nuggets of knowledge.
For example: If the market is up 200 points on Monday and down 300 points on Tuesday, then back up 50 points on Wednesday, such whipsaws and volatility in the market can overwhelm your emotions. One day, you think you should be in the market; the next day, you think you should be out, only to reverse that thinking again the following day.
I consider the cacophony of information and the volatility of the market during the week as just so much "noise." Making investment decisions in the din of so much market noise invariably leads to mistakes.
A far better approach is to let the markets close for the week, gather your data, and then, in the relative peace and quiet of the weekend when the market sleeps a couple of days, take a deep breath and make your trading decisions. Look at the week's market activity from the perspective of the weekend.
When determining trends, it is extremely important to remove noise from your decision making. Noise can drown out important considerations. Noise can be the news, analyst upgrades and downgrades, talking heads on TV, geopolitical events, and a host of other distracting information. Noise can also be a part of your data, in the form of outliers and volatility. It is important to reduce and/or eliminate as much noise from your analysis as possible.
It doesn't matter that much what happened day to day; what really matters is how each stock's price changed from end of week to end of week.
I want you to get away from watching too much stock market news. Turn the TV off. Follow these rules and then spend more time doing things other than worrying about buying and selling stocks.
In these 10 rules, you are going to learn how to build a world-class stock portfolio and make all your trades and set all the upcoming week's exit strategies in a couple of hours on the weekend. The rest of your life should be devoted to more important activities than the stock market.
Depending on the technical system that you follow, reading and understanding technical charts can be more than a bit difficult. You saw that long list of methodologies espoused by different theorists, and that is a list of only the most recognized ones. Frankly, I have never seen a complex technical system provide any significant increase in net total return over what you get from simple technical methodologies. In fact, I have seen just the opposite. Often, the simpler the technical approach, the more easily you can detect strong trading signals. The better the trading signals, the more profit you will move to the bottom line.
Now, let's move back to the chart in Figure 3.2 on AAPL. I want you to pay close attention to the three circled letters on the chart.
At Circle A, the stock's price began moving up toward the trend line. A couple of weeks later, the stock crossed the trend line, which triggered a buy signal. Immediately after buying the stock at Circle A, it is critically important to set your stop loss order. We will discuss how to calculate and set your stop loss prices in Rule 4.
You would continue to own AAPL until Circle B. At that point, the stock's market price dropped enough to trigger the stop loss and you sold.
Then, about three weeks later you bought AAPL again, when it once again moved back up above the trend line. Then, you held onto your position until the stock once again triggered its stop loss setting at Circle C.
In this way, you "stair-step" your way along with the stock as it moves higher and higher in price. But you avoid the catastrophic collapses (note the sell-off just to the right of Circle C) through the judicious use of stop loss settings.
With the 10 Essential Rules, you will not be buying at the bottom and selling at the top. Rather, you will be buying near the bottom and selling near the top. Attempting to buy at the bottom is like trying to catch a falling knife. Most of the time you will get "cut" (lose a lot of money), and, therefore, you should try to avoid the habit of trying to buy at the bottom.
In this example, you would have bought the stock at Circle A for about $80 per share and sold it at Circle B for about $120 per share. This is a $40 per share gain in about five months. That is about a 50 percent net gain, which annualizes to more than 120 percent. Then, from Circle B to Circle C, you made another $40 per share in just over two months for a net gain of 33 percent and an annualized return of almost 200 percent!
The point to all of this is that these are profoundly powerful charts that can give you an excellent indication of when to buy and when to short. Of course, you want to buy only fundamentally strong stocks, but the timing of your buying and selling is how you make consistently significant profits in the stock market! I know it works. I've done it. And you can, too!
[12] The author does not make any representations or warrants as to the accuracy of the charts in this book. The reader should consider these charts as examples only and not infer any suggestions from the author that any of the equities so referenced should be purchased. The charts and/or commentary on any equities should not be considered as a recommendation to acquire or divest shares of the stocks and/or companies referenced.