
Chapter 1
Net promoter score (NPS)
- Why: To better understand customer satisfaction
- What: To measure how satisfied your customers are
- When: When customer satisfaction, repeat customers and positive recommendations matter
- The question this indicator helps you to answer: to what extent would customers recommend our company to their friends?
Why does this KPI matter?
Understanding how satisfied and therefore how loyal your customers might be is important for any company because happy and returning customers are likely to grow future revenues and profits.
The problem is that most customer surveys are complex, expensive and hard to interpret. In response to this, the net promoter score (NPS) was developed as ‘the one number you need to know’ based on just one simple question: How likely is it that you would recommend [company X or product Y or service Z] to a friend or colleague?
The NPS is based on the fundamental premise that every company’s customers can be divided into three groups:
- Promoters
- Passives
- Detractors.
This allows an organisation to track these groups and get a clear measure of their performance through its customers’ eyes. Moreover, and of critical importance, empirical research has shown that there is a striking correlation between the customer’s grouping and actual behaviour – repeat purchase and referral patterns – over time.
Further research mapped the growth rates of companies with high NPS scores and in comparison to their competitors. The results were striking. In most industries, this one simple statistic explained much of the variation in relative growth rates: that is, companies with a better ratio of Promoters to Detractors tend to grow more rapidly than competitors.
Developed by (and a registered trademark of) Fred Reichheld, Bain & Company and Satmetrix, the NPS is a straightforward metric that holds companies and employees accountable for how they treat customers. When combined with appropriate diagnostics and follow-up actions, it drives improvements in customer loyalty and enables profitable growth.
How do I measure it?
How do I collect the data?
NPS is collected using a survey (mail-based, online or conducted by phone). The best NPS practitioners collect the measurement in two ways:
- Execute a top-down NPS. Set up an anonymous survey and contact existing customers to ask the NPS question – rating the overall customer/company relationship. At the same time, ask customers about the scores they would give to your competitors. This will enable a simple and direct comparison of performance through the eyes of the customer.
- Measure NPS around transactions that are most vital (transactional NPS). Measure at a key customer touchpoint for a measurement that offers feedback on operational perform-ance at that key moment of truth.
What formula do I use?
Using a 0 to 10 scale, an organisation can calculate its NPS by taking the percentage of Promoters and subtracting the percentage of Detractors.
- Promoters (score 9–10) are loyal enthusiasts who will keep buying and refer others, fuelling growth.
- Passives (score 7–8) are satisfied but unenthusiastic customers who are vulnerable to competitive offerings.
- Detractors (score 0–6) are unhappy customers who can damage your brand and impede growth through negative word-of-mouth.
To calculate the NPS, take the percentage of customers who are Promoters (those who scored between 9 and 10) and subtract the percentage who are Detractors (those who scored between 0 and 6). See Figure 1.1.

How often do I measure it?
Most companies don’t collect customer data frequently enough. Instead of the ‘big’ annual customer survey, companies can use this simple one-question approach to collect data more frequently. A good idea is to collect data on NPS continuously, or at least monthly from a subset of your customers (e.g. 10% of customers). This way, you can get trends and avoid drawing conclusions on biased or outdated data.
Where do I find the data?
The data for your NPS come from surveying your existing customers.
How difficult or costly is it to measure?
The simple nature of this KPI makes it more cost efficient than more traditional customer satisfaction surveys. However, as with any customer satisfaction survey, costs can be significant. Costs are particularly high for hard copy and mail surveys. A way to reduce costs is to automate data collection.
How do I set targets for this KPI?
Here are some benchmarks from the NPS leader table compiled by Satmetrix:
Table 1.1 2011 Net promoter industry reports for the USA and the UK
| NPS leaders – USA 2011 | NPS leaders – UK 2011 | ||
| Company | NPS | Company | NPS |
| USAA – banking | 87% | Apple – computer hardware | 67% |
| Trader Joe’s – grocery | 82% | First Direct – banking | 61% |
| Wegmans – grocery | 78% | LG – television | 39% |
| Costco – department store and wholesale | 77% | Samsung – television | 35% |
| Apple – computer hardware | 72% | Sony – computer hardware | 30% |
Source: Satmetrix
Practical example
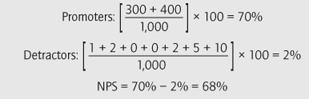
We can look at this simple calculation example. A company surveyed 1,000 customers with the question: ‘How likely would you be to recommend the product from this company to a friend?’ Respondents can then score their reply on a 0–10 scale (0 = not at all likely, 5 = neutral, 10 = extremely likely). Here is a breakdown of the replies:
| Score | Counts |
| 0 | 1 |
| 1 | 2 |
| 2 | 0 |
| 3 | 0 |
| 4 | 2 |
| 5 | 5 |
| 6 | 10 |
| 7 | 110 |
| 8 | 170 |
| 9 | 400 |
| 10 | 300 |
The NPS is therefore:
Some tips and traps to consider
The NPS will give a nice, simple number; however, what it won’t give you are the reasons why customers would or would not recommend you or your products or services. A very powerful supplement to the single-question survey is a set of open questions along the following lines:
- What do you particularly like about this company/product?
- What or which areas could be improved?
This way, the company will get insight not only into how many customers are Promoters versus Detractors but also into the areas that need to be improved. Take this example from the Canada-based online retailer Zappos. The NPS survey is administered in two different situations: 1) after an order; 2) after a customer speaks with a customer loyalty representative.
Zappos online questions ask the NPS (on the 0–10 scale): ‘How likely are you to recommend Zappos to a friend or a family member?’
However, to gain further information that would help the company move its customers who are Detractors or Passive to Promoters status, Zappos also asks the customer: ‘If you had to name one thing that we could improve upon, what would that be?’
Moreover, following the interaction with the customer loyalty representative (and again on the 0–10 scale) the customer is asked: ‘If you had your own company that was focused upon service, how likely would you be to hire this person to work for you?’ Further questions ask ‘Overall, would you describe the service you received from (insert name of customer loyalty representative) as good, bad or fantastic?’ and ‘What exactly stood out as being good or bad about this service?’
As a point of warning, people highlight the fact that the NPS methodology lacks statistical integrity because grouping the responses into just three categories causes the error interval to multiply nine-fold. It might be that the NPS oversimplifies the scoring a little and companies might be better off looking at the actual breakdown of answers from the 10-point scale and their changes over time.
Further reading and references
Net promoter is a customer loyalty metric developed by (and a registered trademark of) Fred Reichheld, Bain & Company, and Satmetrix.
Frederick F. Reichheld, The one number you need to grow, Harvard Business Review, December 2003.
Fred Reichheld, The Ultimate Question: Driving Good Profits and True Growth, Boston, MA: Harvard Business School Press, 2006.