
Appendix C
Research Methodology, Timeline, and Tools
Research Methodology
The Measures of Success Task Force began its work in early 2003. First on the agenda was generating the list of great associations from which both the study and comparison groups would be drawn. In Good to Great, Jim Collins had used stock price to determine which companies made the cut for his study. This objective measure has no equivalent in the association sector. Therefore, the task force followed the jurying process that Collins and Jerry Porras had employed when researching Built to Last.
The American Society of Association Executives (ASAE) generated a random, nth-name sample of 1,000 CEOs, number-two executives, and industry leaders within its membership database. These executives received an explanatory letter and a request to nominate, in rank order, their choices for the top five associations in the country. Two follow-up mailings and a reminder postcard contributed to a response rate of 32 percent; this represents a 95 percent confidence level for sampling error.
The list generated by the survey respondents numbered 506 associations. The top 104 associations—those mentioned most frequently by respondents—received invitations to participate in the Measures of Success project, along with a request for preliminary data related to finances, membership, leadership, and organizing structure. Of the 51 associations that responded to this initial mailing (a 49 percent response rate), 82 percent indicated their interest in participating. Any association with a close connection to the project, such as a staff member serving on the task force, was disqualified from consideration.
While the survey was in progress, The Center for Association Leadership hired two full-time research investigators, both recent college graduates. Collins had suggested taking this approach to getting much of the work done because he has employed it himself. In Collins’ view, recent graduates are accustomed to working hard and typically bring an active curiosity to digging through data to unearth nuggets of valuable information. In fact, he praised his research investigators for being “chimps”—a reference to Curious George, the fictitious character in children’s storybooks, whose insatiable urge to discover more about the world led to many adventures.
Also with guidance from Collins, task force members developed criteria to apply to the potential participants and identified the period of study as the 15 years preceding and including 2003. The criteria were selected to reduce the likelihood that any findings of the study could be attributed to a particular characteristic or circumstance, such as a CEO with tenure over the entire span of the study, or an anomaly, such as an economic downturn within the association’s trade or profession.
To be eligible for consideration for either the study or comparison groups an association needed to have:
- Been in operation for at least 20 years;
- Finished more years in the black than in the red;
- Exhibited the ability to retain members, donors, or market share during the study period; and
- Had more than one CEO during the study period.
In addition to meeting these criteria, an association had to be willing to fully cooperate in the research process. That meant providing detailed, often confidential, financial and membership information; submitting reams of paper, including publications, annual reports, and meeting minutes; hosting site visits; and answering numerous questions about its policies, procedures, and internal operations.
This cooperation on the part of the research subjects marks one area of departure from Collins’ work. Where he had access to public documents detailing financial performance, for example, the task force relied on the associations’ cooperation to provide the data. Collins conducted his research with the full awareness, if not the cooperation, of the companies being studied; the Measures of Success Task Force needed associations to provide both.
Another limitation to participation was an association’s ability to provide the appropriate data. Several associations, despite their desire to participate, had to withdraw from the study because they either did not have the staff resources necessary to generate all the data requested or did not have complete data for the full study period. Other groups were excused from the study because the task force was unable to find suitable associations to form a matched pair.
Making the Lists
Once the research investigators had gathered preliminary data for review, the task force began the process of selecting which organizations to study in depth. The intent was to include all types of organizations (trade, professional, philanthropic), reflect various geographic scopes (state, national, international), and represent various membership sizes (small, medium, large).
Several associations immediately stood out as having performed consistently in the black and having maintained a consistent member/donor base during the study period; in addition, all had received frequent mentions by the ASAE members who participated in the jurying process. These became candidates for the study group of remarkable associations.
Ultimately, the study group was composed of these nine organizations (see Appendix A for organizational profiles):
- AARP
- American College of Cardiology
- American Dental Association
- Associated General Contractors of America
- Girl Scouts of the USA
- National Association of Counties
- Ohio Society of Certified Public Accountants
- Radiological Society of North America
- Society for Human Resource Management
To identify suitable candidates for the comparison group, the task force looked for associations that were similar to the study group in terms of budget and staff size, type (such as individual membership organization), and geographic scope. Whenever possible, efforts were made to match organizations that had similar missions or served similar memberships.
For the most part, the task force selected the nine members of the comparison group from the list of 105 organizations generated by the jurying process. In two instances, the task force cast its net wider to locate a better match for a study group.
The major differences between the study and comparison groups rested with their respective performances on the selection criteria, primarily those related to financial health and membership retention. In other words, associations in the comparison group were similar in all major respects to their counterparts in the study group, except that they had experienced fewer years in the black and/or had higher membership attrition rates.
All the associations studied—no matter which group they were placed in—were strong performers. The aim of the Measures of Success project was to compare remarkable and good associations, not good and bad ones. The project’s value lies in discerning the often subtle differences between two well-matched organizations—what one association did or didn’t do to give it a performance or financial edge on its counterpart.
Data Gathering and Analysis
Having placed 18 organizations into nine matched pairs, the task force outlined the areas for comparison and analysis. Once again drawing on the methodology employed by Collins and Porras in Built to Last, the task force selected 11 variables to identify differences among groups:
The Center for Association Leadership partnered with a specialist in behavioral research who guided the development of both a process and a set of tools that included multiple data inputs, in multiple formats. We structured the process and the instruments together. This ensured they were consistent in focus and could be related to one another, with the variables serving as a least common denominator, even though the nature of the information differed (structured, quantitative versus open-ended, qualitative).
In both design and implementation, we adhered to a high professional standard for conducting behavioral research that involves collecting data of multiple types, through multiple media, then testing them against the hypotheses developed at the outset. In other words, we tested to see which variables were most closely associated with sustained, outstanding organizational performance.
The task force employed the following process:
The two research investigators conducted a field test of the interview questions at four associations that had representation on the task force. Feedback from these test experiences led to revisions in the structured interview process.
Armed with data-gathering instruments, including checklists and lists of questions, the research investigators conducted on-site interviews at the nine organizations in the study group and the nine organizations in the comparison group. In all cases, they spoke with the CEO; other interviewees typically included senior and support staff representing a range of tenure at the association. These interviews were transcribed and attached to the detailed report prepared for each of the 18 associations.
In addition, each participating organization submitted, on average, three large boxes of documents—financial statements, 990 forms, annual reports, examples of products, publications, marketing plans, results of membership surveys, minutes of board meetings, and so forth. The research investigators used the financial data to generate charts and graphs that provided a historical perspective of net revenue, net profitability, ratio of net assets to total expenses, membership attrition, and level of reserves.
Once this data-gathering process concluded, the material needed to be reviewed through the eyes of association professionals. At this point, two task force members were assigned to each matched pair and given the task of studying the financial data, written reports, interview transcripts, and all the materials submitted by the associations. The two task force members in each pairing became, in essence, experts on their two assigned groups. Each of these teams made at least one visit to ASAE’s headquarters, where the submitted materials were kept to maintain confidentiality. (All members of the task force and others involved in the research process signed confidentiality agreements.)
To guide the evaluation teams through the massive amounts of information collected, Collins offered a framework for analysis. He posed three questions that became the basis of each team’s approach to formulating conclusions about the data:
- What did you find that ran counter to conventional wisdom?
- What did all the organizations have in common? In other words, what are the necessities for any organization to be considered good?
- What major factors accounted for the differences between the study and comparison groups?
After compiling an extensive list of conventional wisdoms related to association management (see Appendix D) and discussing the other two questions, the task force realized some necessary information was still missing. One representative from each team agreed to conduct a follow-up, on-site visit, including an interview with each CEO, to fill in the gaps and to get a better feel for each organization’s culture and physical setting. A structured set of interview questions was developed to ensure that each team member asked the same questions, in the same order.
After completing the supplemental data collection, each team member wrote an individual dossier that analyzed the similarities and differences between the two groups. Next, the two members of each team pooled their thoughts and prepared one team dossier for distribution to the other task force members.
In January 2006, the task force convened to review all nine dossiers. This book presents the results of the discussions and debates that the task force engaged in to identify commonalities and differences across the groups and to put conventional wisdoms to the test.
Probability Versus Proof
Contrary to popular opinion, science does not deal with proof. Rather, it deals with prediction. The purpose of scientific research is to explain relationships and then predict the outcome of future events based on observation of the data.
Rarely can you say with certainty that one particular event or action causes a particular outcome. Usually, an outcome is caused by a combination of several variables acting together. Understanding the relationship among the variables enables you to predict outcomes.
For example, some critics have noted that research has never proven that smoking causes cancer. It takes only one exception to the hypothesis to disprove it: one smoker who never develops cancer. But researchers have demonstrated that people who smoke are more likely to develop cancer than those who do not smoke.
Moreover, people with a family history of cancer have a greater likelihood of developing the disease, compared to those without that history. When these two factors—family history and smoking—are combined, the chances of developing cancer increase even more. You can predict, with a higher level of confidence, the likelihood of cancer.
The Measures of Success Task Force wanted to identify the factors remarkable organizations had in common, as distinct from the comparison group. To what degree any of these caused an association to be remarkable was outside the scope of the study. But by identifying the measures related to remarkable organizations, we could developed a means for predicting the likelihood that other organizations which possess the same attributes may also become remarkable.
To identify predictors of remarkable associations, we used a 2×2 analysis table. Suppose, for example, you wanted to determine if eye color is related to hair color. If you have 10 people with blond hair and 10 with brown hair, the 2×2 analysis table might look like this:
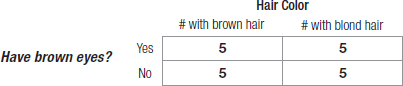
By pure chance alone, you’d expect that each cell would contain five individuals. In that case, you’d conclude that there is no relationship between the color of hair and the color of eyes. If, however, the majority of brown-haired people have brown eyes and the majority of blond-haired people do not, you’d conclude that there is a relationship between hair color and eye color.
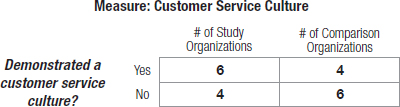
We used the same logic to determine which factors, if any, were related to remarkable associations. For each measure—for example, a customer service culture—we asked if it were observed in both the study and the comparison groups. Based on pure chance, you’d expect that half of the organizations in both groups would exhibit a certain factor and half would not. In such a case, there would be no relationship between a certain measure and remarkable associations. If, however, the distribution was greater than expected by chance, it would point to a relationship.
Measures observed in at least six or more of the study group and not observed in fewer than six in the comparison group were determined to be characteristics of the remarkable group but not characteristics of the comparison group. To meet our criterion, the 2×2 table for any measure had to appear, at a minimum, like the sample below.
This logic formed the basis for the identification of research results. Any factor displayed by a majority of the study group, but not displayed by a majority of the comparison group, was selected. It is also important to note that several variables may exist beyond those we identified. Nevertheless, these seven measures of success are unique among the study group and, therefore, are associated with remarkable associations.
In all cases, the team dossiers confirmed that all 18 organizations had been placed in the appropriate group, whether study or comparison. For all nine pairings, the associations in the study group outperformed their counterparts in the comparison group in a majority of areas. That’s not to say there weren’t bright spots among the comparison group; in fact, in several instances, those associations performed almost as well as their counterparts in the study group.
The task force’s discussions uncovered both positive and negative correlations within and among the study and comparison groups. Again and again, the task force revisited these correlations, some of which withstood repeated scrutiny. Others did not, either because they were not present in a majority of the pairings or because the evidence was not overwhelming enough to substantiate them. Likewise, some conventional wisdom held true for the groups studied; other commonly held beliefs appeared to have shaky foundations.
More clarity emerged each time task force members asked, “What factors are most likely to lead to an association being remarkable?” In the end, they made judgment calls based on financial data, interviews, site visits, reviews of materials, and their own experiences as association executives.
Research Timeline
| February 2002 | Jim Collins, coauthor of Built to Last and author of Good to Great, speaks at DigitalNow conference. |
| August 2002 | Members of Research Committee of The Center for Association Leadership meet with Collins to discuss the possibility of applying his research methodology to a multi-year research project involving associations. Collins agrees to provide guidance and serve as mentor during the project. |
| November 2002 | Research Committee submits a proposal to the board of The Center for Association Leadership requesting funding for the Measures of Success project. |
| January 2003 | After receiving approval to pursue the project, Research Committee forms Measures of Success Task Force and names Michael E. Gallery, Ph.D., CAE, as chairman. |
| February–June 2003 | Random (nth name) sample of 1,000 members of ASAE (CEOs, number-two executives, and industry leaders) invited to participate in the jurying process. They receive a request to nominate five associations that are viewed as “benchmark” organizations, have persisted against difficult circumstances, and enjoy active and engaged members. Survey garners 324 responses—a 32 percent response rate at the 95 percent confidence level—and generates list of 506 associations. A natural break in the rankings produces a list of 104 top vote-getters. |
| August 2003 | Collins meets with task force to provide guidance on selection criteria for study and comparison associations. |
| September 2003 | Two recent college graduates hired as research investigators to work full time on the project. |
| October 2003 | Letters sent to top 104 associations identified through the jurying process, inviting them to participate and requesting preliminary membership and financial data. |
| November 2003 | Follow-up letters sent to associations that had not yet responded. |
| December 2003 | Overall, 55 associations respond (53 percent response rate), with 47 indicating a willingness to participate and eight opting to withdraw from consideration. Three other associations are eliminated because of tax status, age (less than 20 years old), and status as an allied society. |
| January 2004 | From the remaining pool of 36 associations, the task force selects 22 as meeting its criteria for financial and membership health (more years in the black than in the red and growth or consistent maintenance of membership/market share numbers). The other 14 associations are excused from the study. |
| February 2004 | Task force members personally contact the CEOs of seven associations that did not respond to the invitation to participate. Research investigators begin collecting 15 years of financial and membership data for associations that have agreed to participate and signed the Institutional Agreement. |
| March 2004 | Task force members define 11 areas to study for each association and develop a series of questions for research investigators to ask during on-site visits. They also develop nine research pairings, matching each association in the study group with one in the comparison group. To keep the focus on aggregate results rather than one-on-one pairings, the task force decides not to publicly acknowledge which associations form the comparison group. |
| May 2004 | Development of research instruments and interview questions to guide data collection in the 11 areas. |
| July–September 2004 | Research team field tests and finalizes research instruments and interview questions at four beta-tested associations. |
| October 2004 | Research investigators begin site visits to associations in both the study and comparison groups. |
| December 2004 | Task force meets with Collins, who reviews his research methodology and outlines a process for analyzing the data. |
| March–May 2005 | With majority of site visits and interviews completed, research investigators begin compiling detailed reports and analyses of data. |
| June–August 2005 | Two task force members assigned to each research pairing; these teams review researchers’ reports and interview transcripts as well as materials submitted by participating associations. |
| September 2005 | Task force meets with Collins to share preliminary results of data analysis, identify gaps in information, and finalize remaining steps. |
| October–November 2005 | Task force members conduct on-site visits to associations in both the study and comparison groups and interview CEOs to answer follow-up questions. Research investigators complete data collection and analysis. |
| December 2005 | Based on research reports, interviews, on-site visits, and the materials review, each team member compiles an individual dossier on one pairing of control and comparison organizations. |
| January 2006 | Drawing on their individual dossiers, members of each team compile a team dossier to share with other task force members. Measures of Success Task Force conducts its final meeting to analyze results of matched pairings and generate conclusions. |
Research Tools
Complete List of Documents Requested
| DOCUMENT | DESCRIPTION |
| ABOUT THE VISION | |
| Vision statement | Statement of vision for the organization |
| Value statement | Statement of value for the organization |
| Mission statement | Statement of mission for the organization |
| Purpose statement | Statement of purpose for the organization |
| Goal statements | Statement of goals for the organization |
| Transcripts of speeches | Transcribed speeches from CEO/ED or President/President-Elect |
| Transcripts of public addresses | Transcribed speeches from CEO/ED or President/President-Elect |
| MARKETS, COMPETITORS, AND THE ENVIRONMENT | |
| Staff allocated to market research | Number of staff assigned to market research |
| Budget allocated to market research | Budget dollars assigned to market research |
| Industry studies | Studies and reports on the industry, conducted by the organization |
| Market research utilization | Internal documents regarding how industry-related research is used |
| Membership studies | Studies and reports on the membership/donors, conducted by the organization |
| Membership surveys | Surveys conducted specifically within the membership |
| Membership research | Internal research done on the membership or member metrics |
| Membership research utilization | Internal documents regarding use of membership-related research |
| Member dues | Member dues from 1988–2003 |
| Records of mergers within membership | Documentation of mergers affecting the membership |
| Recruitment efforts | Plans and programs used to recruit and retain members |
| Membership services to nonmembers | Summary of services offered to nonmembers; is there a difference in how the service is offered? |
| Environmental scans | Environmental scans conducted on factors affecting the organization |
| Benchmarking data | Data and metrics used by the organization |
| Questionnaires and surveys | Research tools used to assess attitudes or needs of membership or staff |
| Circulation of magazine | Number of people receiving the organization’s magazine (1988–2003) |
| Core competencies for members | Defined core competencies for membership, if applicable |
| Member satisfaction studies | Studies pertaining to member satisfaction |
| Member demographics | Analysis of membership by age, gender, tenure, education, etc. |
| Staff allocated to marketing | Number of staff assigned to marketing functions |
| Budget allocated to marketing | Budget dollars assigned to marketing functions |
| Marketing plans | Marketing plans used internally by the organization |
| Member/donor retention goals | Measurable goals for member/donor retention |
| Member/donor retention performance | Realistic performance as compared to goals for member/donor retention |
| Member/donor acquisition goals | Measurable goals for total member/donor growth |
| Member/donor acquisition performance | Realistic performance as compared to goals for member/donor growth |
| Enrollment numbers | Total membership (1988–2003) |
| Membership numbers | Membership number broken down by category (1988–2003) |
| Long-term marketing plans | Internal longer-term marketing plans used by the organization |
| Marketing initiatives | Programs used for marketing to members |
| Marketing strategies | Strategies and planning for marketing products and services to members |
| Marketing implementation | Internal documents regarding how members were marketed to |
| Media kits | Promotional materials for annual meeting, magazine, and journal advertising |
| ORGANIZATIONAL ARRANGEMENTS | |
| Organizational chart that includes board, staff, and volunteers | Graphic representation of volunteer-to-staff relationship |
| Bylaws and historical amendments | Organization bylaws and amendments made (1988–2003) |
| Articles of Incorporation | Articles of Incorporation for the organization |
| Outsourced functions | List of functions outsourced by the organization |
| Consultants used | List of consultants the organization has used |
| Job descriptions | Description of all staff positions in the organization |
| National officers | List of board members in the organization (1988–2003) |
| National staff | List of employees (1988–2003) |
| USE OF TECHNOLOGY | |
| Technology staff | Number, qualifications, and salaries of staff assigned to organization’s technology functions |
| Technology budget | Annual budget dollars assigned to technology |
| Hardware expenditures | Annual expenditures on hardware (1988–2003) |
| Software expenditures | Annual expenditures on software (1988–2003) |
| Tech support expenditures | Annual expenditures on tech support (1988–2003) |
| Technologies employed | List of all technologies used internally |
| Technological advances | Highlights of major technology advances within the organization (1988–2003) |
| BUSINESS STRATEGY/STRATEGIC PROCESS | |
| Published information on strategic plans | Strategic and operational plans |
| Published information on strategic planning process | Internal documentation of planning process |
| Meeting minutes | Internal staff meeting minutes |
| Crisis management documents | Planning for and documentation of crisis management policies |
| Strategic partnerships | List of alliances or collaborations entered into by the organization |
| PRODUCTS AND SERVICES | |
| Major vendor services | List of major vendors used by the organization |
| Conference revenue | Annual conference revenue (1988–2003) |
| Conference expenses | Annual conference expenses (1988–2003) |
| Member awards programs | List of award programs for members |
| Magazine distribution | Numbers and demographics of magazine readers (1988–2003) |
| Journal distribution | Numbers and demographics of journal readers (1988–2003) |
| Certification materials | Materials pertaining to certifications awarded by the organization |
| Program design | Documents on how programs move from conceptualization to implementation |
| Program development | Documents discussing how new programs are identified, developed, and implemented |
| Current products and services | List of products and services offered by organization |
| Sales history | Revenue generated from sales of goods (1988–2003) |
| Market research for products | Documents pertaining to market research on specific products |
| Annual meeting schedules | Summary of how attendees spend their time at an annual meeting |
| LEADERSHIP | |
| Board members, terms, and roles | List of board members (1988–2003) and their term definitions and responsibilities |
| Board policies and procedures | Policies and procedures manuals for board members |
| Standing committees | List of committees for the organization, including purpose and membership |
| Ad hoc committees | List of ad hoc committees and task forces, including purpose and membership |
| Board evaluations | Evaluation documents for board members |
| Role of staff | Documentation of role staff plays in board meetings and implementation of board decisions |
| Meeting minutes | Minutes from board meetings (1988–2003) |
| CEO contract | Contract of the current CEO |
| Board of Directors bylaws | Bylaws for the board and changes (1988–2003) |
| Volunteer recognition | Documents pertaining to awards and recognition for volunteer leaders |
| Board of Directors self-assessment | Self-assessment documents used by board members |
| Board orientation | Materials used for board orientation program |
| COMMUNITY AND CULTURE | |
| Staff demographics | List of employees by tenure, age, race, gender, education, title, and grade |
| Staff size | Number of employees (1988–2003) |
| Policies and procedures manual | Staff policies and procedures manuals (1988–2003) |
| History of lawsuits | Documentation of recorded lawsuits involving the organization |
| Succession planning | Defined succession planning documents |
| Training events and programs | List of events and programs for staff’s professional development |
| History of staff restructuring and layoffs | Documentation of internal staff restructuring and layoffs |
| Performance appraisals | Performance appraisal documents for staff (blank or without names) |
| Benefits plans | Employee benefits |
| Exit reviews | Employee exit reviews (blank or without names) |
| Internal awards | Criteria pertaining to staff awards and lists of winners |
| External awards | Criteria pertaining to member awards programs and lists of winners |
| Code of ethics | Code of ethics for the organization, including changes (1988–2003) |
| Code of ethics enforcement | Documentation detailing enforcement of organization’s code of ethics |
| Diversity | Documentation and materials regarding diversity programs and initiatives within the organization |
| FINANCIAL INFORMATION | |
| Statement of Financial Position | Statement of Financial Position (1988–2003) |
| Balance Sheets | Balance Sheets (1988–2003) |
| Statement of Cash Flows | Statement of Cash Flows (1988–2003) |
| Budgets | Annual budgets (1988–2003) |
| Form 990 | Form 990s (1988–2003) |
| Annual reports | Annual reports (1988–2003) |
| Non-dues revenue | Sources of non-dues revenue (1988–2003) |
| Donations and grants | Documentation of donations and grants to the organization |
| Investment policies | Documented investment policies for the organization |
| Fundraising | Documents outlining organization’s fundraising initiatives |
| Liability insurance | Liability policies for the organization |
| Request for exemption | Request for exemption form |
| Reserve policy | Documented reserve policies for the organization |
| Financial audits | External audits of financial disclosures (1988–2003) |
| PUBLIC POLICY | |
| Amicus Curiae briefs | Amicus Curiae briefs presented by the organization |
| PAC bylaws | Bylaws of the organization’s political action committee, if applicable |
| PAC financial disclosures | PAC treasurer notes, receipts, and expenditures, if applicable |
| Other PAC information | Additional documents related to PAC (e.g., committee meeting minutes) |
| OTHER DOCUMENTS COLLECTED | |
| Chapters | Number of chapters (1988–2003) |
| Member benefits | List of benefits received by members |
| Awards received | Documentation of any awards received by the organization |
| Membership application | Materials provided to prospective members |
| Constitution | Constitution for the organization, if applicable |
| Executive Committee | List of Executive Committee members (1988–2003) |
| Policy statements | Policy or position statements issued by the organization |
On-Site Interview Questions
The following structured set of interview questions was developed to ensure consistency. The research investigators spoke with the CEO and other senior and support staff representing a range of tenure at the association. These interviews were transcribed and attached to the detailed report prepared for each of the 18 associations.
Vision, Mission, and Purpose
How would you characterize the basic reason for this organization’s existence? Has it changed over time?
Describe a difficult choice or important decision you have had to make. Did the vision, values, mission, or goals come into play in your decision or choice?
Markets, Competitors, and the Environment
Tell me about your markets (members and suppliers). Has the composition of either group changed over time? How has your organization adjusted to these changes?
How do your members and suppliers contribute to the success of your organization?
Who are your chief competitors? What do you view as their main competitive strengths and weaknesses, compared to this organization?
Do you perform formal scanning or market research? If you do conduct research, can you give me an example of how it was used?
Organizing Arrangements
Describe the relationships among the board, the CEO, and the staff. Has the structure, size, or style of governance changed since you came into this organization in your current capacity? Are there any new types of structures?
Have staffing levels and/or structure changed over the past 15 years?
How are board members and officers chosen? How is the CEO chosen?
Use of Technology
What have been the most important technological “events” to affect your organization during the past 15 years?
What has been your association’s traditional approach to technology expenditures? Describe any major technology initiatives since you’ve been here.
Of which technologies does your organization make the greatest use?
Describe your organization’s attitude toward technology: “early adopter,” “early majority,” “late majority,” or “laggard”? Your members’ attitude?
Business Strategy/Strategic Process
Over the past 15 years, can you describe two instances where the organization was forced by external events to cope with major change?
How did you define success? By that definition, was the change successful? Did you conduct any formal evaluation or measurement to assess the results?
Can you describe two examples where the organization initiated such change on its own? If so, why did you decide to undertake the change? How did you define success? By that definition, was the change successful? Did you conduct any formal evaluation or measurement to assess the results?
Looking back, is there anything that you wish you, or your organization, had done differently? Is there anything you are particularly proud of?
Products and Services
Describe the organization’s “signature” products or services. Can you explain the development process and who was involved?
What, if any, role do members have in the product development process? What about board, staff, and suppliers?
Have you had any product failures? If so, what did you learn from the experience?
Have you engaged in any joint ventures or strategic alliances with other groups? If so, what prompted your decision to do so? What has worked well, and what hasn’t?
Leadership
For the CEO:
What characteristics would you use to describe yourself and your leadership style? What do you consider to be your strengths and weaknesses?
Could you describe the process by which you were selected to lead this organization? Who made the ultimate decision, and who participated? What was it like—that is, how was it the same as previous experiences, and how was it different?
How do people move up in this organization? Is there a formal succession plan?
For Other Staff:
Which among the current CEO’s qualities, skills, or experience were most appealing to the selection team? What were your feelings on this decision?
In terms of the leadership model/style here, what do you like and what do you dislike?
How do people move up in this organization? Is there a formal succession plan?
How would you describe the relationship between your CEO or leaders and the board? What works well? What doesn’t? Why?
Culture and Community
What advice would you give to a new employee or volunteer about how to be successful in this organization?
Thinking about your job, what are you most excited about? Most worried about? Why?
Based on what you have told them, how do you imagine your friends or family would describe this association as an employer?
How much contact do you have with members on a daily basis? What is the nature and tone of the interaction?
Financial Issues
Over the past 15 years, how has your organization’s financial situation changed? What internal or external forces influenced these changes?
What event in the past 15 years has affected your financial direction? Was this event anticipated, or was it a shock? How long were its effects felt? Were any countermeasures taken as a result? What was learned from this experience?
How do you determine capital and operational expenditures?
Explain the involvement of staff and volunteers in the financial management process.
How do you evaluate and report the impact of economic and budget factors on financial planning, investment policies, and financial performance?
How do you set and manage your reserve policy?
Physical Setting and Location
How, when, and by whom was your association’s main office selected?
Is either the setting or the location of your organization’s main office important to its mission?
Does the internal layout reflect any particular value or philosophy held by your association? Does it contradict any value or philosophy?
Public Policy
When an issue impacts your membership, what actions are taken and how quickly? Who makes the call on how and when to move forward with major decisions?
How involved are members in your PAC? How are contributions primarily allocated?
How does your membership support the public policy initiatives of the organization? Do the members make an impact on public policy initiatives?
Who identifies the public policy initiatives of the organization?
How do you determine the need for grassroots activities? How are they implemented and evaluated?
Follow-up Interview Questions for CEOs
A follow-up, on-site visit was conducted to gather more information, including getting a better feel for each organization’s environment, such as its culture and physical setting. This visit included an interview with each organization’s CEO. The following structured set of interview questions was developed to ensure consistency.
- How involved are your members in driving change?
- How are priorities set? Do you believe that priorities change as elected leaders change?
- How is the strategic plan communicated throughout the organization to ensure its implementation?
- How do you integrate the strategic plan into day-to-day operations?
- How do you evaluate the outcomes of the strategic plan?
- Has your planning/budgeting process changed within the last 5 to 10 years? If so, how?
Team Dossier
After completing the supplemental data collection, each task force team compiled a dossier that analyzed the similarities and differences between one matched pair (one study association and one comparison association). The entire task force reviewed all nine team dossiers as the starting point for generating its findings.
Study Organization: ______________________________________
Comparison Organization: ________________________________