
Providing meaningful information: Part C—Data management and visualization
Lisa Federer National Institutes of Health Library, Bethesda, MD, United States
Abstract
This chapter provides an introduction to how informationists can support one of the biggest challenges that researchers and medical professionals now face: how to deal with the rapidly increasing data deluge. With the size of research and clinical data growing exponentially, and with new policies from funders and journals, researchers and clinicians need help to ensure that they are able to work effectively with their data in ways that comply with requirements but do not present an undue burden. Specifically, this chapter considers how informationists can provide support for data management and visualization. Many of the skills that informationists already have are applicable to these problems, and this chapter also provides suggestions for how informationists can get started with gaining new skills and designing data services.
Keywords
Data management; Data visualization; Data services; Informationist services; Research data management; Research support services
It has been said that “data is the new oil”—a valuable resource that can power a variety of human endeavors (Vanian, 2016). This analogy holds true not only in business and economics, but also in medicine and scientific research, where technological advances increasingly allow researchers to uncover knowledge in data at a previously impossible scale. Like oil, though, data are a resource that must be processed and refined in order to realize their full value. Many researchers and clinicians have not had formal training in the skills needed to work effectively with data, including data management, analysis, and visualization (Federer, Lu, & Joubert, 2016).
This gap in knowledge presents an opportunity for librarians and informationists to meaningfully engage and collaborate with users to help address their data-related needs. Informationists who work with researchers and clinicians are deeply familiar with these users’ information needs and information-seeking behaviors; by applying their expertise in information management to data specifically, informationists have an opportunity to leverage their unique skills and background to provide valuable guidance to the users who need assistance in working with data. Indeed, many informationists and librarians have taken leadership roles in implementing data services at their institutions (Antell, Foote, Turner, & Shults, 2014). This chapter provides context on the relevance of data management and visualization to biomedical research and clinical practice and explores how informationists can become involved in supporting their users’ data needs. While informationists will likely find much of their existing knowledge and expertise applicable to this type of work, this chapter also includes suggestions for how informationists can further develop their skills to support data services in an evolving research and clinical landscape.
5.1 An introduction to data management and visualization
Researchers and clinicians have been collecting many types of data for years—so why is data getting so much attention now? A number of technological drivers have led to an explosion in the amount of data. According to a 2017 report, we create 25 quintillion bytes (or 2.5 million terabytes) of data every single day (IBM Marketing Cloud, 2017). Although some of those data comprise cat videos or the latest meme, but the growth of data is not limited to this type of popular data—clinical and research data are also being generated at a rapidly increasing speed. For example, the size of the world’s genomic data doubles every 7 months; depending on how new technologies develop, we could sequence up to 2 billion human genomes by 2025, which would account for more data than YouTube or Twitter (Stephens et al., 2015).
The huge growth in data is due in part to the fact that we now have the technology to generate a large amount of data more quickly and cheaply than ever before. The process of sequencing the first human genome cost at least $50 million and took about 13 years; today, a human genome can be sequenced in about 24 hours for less than $1000 (National Human Genome Research Institute, 2016). Moreover, the cost of storing that data has dropped precipitously, meaning that not only can we cheaply generate data, we can also continue to store them at a comparatively low cost (Komorowski, 2014). In addition, with the increase in internet transfer speeds, researchers often do not need to store data themselves. Instead, data can be stored using cloud services, often for less than it would have cost to maintain a local copy, and transferred or accessed as needed.
The move to electronic health records (EHRs) has also helped to create a wealth of digital data. Analog patient records lacked widespread utility beyond the clinical care of the individual patient, but EHRs make it possible for data to be used not only to improve the care of the individual patient, but also to the benefit of the broader population. The Centers for Medicare and Medicaid Services (CMS) created criteria to incentive “meaningful use” of EHR systems, among them a number of criteria that address public and population health (Centers for Medicare and Medicaid Services, 2016). While patient privacy must be protected, hospitals and providers can use EHRs to submit data to public health registries, clinical data registries, and other centralized sources that allow for the collection of data for epidemiological and clinical research, among other uses. Utilizing EHR data allows researchers to include more patients than they could ever hope to recruit for a trial and saves time by making use of existing data rather than collecting their own new data. Such approaches have been used in a variety of contexts in the last several years (Dewdney & Lachance, 2017; Ehrenstein, Nielsen, Pedersen, Johnsen, & Pedersen, 2017; Schofield, 2017).
In addition to technological drivers, new policies about data management and sharing have also been instrumental in shaping the current research data landscape. In 2011, the National Science Foundation (NSF) became one of the first US federal funders to require that all grant proposals include a data management plan (National Science Foundation, 2010). This policy helped address a problem that has become increasingly recognized as significant in many scientific communities: how to ensure preservation and accessibility of federally funded research data. Two years later, the US Office of Science and Technology Policy (OSTP) issued a memorandum directing federal agencies that spend more than $1 million annually on research funding to develop policies regarding access to the results of federally funded scientific research (Holdren, 2013). Specifically, the OSTP memo instructed agencies to consider how to provide access to not only the peer-reviewed articles resulting from their funded research, but also the data underlying these results. As a result, federal agencies funding a variety of scientific research areas have since developed policies regarding article and data sharing (SPARC, 2016).
Because the technological landscape of scientific culture around data is changing so rapidly, funder policies regarding data are likely to evolve significantly in the next decade. Informationists who support research data services should therefore make an effort to remain apprised of the policies that are likely to apply to their users. As of this writing, NIH's data-related guidance comes primarily from two broadly applicable policies, along with a handful of policies more specific to certain types of data and subject areas (National Institutes of Health Office of Extramural Research, 2016b). The NIH Data Sharing policy applies to grants since 2003, but only those receiving more than $500,000 per year in direct costs (National Institutes of Health Office of Extramural Research, 2016a). The policy specifies that researchers must make the research data underlying their results available no later than acceptance for publication of the article reporting on their findings, though it does not prescribe any specific repository or mechanism for doing so. The other major policy, the NIH Genomic Data Sharing (GDS) policy, applies to all NIH-funded research, regardless of funding mechanism or amount, that generates any type of human or nonhuman genomic data (National Institutes of Health Office of Science Policy, 2017).
Although NIH has addressed data sharing through such policies, at present, the NIH does not require researchers to submit a data management plan; however, plans to require a “data management and sharing plan” (DMSP) are included in the NIH’s 2015 response to the previously discussed 2013 OSTP memo (National Institutes of Health, 2015). The proposed DMSP policy will require all researchers, regardless of funding type or amount, to submit a detailed plan outlining how they will manage their data throughout the research cycle, as well as how they will make the data available upon publication. Although no start date has been formally announced as of this writing, researchers and others who receive NIH funding of any type should expect that they will be required to include DMSPs with submissions in the near future.
In addition to policies from funders, researchers increasingly face other data sharing mandates that may require them to make their data publicly available. Many journals and publishers, such as PLOS, the Nature Publishing Group, and Science journals, all require that authors make their data available upon publication. These data may be crucial for readers to fully understand and assess the findings of an article, so making data available is a logical step for journals aiming to increase transparency and reproducibility of the articles they publish. Although data sharing policies do not specifically address data management, the expectation that data will be eventually shared and necessitates proper management to ensure that data will be ready to share when the need arises.
All of the technological, policy, and cultural changes discussed here have resulted in a dramatically shifting academic and clinical landscape around how data are handled. Despite the increasing importance of being able to competently handle large amounts of data, many researchers and clinicians are not introduced to these skills in their training programs, and those individuals already working in these settings often have difficulty in finding time to learn new skills or even confidently identifying the types of skills that they would need to learn to be more effective in their work. Informationists can play an important role in filling these knowledge gaps by providing targeted training, offering individual or group consultations, and developing services aimed at addressing problems in these areas. While many examples of informationists providing support across the entire research data life cycle exist, this chapter focuses on two specific areas that are of particular interest and need for researchers and clinicians: research data management and data visualization.
5.1.1 Taming data through proper management
With the flood of data that has been generated in the last several years, many users are finding that ad hoc techniques for organizing data are no longer effective. One person with a few dozen books can put them on a shelf in any order and have little problem finding what she needs, but scaling up to libraries with thousands of books necessitates systems of organization and management to ensure that all users will be able to find what they need with minimal effort. The same is true of data, particularly the large datasets that are typical in research and clinical settings. The proliferation of data means that proper management is essential to ensure that the desired data can be located, understood, and utilized.
Data management is also crucial in ensuring the accuracy and reliability of data, especially given the often collaborative nature of data collection. Most biomedical research data is collected by teams of researchers, consisting of senior scientists, postdoctoral fellows, and students, some of whom may spend as short as a semester working with a research team before they move on to a new institution, possibly even in a different country. Similarly, clinical care teams often consist of many different health professionals who may work in very different settings and have little direct communication with each other. Given the distributed nature of data collection in research and clinical settings, it is important to understand who collected data, as well as when and how. Having adequate metadata and other details to track the provenance of data ensures that researchers and clinicians can have confidence in using the data to draw conclusions or make decisions.
Ensuring the validity and reliability of data is especially important given the recent concern over a “reproducibility crisis” in science. A shocking 75%–90% of published research findings cannot be reproduced, making it difficult to have confidence in the validity of these findings (Begley & Ioannidis, 2014). While a number of factors contribute to the problem of irreproducibility, poor research data management is among the issues that have led to this reproducibility crisis. In addition, reproducibility can be increased through transparency in research, in particular data sharing. A 2014 policy brief describing efforts the NIH was taking toward enhancing reproducibility included discussion of plans to facilitate and encourage data sharing (Collins & Tabak, 2014). Given the recognized seriousness of irreproducibility within scientific research, adopting rigorous data management standards that ensure that data are accurate, verifiable, and ready to share can help researchers avoid such problems.
5.1.2 Making sense of data through visualization
While data visualization may seem simply like a way to add some visual interest to an article or scientific poster, visualization can in fact play an essential role in analyzing and understanding data throughout the research process and within the context of clinical care. Presenting data in visual form allows us to utilize some of our most powerful perceptual abilities to detect meaning in data. Effective visualizations allow users to interact with and manipulate data, view relationships among multiple variables, track changes in data over time, and generally gain insights that would not be possible simply by looking at the raw data.
To understand the importance of visualization in exploratory data analysis and detection of patterns and meaning, consider Table 5.1, a set of four datasets known as Anscombe’s quartet (Anscombe, 1973). Each of the four sets, I–IV, consists of 11 pairs of X and Y values. Examining the raw X and Y values likely provides little in the way of useful information, even to an astute reader. Conducting statistical calculations on each set of values might lead the reader to believe that the four datasets are similar; after all, the values for five different descriptive statistical measures are nearly identical across all the four datasets.
Table 5.1
| I | II | III | IV | ||||
|---|---|---|---|---|---|---|---|
| X | Y | X | Y | X | Y | X | Y |
| 10 | 8.04 | 10 | 9.14 | 10 | 7.46 | 8 | 6.58 |
| 8 | 6.95 | 8 | 8.14 | 8 | 6.77 | 8 | 5.76 |
| 13 | 7.58 | 13 | 8.74 | 13 | 12.74 | 8 | 7.71 |
| 9 | 8.81 | 9 | 8.77 | 9 | 7.11 | 8 | 8.84 |
| 11 | 8.33 | 11 | 9.26 | 11 | 7.81 | 8 | 8.47 |
| 14 | 9.96 | 14 | 8.1 | 14 | 8.84 | 8 | 7.04 |
| 6 | 7.24 | 6 | 6.13 | 6 | 6.08 | 8 | 5.25 |
| 4 | 4.26 | 4 | 3.1 | 4 | 5.39 | 19 | 12.5 |
| 12 | 10.84 | 12 | 9.13 | 12 | 8.15 | 8 | 5.56 |
| 7 | 4.82 | 7 | 7.26 | 7 | 6.42 | 8 | 7.91 |
| 5 | 5.68 | 5 | 4.74 | 5 | 5.73 | 8 | 6.89 |
| Mean(x) = 9 SD(x) = 3.32 Mean(y) = 7.5 SD(y) = 2.03 Corr coef(x, y) = 0.816 | Mean(x) = 9 SD(x) = 3.32 Mean(y) = 7.5 SD(y) = 2.03 Corr coef (x, y) = 0.816 | Mean(x) = 9 SD(x) = 3.32 Mean(y) = 7.5 SD(y) = 2.03 Corr coef (x, y) = 0.816 | Mean(x) = 9 SD(x) = 3.32 Mean(y) = 7.5 SD(y) = 2.03 Corr coef (x, y) = 0.817 | ||||
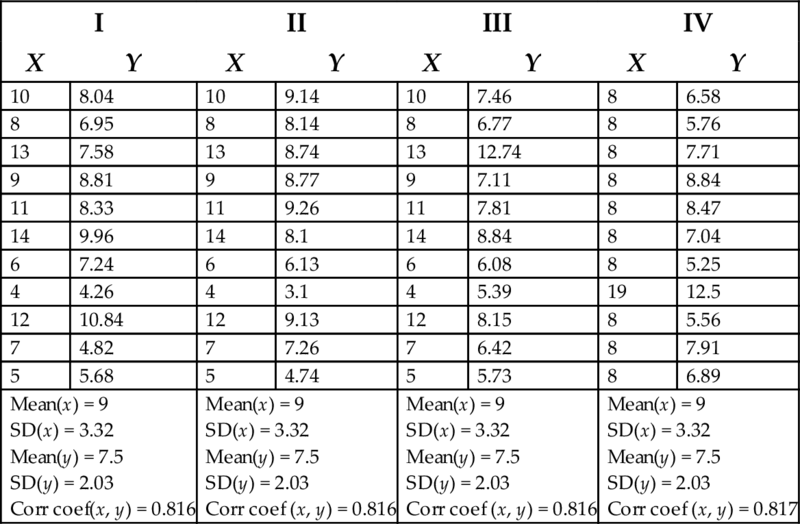
The pairs of X and Y values in these four datasets are identical (or nearly identical) in several statistical measures, including mean and standard deviation of x and y and correlation coefficient.
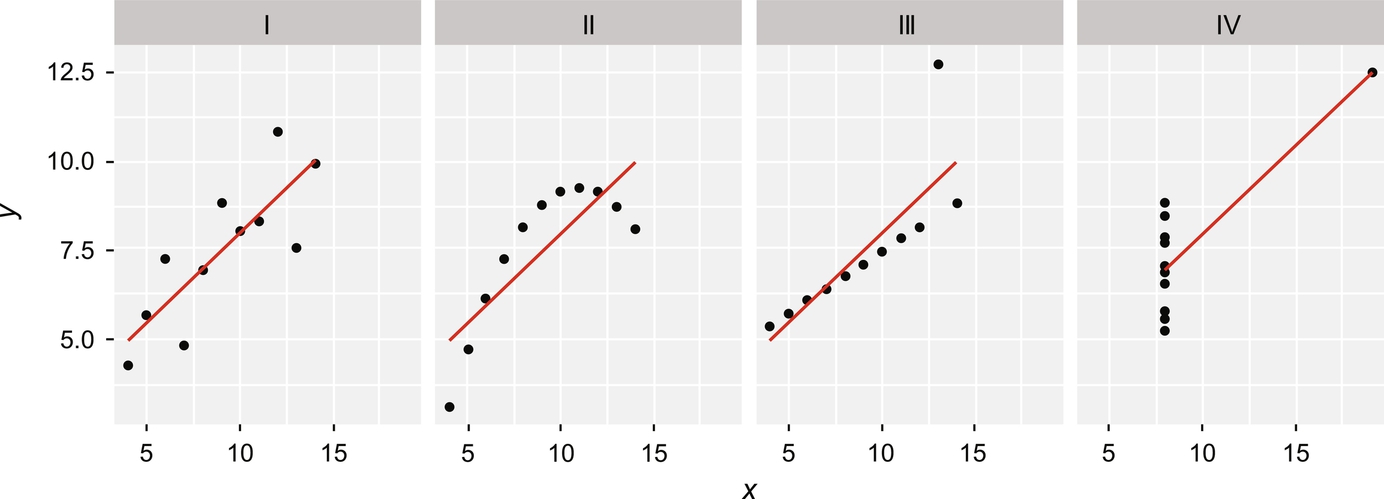
Upon viewing the data visualized as a scatterplot in Fig. 5.1, it becomes obvious that the four datasets are actually quite different. The red regression line, which demonstrates an estimate of the relationship between the X and Y values, is identical across all four datasets, yet the position of the points in each chart differs dramatically. Charts III and IV, for instance, demonstrate how a single outlier can significantly skew the statistical analysis of a dataset. As Anscombe’s quartet demonstrates, visualization can provide a clear understanding of data distributions and patterns in ways that statistical analysis alone cannot.
Visualization can be a highly effective means for understanding the types of large and complex datasets that characterize both scientific research and clinical practice. For example, EHRs contain large amounts of data about many patients, including both narrative and structured data, but the structure and organization of these data make it nearly impossible to detect patterns about what is happening at the care setting on the whole, locate similarities between patients, or even detect some patterns of disease within an individual patient. Software that presents the same data visually can make such patterns, similarities, and anomalies easily detectable (Clark, Grove, Shneiderman, & Chute, 2012; Monroe, Lan, Lee, Plaisant, & Shneiderman, 2013). Within biomedical research, interactive visualization in particular can be especially helpful in detecting patterns and discovering knowledge within large datasets, such as those frequently used in genomics and related disciplines (Turkay, Jeanquartier, Holzinger, & Hauser, 2014).
5.2 Roles for informationists in data management and visualization
Given the quickly changing landscape of data management and visualization, many researchers and clinicians face significant challenges in keeping up with policies and mandates as well as finding the best solutions to the data problems they face in their day-to-day work with various types of data. Informationists have a variety of opportunities to work with their users to provide helpful solutions to many of these data management and visualization challenges. Many libraries have started to offer data services, and a growing number of informationists and librarians work as dedicated data specialists.
Although informationists may need some additional training to successfully provide a high level of data services, many informationists will find that their skills and experience will enable them to effectively and meaningfully engage with their users on data-related issues. Many of the information management skills that informationists are trained to utilize are as applicable to data as they are to other types of information. Topics such as information-seeking behavior, metadata and information standards, and information literacy all have corollaries to data-related work. Informationists who have already worked in positions where they are embedded with users are also at an advantage in that they have likely obtained some subject matter knowledge, either through formal training or simply through working closely with users in clinical or research settings. In addition, such informationists are likely familiar with the typical practices and workflows of their users, and are therefore aware of the types of data their users work with and the challenges they face in doing so.
Whether an informationist has a long history of working with their users or is relatively new to the field, it is important to recognize that gaining at least some background information about the setting in which their users work is essential to successful provision of data services. Informationists will be able to best serve their users by assessing users’ needs and knowledge gaps and focusing on developing the types of services that will best address those challenges. A one-size-fits-all approach is unlikely to be effective in developing data services, since users within different fields and at different institutions likely have different needs; therefore, this section aims to provide some ideas about general services and approaches that informationists can adapt to their particular institution’s or groups’ needs.
5.2.1 Data management planning
As has been discussed, some funders, such as NSF, require that grant proposals include a formal data management plan that specifically outlines how data will be described, managed, preserved, and shared, both during and after the active phase of the study. As NIH has not previously had such a requirement, researchers will likely not be familiar with what should be included in a thorough DMSP once the new policy goes into effect. The rollout of the NSF DMP policy in 2012 demonstrated that researchers could benefit from guidance on how to write plans and that librarians and informationists could be effective at providing such assistance. DMP/DMSP support is one of the most common data services offered by US-based libraries and can take the form of classes, consultations, or development of support materials (Antell et al., 2014; Tenopir et al., 2015). Informationists who have not worked extensively in data services may also find DMP/DMSP support to be an approachable service to start with, as there are many examples of DMPs available, as well as a wealth of existing training materials from other libraries that informationists can draw on for inspiration. In addition, the DMPTool, a free, interactive resource for creating DMPs based on specific funder requirements, can be useful in learning about writing DMPs (University of California Curation Center, 2017).
Working with researchers on developing DMP/DMSPs has the added benefit of potentially providing valuable insight into the types of data they work with, where and how they store them, and other key pieces of information about how researchers work with data and the challenges they face. These sorts of insights can help informationists identify gaps in knowledge and services that they may be able to address, thereby building their data services in an evidence-based fashion.
5.2.2 Clinical data management
While data management systems exist in many clinical settings, informationists may have an opportunity to provide support for data management in this context as well. Informationists have worked with clinical care and clinical research groups in a variety of contexts, including consultation on development of data workflows, data quality assurance, selection of and training on data collection and management tools, and long-term preservation of data (Hanson, Bakker, Svirsky, Neuman, & Rambo, 2013; Whipple, Odell, Ralston, & Liu, 2013). However, management of clinical data presents its own unique set of challenges. Most clinical data contains personally identifiable information (PII) and may be subject to HIPAA regulations, so solutions that work well for basic science research groups may not be feasible for use in clinical settings. Fortunately, tools such as REDCap have been created to make it possible to easily and electronically collect and store data while still maintaining compliance with HIPAA and other privacy and security regulations (Vanderbilt, 2017).
5.2.3 Data visualization
Although visualization may not seem like it is within the purview of informationist services, many of the skills required to create effective data visualization are part of the core competencies associated with library and information science professionals. Informationists have an understanding of how to effectively communicate information to diverse audiences depending on those users’ unique information needs, which is crucial to effective visualization. The concept of information literacy—being able to locate, assess, select, and appropriately use information for a variety of purposes—has parallels in “visual literacy,” which involves not only effectively determining meaning from visual symbols, but also understanding how to encode meaning in visualizations in ways that will be understandable to the viewer (Felten, 2008). Many libraries have started offering visualization services, with some even employing dedicated visualization librarians or informationists (Brandenburg & Joque, 2016; Duke University Libraries, 2017; NCSU Libraries, 2017).
As the example of Anscombe’s quartet demonstrated, data visualization plays an important role in the data exploration and analysis phase of scientific research and clinical practice. Of course, data visualization is also a powerful method for communicating research findings, whether in the form of a static visualization on a poster or in a journal article, or as an interactive visualization on a webpage. In fact, as much journal readership has moved away from print and to greater consumption of web-based articles, some visualization experts have suggested that journals not limit themselves to static images, but instead encourage authors to utilize interactive visualizations that will allow readers to more meaningfully interact with the data (Weissgerber et al., 2016). Creating interactive visualizations was once a complex task that typically required knowing a coding language, but the development of drag-and-drop tools, such as Tableau and Qlik, has made the creation of interactive visualizations possible even for those who are not programmers or visualization experts. Informationists who are involved with scholarly communication and assisting researchers with disseminating their research findings may wish to follow developments in the adoption of tools for interactive visualization in online journals and other academic research media.
5.3 Case study: Data services at the NIH library
The NIH Library began to see a need among their users for support for data management, around the same time that many libraries started to hire positions devoted full time to data support. I was hired for the Research Data Informationist position at the Library in 2013 and began development of the Data Services program. Knowing that researchers at the NIH likely had unique needs, we conducted a needs assessment to determine how best to serve our users. When asked which data-related topics were most relevant to their work, users reported that most of the tasks were highly relevant, but they generally rated their expertise in these tasks as lower, suggesting a need for additional training and support (Federer et al., 2016).
The first classes that I offered at the Library primarily focused around general data management. While these classes were well-attended, I realized from interacting with users and feedback obtained on class evaluations that users needed more in-depth support in data science-related topics, particularly data visualization and programming with R and Python. While users were generally highly interested in such topics, few resources existed at NIH for them to learn these skills. With the support of my library, I began a course of study to build my own expertise so that I could better provide the support that our users needed. I completed a variety of both free courses, including Coursera’s Data Science Specialization and Indiana University’s Information Visualization Massive Online Open Course (IVMOOC), and paid certifications, including New York University’s Data Visualization graduate certificate and Georgetown University’s Data Science graduate certificate.
Although building expertise in R programming, data visualization, and advanced data management was a time-consuming process, the investment of time and effort paid off when I was able to begin offering specialized courses and consultations. After 3 years of offering courses in R and data visualization on an approximately monthly basis, classes are still wait-listed almost every month. These classes also offer a means for gaining rapport with users and an entrée into working with them to provide more significant data-related support, sometimes meeting needs that they did not even know they had. The following case study provides an example of how an informationist might provide support across the research data life cycle, starting with just one contact.
5.3.1 The initial contact
A postdoctoral fellow working on a clinical research project emailed me after attending a workshop on data visualization with R. He had been using Excel to create visualizations of his data, but found that he could not quite achieve what he had envisioned using Excel. He was excited about what he had learned in the R visualization class and could see its potential for creating the visualization he had in mind, but he was still a novice R user and needed help understanding how to go from idea to reality.
We arranged a time to meet and I asked him to bring his data with him so that we could work on it together. He brought his laptop, as well as some examples from journal articles of the type of visualization he wanted to create. I saw right away that part of his problem was that his data were organized in Excel in a way that made sense to him, but that would not work for any sort of visualization program, including R. For example, he had broken the spreadsheet into three parts to indicate three different visits from each patient, and had put different patients into different sheets in his Excel workbook. When visualizing data, particularly with R, it is best practice to have one row for each subject and one column for each observation. We discussed how he could reorganize his data, as well as remove some other features that did not follow best practices for data management, such as color coding to indicate a variable in some of his cells.
Once we had reorganized his data, he found it much easier to see how he could use R to create the visualization he wanted. He was also surprised and pleased to have learned some unexpected new skills regarding data management, and he looked forward to incorporating these best practices into his work so that he would have an easier time creating other visualizations and doing additional analysis in the future. At the end of the consultation, he did not have a completed visualization, but he had a better understanding of why his initial approach had not worked and a plan for how to make the visualization he had in mind.
Over the next few days, he would occasionally email me with questions or with lines of code that were not working for him. Since I already had an understanding of his desired outcomes, meeting again in person was not necessary, and I was able to provide quick answers to his questions and troubleshoot where needed. Throughout the process, he had an opportunity to learn by doing, problem solving where he could and asking for help when needed. Within a week, he had completed his fully customized visualization and learned about visualization and data management in the process.
5.3.2 Continuing support
A few months later, the postdoc contacted me to ask about providing assistance for a new student who was joining the lab for the summer. She would be collecting data in Excel for a new project that she would be working on during her time with the lab. Since her time with the lab was temporary and she would be leaving at the end of the summer, it was important for her data to be well organized, in a way that would be understandable to the rest of the lab even after she left. I met with her and we discussed some of the best practices I had discussed with the postdoc, but she also needed some more fundamental guidance on data management, such as versioning and file naming. At the end of her time in the lab, she invited me to attend the final presentation she gave for the department, which incorporated some of the visualization skills the postdoc had learned from me and passed along to her.
As this example demonstrates, making an initial contact with one user can eventually lead to providing ongoing support for an entire lab or department. Researchers often do not think of the library as a place to come for help with data-related questions, but once they understand that informationists who have this expertise are available to help, they are eager to take advantage of this assistance. Initially, most users will come for help with an existing project, where they already have problems with their data, but ideally, researchers will start to come to informationists at the beginning of new projects, when the informationist can provide guidance on how to properly manage data going forward, rather than trying to fix messy data at the end of the project.
5.4 Becoming a successful data informationist
As this chapter has emphasized, much of the knowledge and expertise needed to provide data services align with the skills many informationists already have. Informationists who have experience working with clinical or research groups would likely have gained knowledge of these groups’ work and needs that provide a basis for understanding the types of data services that could be useful to these groups. In addition to the subject matter expertise needed to work with such groups generally, the successful data informationist should also have an awareness of data policies and mandates to which their groups may be subject, as well as a familiarity with some of the tools that can be used in working with, managing, and visualizing data.
Fortunately, many resources exist for gaining the skills and knowledge necessary to provide data services. The New England Collaborative Data Management Curriculum (NECDMC) provides a useful starting point for informationists who would like to start teaching data management at their institution (Martin, Creamer, & Kafel, 2013). The NIH’s Big Data to Knowledge (BD2K) initiative has also funded the development of open educational resources, some geared specifically toward librarians and informationists, that will provide new learning opportunities for those interested in developing skills to support data science and data management. A number of continuing education courses related to data services and data management are offered through the Medical Library Association, through webinar as well as in-person at the organization’s annual meetings. Online courses such as those offered through Coursera can be helpful in learning some of the technological skills relevant to working with data.
In addition to online learning opportunities, the quickly growing community of librarians and informationists who provide data services has begun to create group and resources that allow them to network, provide each other support, and share ideas. Many library and information science journals have begun to feature articles that discuss data services within specific domain contexts; the Journal of eScience Librarianship focuses specifically on “services related to data-driven research in science, technology, engineering, math, social sciences, medicine, and public health” (University of Massachusetts Medical School and Lamar Soutter Library, 2017). Although no large-scale professional organization dedicated specifically to data-related library work yet exists, a number of special interest groups exist within larger professional organizations, such as the Data Special Interest Group within the Medical Library Association. Informal groups, such as the email list Datacure, also allow for networking among like-minded professionals. Even more casually, many data librarians and informationists communicate on Twitter using the hashtag #datalibs.
Any informationist interested in starting a new data service should consider how to do so using evidence-based practices to ensure success. As this chapter has discussed, different user groups at different institutions may have widely diverging needs. While keeping up with the literature and knowing what types of services other informationists have developed can be helpful, the success of a service at one institution does not necessarily mean it will be well received in other contexts. The first step to ensuring a successful data service is identifying the users’ most pressing needs and considering how the informationist can best address them. Ongoing evaluation and assessment is also essential to ensure that the service is meeting users’ needs.
Informationists embarking on data services will likely find that outreach and marketing are crucially important to the success of such new services. Although librarians and informationists at hundreds of libraries around the world have been providing data services for years, many users still do not think of libraries as a place to look for assistance with their data problems. In fact, in many institutions, the library is the only place such services are offered, and users are happy to discover that solutions exist for many of their data problems. Although developing and implementing data services can be time consuming and challenging, informationists will likely find that the work is rewarding and can be of great value to their users.