
Effective companies make use of numerous data sources. These can range from customer activity to supplier prices, data processing throughput, system logs, and so on, depending on the nature of the business. By just having the data, even graphing it using a plotly graph, like the one we developed in Chapter 3, A Blueprint for Making Sense of Feedback, might not be proactive enough. Usually, it's not the case that somebody is watching every data stream or graph constantly. Thus, it is equally important that the data can be summarized, and the right people be notified when interesting events occur. These events could be anything from changes in the overall trend of the data to anomalous activity. In fact, the two analyses, trends, and anomalies are sometimes found with the same techniques, as we will discover in this chapter.
Trends and anomalies may also serve as a user-facing feature of a company's services. There are numerous such examples on the internet. For instance, consider Google Analytics' (https://analytics.google.com/analytics/web/) website traffic tools. These tools are designed to find trends and anomalies in website traffic, among other data analysis operations. On the front dashboard, one is presented with a plot of daily/weekly/monthly website traffic counts (Figure 1, left). Interestingly, though the plot is labeled, How are your active users trending over time? Analytics does not actually compute a trend, as we will do in this chapter, but instead gives you a plot so that you can visually identify the trends. More interestingly, analytics sometimes notifies the user on the dashboard of anomalous activity. A small plot shows the forecasted value and actual value; if the actual value (say, of website hits) significantly differs from the forecasted value, the data point is considered anomalous and warrants a notification for the user. A quick search on Google gives us an explanation of this anomaly detector (https://support.google.com/analytics/answer/7507748):
First, Intelligence selects a period of historical data to train its forecasting model. For detection of daily anomalies, the training period is 90 days. For detection of weekly anomalies, the training period is 32 weeks.
Then, Intelligence applies a Bayesian state space-time series model to the historical data to forecast the value of the most recent observed data point in the time series.
Finally, Intelligence flags the data point as an anomaly using a statistical significance test with p-value thresholds based on the amount of data in the reporting view.
Anomaly detection, Google
In this chapter, we will develop a Bayesian state space time-series model, also known as a dynamic linear model (DLM), for forecasting website traffic. We will also be looking at techniques for identifying anomalies based on a data point's significant deviation from expectation.

Figure 1: Google Analytics trend and anomaly report
Twitter is another case of a company that highlights trends to provide value to its users. By examining hashtags and proper nouns mentioned in tweets, Twitter is able to group tweets into categories and then analyze which categories are rising the most rapidly in terms of a number of tweets in a short time period. Their home page (for visitors who are not logged in) highlights these trending categories (Figure 2). Without any user information, they show worldwide trending categories, but the feature also works on a more local level. In this chapter, we will look at a technique that we can use for determining the rate of increase in a data stream. Identifying trending categories is then a matter of highlighting the categories with the greatest rate of change. However, it's clear from Figure 2 that Twitter is not focusing on the diversity of trending categories since several of the trends related to the same global phenomenon (World Cup 2018):

Figure 2: Twitter home page
Both these examples highlight the value that trends and anomalies can provide to users. But, at the same time, organizations can also find value in these techniques by looking at internal data streams. For example, it's crucial that the IT department of an organization detects anomalous network activity, possibly indicative of hacking attempts or botnet activity, data processing delays, unexpected website traffic changes, and other customer engagement trends such as activity on a product support forum. A variety of algorithms are available to analyze data streams, depending on what exactly the nature of the data is and the kinds of trends and/or anomalies we wish to detect.
In this chapter, we will be covering:
- Discovering linear trends with static models and moving-average models
- Discovering seasonal trends, that is, patterns of behavior that can change depending on the day of the week or month of the year
- Recognizing anomalies by noticing significant deviations from normal activity, both with static and moving average trend models
- Recognizing anomalies with a robust principle component analysis (RPCA)
- Recognizing anomalies with clustering rather than trend analysis
Identifying trends and anomalies involve similar techniques. In both cases, we must fit a model to the data. This model describes what is "normal" about the data. In order to discover trends, we'll fit a trend model for the data. A trend model fits a linear, quadratic, exponential, or another kind of trend to the data. If the data does not actually represent such a trend, the model will fit poorly. Thus, we must also ask how well a chosen model fits the data, and if it does not match the data sufficiently well, we should try another model. It's important to make this point because, for example, a linear trend model can be applied to any dataset, even those without linear trends (for example, a boom-and-bust cycle like bitcoin - USD prices between mid-2017 and mid-2018). The model will fit very poorly, yet we could still use it to predict future events – we will just likely be wrong about those future events.
In order to recognize anomalies, we take a model of what is normal about the data and identify those data points that are too far from normal. This normal model may be a trend model, and then we can identify points that do not match the trend. Or the normal model may be something simpler like just an average value (not a trend, which occurs over time). Any data point that is significantly different from this average is deemed an anomaly.
This chapter covers a variety of trend and anomaly detectors. Which approach is best suited for a particular data stream and a particular question depends on a variety of factors, represented in the following decision trees:
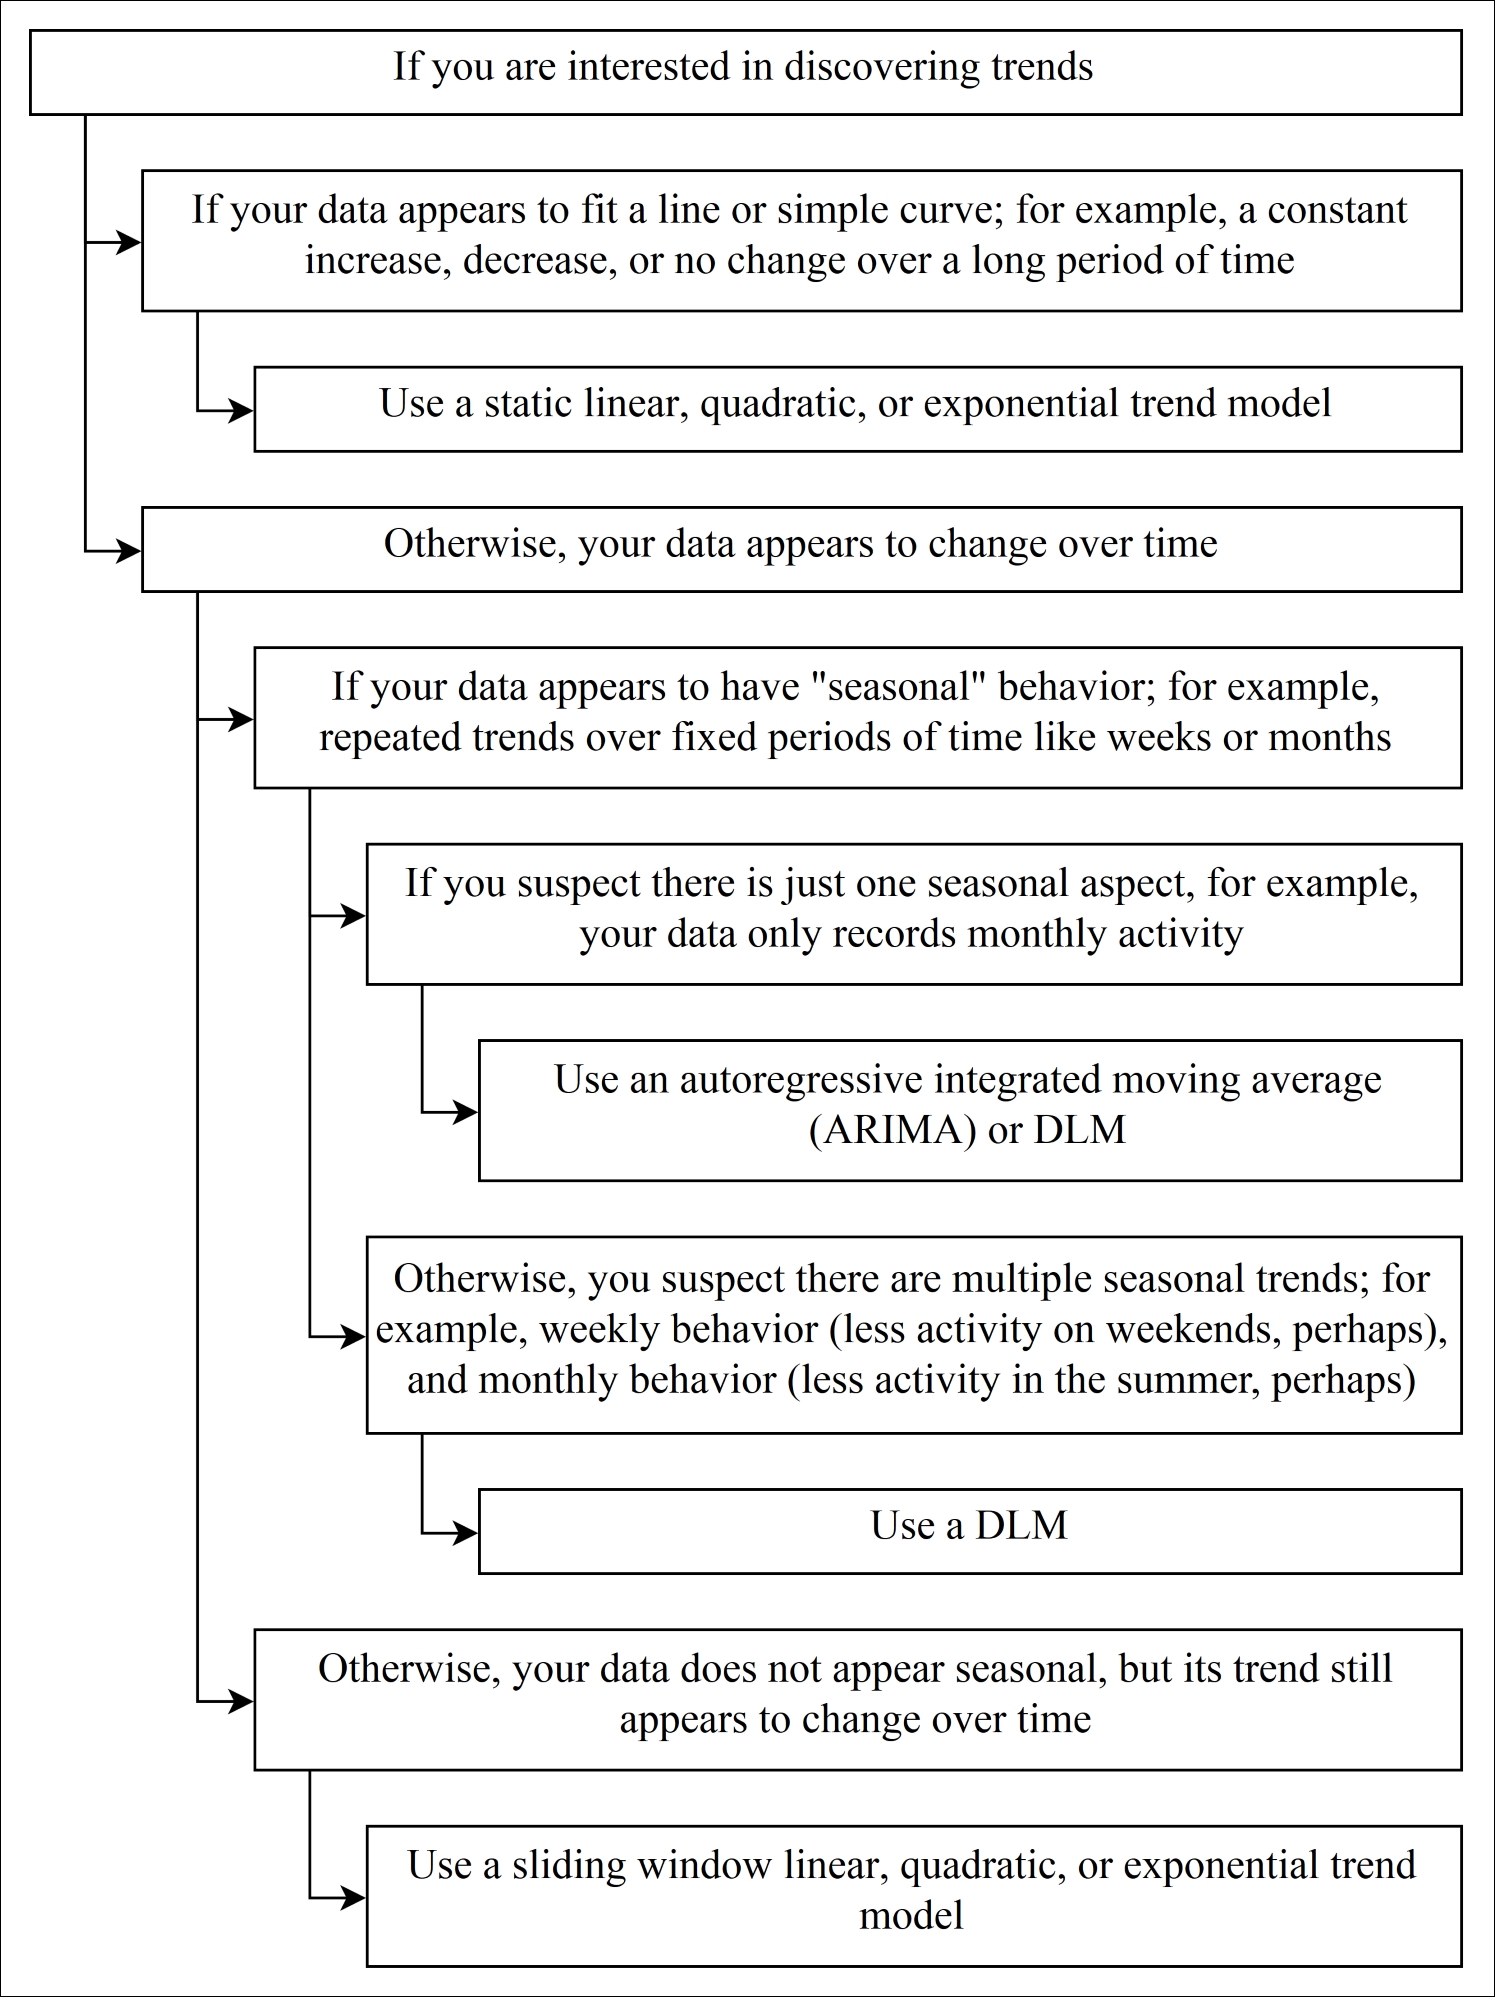
Figure 3: Decision tree for finalizing an approach for discovering trends

Figure 4: Decision tree for finalizing an approach for recognizing anomalies
The remainder of this chapter examines each of these techniques in turn and then concludes with some advice about deployment and evaluation.