
Chapter 4. Presentation
Hacks 28–39
As comprehensive as a database can be—with programmatic functionality, sophisticated queries, and other bells and whistles—you still need to be able to communicate facts about the data it contains. This is where forms and reports come into play. A decent database front end is critical for interaction between the database and us mere mortals. Access, of course, shines in this area.
The report designer in Access is a feature-rich development platform. It includes formatting tools, grouping and sorting options, a palette full of controls, and the ability to hook into events and muster up some coolness with VBA. Forms also have events, formatting options, and properties galore. Putting them all to use is beyond the scope of a single chapter. So instead, this chapter highlights some exciting ways to work with forms and reports.
You’ve already seen how to use forms to display database records. How about using a form to play a slideshow or movies? “Create a Slideshow in Access” [Hack #33] and “Play Videos in Access Forms” [Hack #34] show you how.
First impressions are usually the best. Make sure your reports are eye-poppers. A number of hacks in this chapter explain how to provide sophisticated grouping and formatting in reports. “Provide a Direct Link to a Report” [Hack #31] shows how a busy user can click a shortcut to print a report without fussing around with the database. “View Reports Embedded in Forms” [Hack #35] explains how to incorporate reports into forms.
Separate Alphabetically Sorted Records into Letter Groups
Tap the Prefix Characters property to gain new layout possibilities.
Sorting alphabetically is nothing new; in fact, it’s rather old—one of the standard practices we take for granted. When you’ve got dozens or hundreds of printed records, though, it can be tedious to flip through report pages looking for a particular line item, even though they’re in alphabetical order.
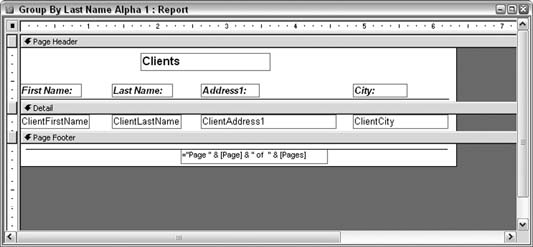
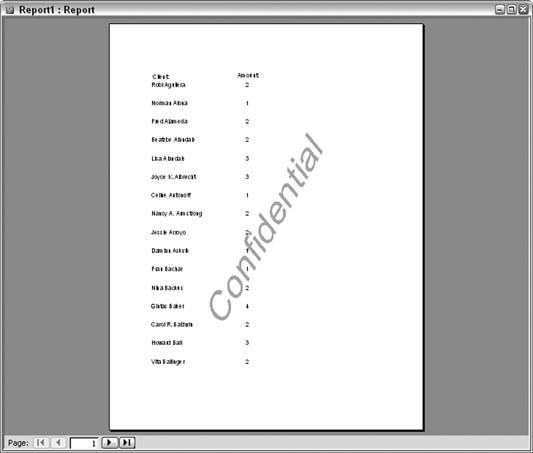
A neat thing to do is to segregate the records on a report alphabetically. Figure 4-1 shows a page from a report in which sorted records list repeatedly with no such segregation or break. The records are sorted—no question on that score—but the layout makes it challenging to flip to the approximate area you need to find.

The report’s design is straightforward. The details section contains the fields that become the line items. The report in this format doesn’t use groups, and that is why it is monotonous to look at. Figure 4-2 shows the design of the report.
Segregating by Letter
A way to break up the endless line-item listing is to add a group to the report. Figure 4-3 shows how the report’s design has been altered to include a group.
The group is based on the ClientLastName field, which, of course, is the field being sorted on. Here are a few key points about how this group is being used:
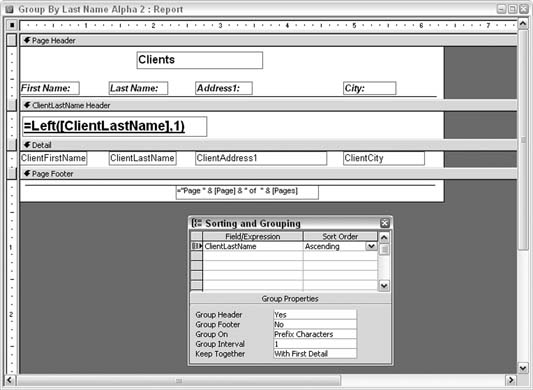
The group has a header. A footer isn’t required. In the Sorting and Grouping dialog box, Group Header and Group Footer are set to Yes and No, respectively.
In the Sorting and Grouping dialog box, the Group
Onproperty is set toPrefix Characters, and theGroup Intervalproperty is set to1.In the group header itself, an unbound text box has been inserted, and its
Control Sourceproperty is set to an expression.
When the report runs, the expression in the unbound text box forces the group break to occur on the letters of the alphabet, instead of on each occurrence of a last name. As a result, all the As are together, all the Bs are together, and so on. You accomplish this by using the Left function to return the first letter:
=Left([ClientLastName],1)
Figure 4-4 shows how the report segregates by letter.
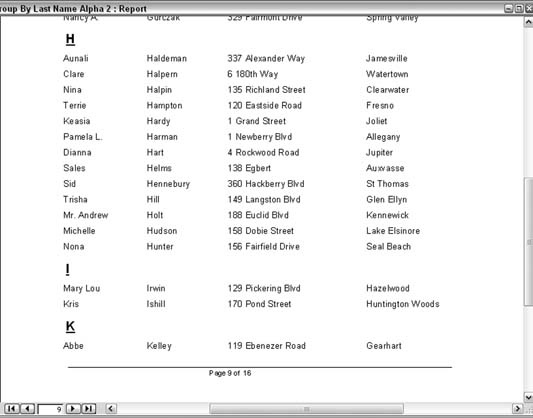
The larger font, bold, and underline settings make the distinctions visually clear when thumbing through a report.
Hacking the Hack
Note that on the report page shown in Figure 4-4, none of the clients’ last names start with the letter J. The fact that some records don’t exist could be vital news to someone. I can just hear the boss yelling, “What happened to the Johnson account?” Such a reaction is based on expecting to see something that isn’t there. The flip side to this is that missing records might be identified only by pointing out that no records have met a condition.
In particular, it would be useful if the report stated that no records were found for the letter J. We need a way to still display the alphabetic letter on the report, but in the current design, this won’t ever happen. Any alphabetic letters that currently appear on the report are there because records in which the last name starts with the letter J do exist.
To get all letters to appear on the report, regardless of whether records beginning with those letters exist, include somewhere in the design a list of all the letters to be compared against. The approach used here is to relate the client table with a table of the letters, instead of basing the report on just the client table.
A table is added to the database with just one field: Letter. The table contains 26 records, for the letters A through Z. Figure 4-5 shows the table, named tblLetters.

It’s not a bad idea to include the digits 0–9 in the table as well, especially if you’re working with the names of companies.
The report’s Record Source property was previously set to the client table (tblClients). Now, though, the report’s record source will be based on a query. Here is the SQL statement:
SELECT tblClients.ClientFirstName, tblClients.ClientLastName,
tblClients.ClientAddress1, tblClients.ClientCity, tblLetters.Letter
FROM tblClients RIGHT JOIN tblLetters ON
left(tblClients.ClientLastName,1) = tblLetters.Letter;
A key point about this statement is that a RIGHT JOIN is used to relate the tables. This ensures that all records from the letters table (tblLetters) will be present. In other words, every letter will be available to the report, even when no last names start with that letter.
The report’s design also needs a slight change. The group is no longer based on the last name; instead, it’s based on the Letter field. Also, a new expression is used in the unbound text box. Figure 4-6 shows these changes.

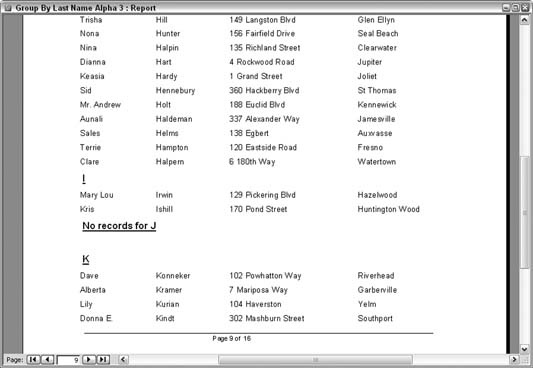
The expression in the text box returns one of two possible statements. When at least one record contains a last name starting with a given letter, the letter is displayed. When no records contain a last name starting with the given letter, a message is displayed that no records were found for that letter. You accomplish this using the IIF and Count functions:
=IIf(Count([ClientLastName])>0,[Letter],"No records for " & [Letter])
As a result, this report has all the alphabetical letters as group headers, regardless of whether any records match, as shown in Figure 4-7.
You can adapt this hack in a number of ways. For example, you can hide the details section, and you can alter the expression in the header to print a line only when no records exist. This alters the report to list exceptions only.
Create Conditional Subtotals
Split a grand total into pertinent business summaries using running sums and expressions.
A common request is to create two sets of totals for comparison. This, by itself, is reasonable in a report design; you can set a group that is based on a field that breaks on different values. A perfect example is data based on a year. If the report includes a Year field, you can include subtotals in the group footer. That is, you can get a summary (of whatever other fields) for each year.
But when you throw in the need to report totals on more than one condition, things start to get a bit messy. You can create two groups, but you must decide which group nests inside the other. That decision isn’t always clear-cut. Added to this are various layout options. If you want to arrange these subtotals in any fashion other than underneath each other, you are out of luck—that is, unless you use running sums and calculated controls.
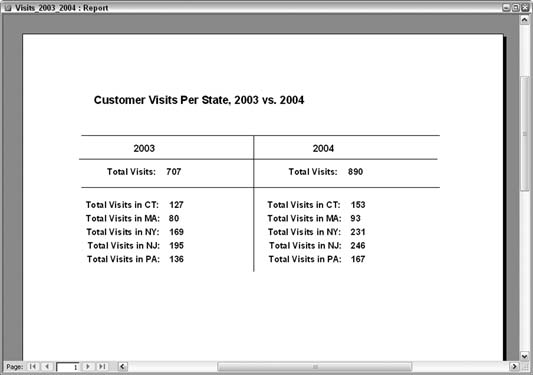
Figure 4-8 shows a report that displays grand totals for each year and, underneath them, the yearly grand totals separated by each state’s contribution.
Tip
Of course, you can create a report such as the one in Figure 4-8 using other methods; for instance, you could use a subreport instead. The running sums method outlined in this hack is only one method available for reporting totals on more than one condition.
This hack uses an example of a veterinary practice, which has data about visits to the practice over two years and clients who come from five different states. The report’s record source is based on a Union query that combines two identical Select queries—identical, that is, except that one uses records for 2003 and the other uses records for 2004. The report’s record source, therefore, is the following statement:
SELECT * FROM qryServiceDates_2003
Union SELECT * FROM qryServiceDates_2004
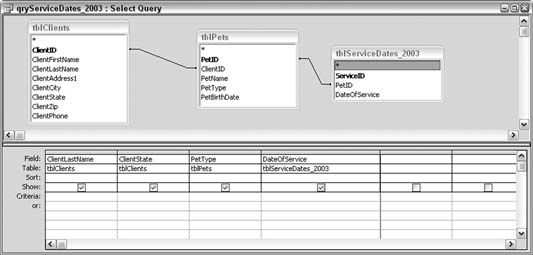
Figure 4-9 shows the qryServiceDates_2003 query. Each customer has zero or more pets, and each pet has zero or more visits. Bear in mind that the report reports on visits only. The type of pet isn’t relevant, but the data model calls for the pets table (tblPets) to be included.
Using Running Sums
This report processes hundreds of records, but only the totals appear because the detail section’s Visible property has been set to false. Even so, the details section plays a vital role in housing a set of text boxes that are used for running sums. Figure 4-10 shows the report design.create two sets of totals for comparison. This, by
In addition to actual data fields, the detail section contains 10 unbound text boxes, all of which have the
Running Sum property set to Over All, as shown in the property sheet in Figure 4-10.
The 10 text boxes handle the 10 possible conditions. The data comprises two years and five states, for a total of 10 possible subtotals. Each unbound text box has a calculation for its control source. For example, the txtCT2004 text box contains this expression:
=IIf([ClientState]="CT" And Year([DateOfService])=2004,1,0)
This statement gets the running sum to increment only when the state is CT and the year is 2004. Each text box works in this way, with each incrementing on some variation of the two conditions, state and year.
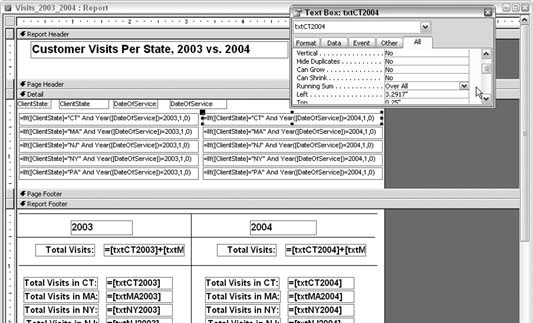
The names of these text boxes are vital because they are referenced in other controls in the report footer. The names are txtCT2003, txtCT2004, txtMA2003, txtMA2004, and so on. All in all, five states are used: CT, MA, NY, NJ, and PA.
The report footer contains two areas, one for the summary of each year. The areas are separated visually with some line controls. There is no real setting to split the report footer.
All the text boxes in the report footer are unbound, and they reference the text boxes in the detail section. For example, the report footer text box that displays the total for CT for 2003 simply references the txtCT2003 running sum text box, with this statement:
=[txtCT2003]
The 10 summaries in the report footer that display a sum based on year and state all work in the same way. Each references a single text box from the detail section. The two grand totals in the footer, the ones based on total year, simply sum the associated five text boxes from the detail section. For example, the text box that displays the grand total for 2004 has this statement for its control source:
=[txtCT2004]+[txtMA2004]+[txtNY2004]+[txtNJ2004]+[txtPA2004]
By calculating totals in the detail section and then referencing those running sum text boxes, you can arrange the report’s layout any way you wish.
Hacking the Hack
The data model shown in this hack (see Figure 4-9) includes a table with pets. What if the user wanted to report by year, state,
and pet? Assuming the data includes 10 types of pets (cat, dog, bird, and so on), you would have 100 variations of conditions: that is, 2 years times 5 states times 10 pet types. You could create such a report using the steps described in this hack, but this would be tedious. A better approach with such a large number of conditions is to base the report on a Crosstab query. The example in “Summarize Complex Data”
[Hack #45]
uses the data model from this hack to show how such a query works.
See Also
“Summarize Complex Data” [Hack #45]
“Use Conditional Formatting to Point Out Important Results” [Hack #30]
Use Conditional Formatting to Point Out Important Results
Not only can you use the built-in conditional formatting feature, but you also can roll your own with a little VBA!
Why not add a little impact to important results or facts about your data? Instead of having a report display results textually, use a bit of formatting based on conditions in the data to draw readers’ eyes directly to the important news. If the news is good, you can take all the credit and maybe get a promotion. If the news is bad, you can always use the “Don’t shoot the messenger” line.
“Create Conditional Subtotals” [Hack #29] demonstrates how to create a report based on data that covers two years, with each year broken out as its own total. This is great for common analyses in which you’re comparing results from one year to the next to see how much the data has changed (including whether the change was positive or negative).
Some reports, however, also print a third column indicating the percent change when the two values are compared. Although this isn’t covered here, you can apply the conditional formatting explained in this hack to the percent change text boxes if you choose to include them.
Standard Conditional Formatting
Access provides a nice conditional formatting utility. With it you can easily change font attributes, foreground color, and background color properties when a specified condition is met. Figure 4-11 shows the Conditional Formatting dialog box. In this example, expressions have been entered for the conditions. Alternatively, you can base the conditions on actual data values.

Use the Format → Conditional Formatting… menu to display the Conditional Formatting dialog box. The Conditional Formatting dialog box manages formatting for one control at a time. Therefore, you must select a control before you can access the menu. Also, the menu item is disabled unless conditional formatting can be applied to the selected control.
Figure 4-11 shows the conditional formatting that has been set up for the txtCT2004Total text box. In particular, for this control the following three formatting options have been set, to test for the difference in percentage between the 2003 and 2004 amounts:
- Greater than 20%
([txtCT2004]-[txtCT2003])/[txtCT2003]>0.2
- Greater than 15% and equal to or less than 20%
([txtCT2004]-[txtCT2003])/[txtCT2003]<=0.2 And ([txtCT2004]-[txtCT2003])/[txtCT2003]>0.15- Greater than 10% and equal to or less than 15%
   ([txtCT2004]-[txtCT2003])/[txtCT2003]<=0.15 And _
        ([txtCT2004]-[txtCT2003])/[txtCT2003]>0.1
Each condition provides different formatting based on selections made in the Conditional Formatting dialog box. This works fine, but the three-condition limit might require another approach.
Conditional Formatting the VBA Way
By placing code into the report’s event stubs, you can provide robust formatting—beyond what the standard conditional formatting feature allows. The standard formatting has two major limitations: you can test for three conditions only, and some of the formatting options aren’t available.
The workaround is to just code up your own using VBA. Figure 4-12 shows the report; note that Total Visits for 2004 is set in italic and has a border around it.
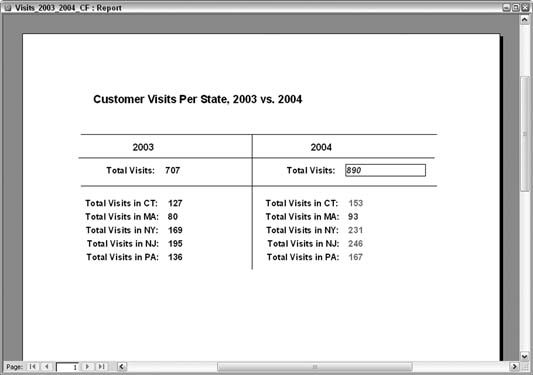
This formatting was applied because a condition was met, based on what was tested in the code. This code has been placed in the report’s ReportFooter_Print event:
Private Sub ReportFooter_Print(Cancel As Integer, PrintCount As Integer)
  Dim visits_change As Single
  visits_change = ([txt2004Total] - [txt2003Total]) / [txt2003Total]
  Select Case visits_change
   Case Is >0.25
   Me.txt2004Total.Properties("ForeColor") = vbBlue
   Me.txt2004Total.Properties("Borderstyle") = 1
   Me.txt2004Total.Properties("BorderColor") = vbBlack
   Me.txt2004Total.Properties("FontItalic") = 1
  Case Is <= 0.25, Is > 0.2
   Me.txt2004Total.Properties("ForeColor") = vbBlue
  Case Is <= 0.2, Is > 0.15
   Me.txt2004Total.Properties("ForeColor") = vbGreen
  Case Is <= 0.15, Is > 0.1
   Me.txt2004Total.Properties("ForeColor") = vbMagenta
  Case Is <= 0.1, Is > 0
   Me.txt2004Total.Properties("ForeColor") = vbBlack
  Case Is <= 0
   Me.txt2004Total.Properties("Borderstyle") = 1
   Me.txt2004Total.Properties("BorderColor") = vbRed
 End Select
End Sub
The code tests the percentage change and then uses a Select Case statement to apply different formatting based on the percentage change. Six conditions are provided, but you aren’t limited in terms of number of conditions; use whatever number makes sense for your application. Also, the type of formatting is open to whatever you can control through VBA, which is just about everything.
Provide a Direct Link to a Report
Provide a desktop shortcut to a report so that users can completely skip the process of starting up the database.
What can be easier for a manager or a database-challenged individual than just skipping the process of opening the database? You can easily provide this functionality by including a shortcut directly to the report. The shortcut goes on the user’s desktop.
Creating a Shortcut
To create such a shortcut, first open the database, and then right-click the desired report. The context menu includes a Create Shortcut… menu item, as shown in Figure 4-13.
When the user clicks the Create Shortcut… menu item, a dialog box pops up for her to select where to place the shortcut. The user’s PC desktop will probably be filled in as the default, as shown in Figure 4-14.
After the user clicks the OK button, the desired shortcut is created. Clicking the shortcut starts up the database and opens the report, but unfortunately, the database stays open.


Printing a Report and Closing the Database in One Click
A better approach is to enable the user to click the shortcut, print the report, and close the database afterward, all automatically via a single click. Sounds like a macro to me!
Figure 4-15 shows a simple macro that prints a report and then closes the database.

All that is necessary is the action to open the report. It’s important that View is set to Print, not to Print Preview or Design. This sends the report directly to the printer instead of displaying it. The follow-up Quit action closes the database.
Note that if the report is usually generated with selections made on a form, you should create a shortcut to the form instead. You can create such shortcuts for any database object.
Protect Intellectual Property
Prevent misuse of confidential and copyrighted material by printing watermarks on reports.
If someone is bent on taking your intellectual property, you have no fool-proof way to prevent it. However, common sense dictates that we do our best to protect our assets. Often, putting some wording on the page or in the report header or footer saying the material is confidential serves this need. However, this method doesn’t necessarily make the message stick out like a sore thumb.
An additional measure is to put watermarks on reports. A watermark sits right within the body of a report, page after page. It ends up underneath the actual text and is somewhat transparent; that way, it doesn’t obscure the text, but it is evident enough to get the message across in a big way.
Figure 4-16 shows a report in which a watermark sits mixed in with the data. The word “Confidential” stretches diagonally from the lower left to the upper right. The text appears to sit on top of the watermark.

Making the Watermark
To create a watermark, you need to create a graphic that you will set to the Picture property on a report. You will need a graphics program to create a decent watermark. Several good graphics programs are available. I use an excellent, affordable program called Paint Shop Pro by Corel Corp. (http:// www.jasc.com.) Whichever graphics program you use, it must be able to do the following:
- Work with text as a graphic
You want to be able to stretch and orient the data.
- Apply transparency settings
The final graphic should be in the ballpark of 75% transparent. It’s best to determine the actual setting via trial and error.
- Specify the size of the graphic
When creating the graphic, it’s important to make it almost as large as the paper you are using. Whatever size you make the graphic is the size it appears on the report (based on a property setting described later in this hack).
- Save the graphic as a .jpg, .bmp, and so on
You can use any file format that can be used when tapping the
Pictureproperty on the report.
Creating such a graphic is beyond the scope of this hack, but for your information, the graphic in Figure 4-16 is 70% transparent and was saved as a .jpg file. The graphic is about 4 x 7 inches. Figure 4-17 shows how the graphics file appears on its own.

Using the Watermark
Once you save the watermark as a file, go into the report’s Design mode. In the property sheet, click the
Picture property, and browse to select the graphics file, as shown in Figure 4-18.

A few other relevant settings work with the Picture property:
- Picture Type
You have a choice of Embedded or Linked. Embedded is the correct choice here. Linked will attempt to open the graphic separately, which isn’t the point of using a watermark.
- Picture Size Mode
The choices are Clip, Stretch, and Zoom. Each treats how the graphic is placed on the report in a different manner. Experimenting with these settings is the best way to understand how they work. However, as mentioned earlier, if you sized the graphic correctly when you created it, use the Clip setting here. Following this approach helps to avoid having to guess your way through the picture’s placement on the report.
- Picture Alignment
You have five choices: Top Left, Top Right, Center, Bottom Left, and Bottom Right. Most people choose Center, but you might find a different setting serves your needs.
- Picture Tiling
The settings are Yes and No. The No setting places the graphic once on the page. The Yes setting tiles the graphic, which creates a repeating pattern. Try both of them to see which is better for you. The Yes setting makes a busier-looking watermark, but perhaps that is what you want.
- Picture Pages
This lets you designate on which pages the watermark will appear. The choices are All Pages, First Page, and No Pages. I hope you don’t choose No Pages, or you won’t see your watermark!
You also might have to change the Back Style property on the report. You might have to do this because the watermark appears under the text, and text boxes can take up more room than the actual text they display. Figure 4-19 demonstrates this dilemma. In the report, the rectangular shape of the text box covers up part of the watermark. You don’t actually see the text box, but the rectangular shape becomes apparent when it’s contrasted with the watermark underneath.

To avoid this behavior, go into the design of the report. For any text boxes that sit over the watermark, change the Back Style property from Normal to Transparent. This forces the text boxes to display just the text, which is exactly the effect you want. Figure 4-20 shows how the report appears when the text boxes are transparent.
Create a Slideshow in Access
Use images and the OnTimer event to create a controllable visual show.
Incorporating pictures into Access is a great thing. It provides a way to depict products, personnel, or any other items you want to show via pictures instead of via a textual description. Typically you do this by storing the paths to graphics files in a table field. In this manner, the graphics and the table data are connected. On a form, when a record is displayed, an image control can be updated with the graphic found at the related path.
This hack doesn’t imitate such a data-based scenario. Instead, it works with an unbound form to display unbound graphics. You can mix the functionality described here with a data-bound solution. For example, while a form displays database records, the unbound graphics functionality could be incorporated into the form header or footer.
This hack uses the image control to display the graphics and shows how to update the graphics being displayed on a periodic basis, typically a few seconds. The hack also shows you how to let users drive the graphic display update on demand.
The Graphics
For the example in this hack, all the graphics are in the same directory. The directory is hardcoded in the code, but the code can easily be updated to handle multiple directories, passed paths from a dialog, and so on. For now, let’s say that a group of .jpg files sit in a directory, as shown in Figure 4-21.

Note that all the files don’t have to be in the .jpg format. You also can use other graphics types, such as bitmaps (.bmp) and TIFF (.tif) files (this is also specified in the code).
The Form Design
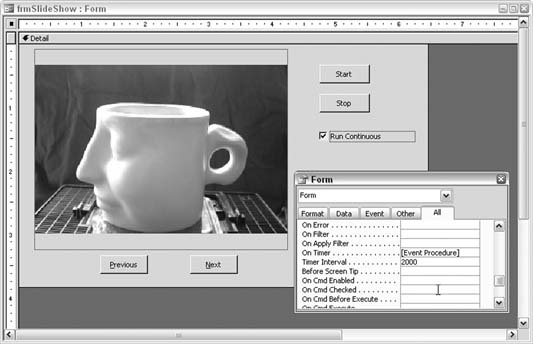
Figure 4-22 shows the form in Design mode. It contains just a few controls: some buttons, a checkbox, and the image control. The image control has an initial picture, but this is overridden as the slideshow runs.
As you can see, the user can either run an automated slideshow or navigate through the graphics manually. The Next and Previous buttons allow the user to move forward and backward through the graphics while not in an automated mode. These buttons just cycle through a VBA collection of paths to the graphics, and the user can use them to update the image control’s Picture property.
The checkbox is used to set the mode. If it’s checked, the slideshow runs. Regardless of whether the user lets the graphics change automatically, she must press the Start button. This is a nice feature because it gives the user control over when to start the show. After all, someone might still be getting popcorn!
However, because there is a Start button, it makes sense to also have a Stop button. Clicking the Stop button merely changes the value of a Boolean-type public variable, named stop_show, from false to true.
The Code
A vital piece of this application is the use of the form’s OnTimer event. In the following code, note that the Timer Interval has a setting of 2000. This tells the form to fire its OnTimer event every two seconds. You can change this value to accommodate other intervals:
   Option Compare Database
   Public stop_show As Boolean
   Public pixpaths As Collection
   Public pixnum As Integer
   '
   Private Sub Form_Open(Cancel As Integer)
   '
   'set initial properties
   '

	  Me.chkRunContinuous = False
      Me.cmdNext.Enabled = False
      Me.cmdPrevious.Enabled = False
   End Sub
   '
   Private Sub cmdStart_Click()
   '
   'read paths of graphics into a collection
   'displays the first graphic
   '

	 stop_show = False
     If Me.chkRunContinuous = False Then
       Me.cmdNext.Enabled = True
       Me.cmdPrevious.Enabled = True

    End If
    'replace with your path!!
    pix_path = "C:Product Photos"
    Set pixpaths = New Collection
    Set fs = Application.FileSearch
    With fs
      .LookIn = pix_path
      .FileName = "*.jpg"
      If .Execute() > 0 Then
	    For i = 1 To .foundfiles.Count
          pixpaths.Add Item:=.foundfiles(i)
        Next i
      Else
	    MsgBox "No files found!"
      End If
    End With
    'load first pix
    Me.imgPixHolder.Picture = pixpaths(1)
    pixnum = 1
  End Sub
    '
    Private Sub cmdNext_Click()
    '

	  'advances to the next graphic
	  'cycles forward through collection
      '

        If pixnum = pixpaths.Count Then
          pixnum = 1
        Else
          pixnum = pixnum + 1
        End If
        Me.imgPixHolder.Picture = pixpaths(pixnum)
      End Sub
      '
	  Private Sub cmdPrevious_Click()
	  '
	  'displays the previous graphic
	  'cycles backward through collection
	  '

        If pixnum = 1 Then
          pixnum = pixpaths.Count
        Else
          pixnum = pixnum - 1
        End If
		Me.imgPixHolder.Picture = pixpaths(pixnum)
      End Sub
	  '
	  Private Sub cmdStop_Click()
	  '
	  'sets global variable to false
	  'disables Previous and Next buttons
	  '

        stop_show = True
		Me.cmdNext.Enabled = False
		Me.cmdPrevious.Enabled = False
      End Sub
	  '
	  Private Sub Form_Timer()
	  '
	  'if the mode is to run continuously and the
	  'stop button has not been clicked, then keep cycling graphics
		If Me.chkRunContinuous = True _
		 And stop_show = False Then cmdNext_Click
     End Sub
This code module contains a handful of routines. The form’s Open event builds a collection of paths to the graphics, found within a specified directory. The specific directory and graphics file type are hardcoded. The FileSearch object uses these values to find the graphics files. You can expand this to look in more than one directory and/or for more than one file type. Read up on the FileSearch object in the Help system or on the Internet for more information.
The chkRunContinuous checkbox determines how the application will run. If it is unchecked, the Next and Previous buttons are used to navigate through the graphics. When the user clicks either button, the index to the collection is increased or decreased, and the Picture property of the image control is updated to the particular collection item.
If the user checks the chkRunContinuous checkbox, the Next and Previous buttons are disabled, and the slideshow runs on its own. The time that elapses between each graphic is based on the Timer Interval. The slideshow will run continuously until the user clicks the Stop button. When the Stop button is clicked, it sets the stop_show variable to true. This causes the Timer event to skip updating the graphic because the update occurs only when stop_show is false.
Hacking the Hack
You can enhance this basic slideshow in several ways. One thing to consider is that the graphics have no supporting text. Keeping an unbound approach, one way around this problem is to provide a way to display details about a graphic when it is clicked. The image control has a Click event, which you can use to return the value of the Picture property, as shown in Figure 4-23.

Because the picture being displayed can provide its name, you can use the image control’s Click event to find and display anything pertaining to the particular graphic. For example, because the graphic’s filename can be isolated, you can gather additional information about the graphic from a text file or other source.
Of course, another approach is to simply bind the image control to paths stored in a table. Another field can then supply textual information about the picture in a text box. In fact, this is the more standard approach. I didn’t point this out earlier because it requires more work to update the paths in table records than just once in the code. Also, if you adapt the code to work with a user-supplied path, of course the unbound approach makes more sense because there would be no preentered paths.
Play Videos in Access Forms
Deliver your message the multimedia way with the Windows Media Player.
Here’s a really neat way to spice up your Access applications: play movies! Although this might seem a little too entertaining for “real” business use, consider that movies are one of the best vehicles for delivering information. You can incorporate movies into your database design in several ways. You can relate movie clips to data records, in which case the associated movie runs when a record is displayed. You can also have an unrelated movie play on demand (requiring a button click or some other way to initiate the movie to play).
To play movies you need to incorporate a control that can handle movie files. A number of these are available, most notably Windows Media Player, which is what this hack uses.
Putting the Player on the Form
First, you must add Windows Media Player to the form. Because this isn’t a standard control, you must access it using the More Controls button on the toolbox, as shown in Figure 4-24.
Clicking the More Controls button displays a lengthy list of controls and libraries. Scroll down to find Windows Media Player, as shown in Figure 4-25.
After you click the control in the list, draw it on the form. Figure 4-26 shows a form in which Windows Media Player, a listbox, and a command button have been inserted. In this configuration, the listbox displays a list of movies from which to select; clicking the button plays the selected movie.
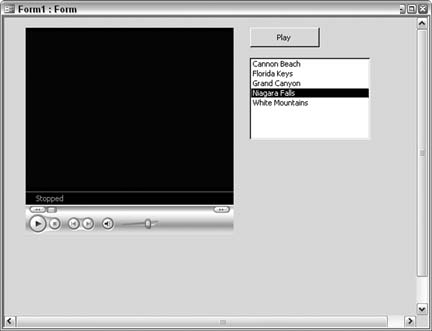
In Figure 4-26, the listbox is populated with paths to .mpg movie files. The listbox has two columns. The first column is the bound column, which holds the paths to the movie files. Its width is set to zero, so it isn’t displayed to the user. Instead, the second column, which contains friendly names for the movies, is displayed. When the user has selected a movie, she simply presses the command button to start the movie. This effectively is a simple playlist. Figure 4-27 shows the form in View mode before playing a movie.


Playing a Movie
So, just how does a movie play? Actually, it’s quite simple: the path to a movie file is handed to Windows Media Player’s URL property and the movie starts playing automatically. This example shows the button’s code; it takes the path from the listbox and hands it to the player:
  Private Sub cmdPlayMovie_Click()
   If Not IsNull(Me.listMovies) Then
    Me.WMPlayer.URL = Me.listMovies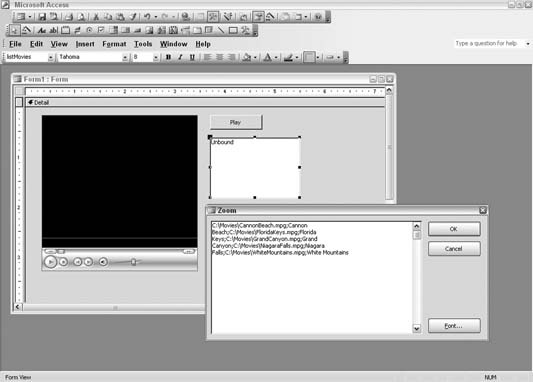
		Else
		 MsgBox "First select a movie"
		End If
   End Sub
Starting, stopping, fast-forwarding, rewinding, and pausing are functions built into the player. These functions are available through the buttons on the player itself. This allows the user to work the movie in any needed fashion.
Windows Media Player has many events you can hook into. A little thought and creativity will go a long way toward integrating movies into your applications. This hack shows the basic way to implement a movie, but you can code around and work with the player in myriad ways.
See Also
Windows Media Support Center (http://support.microsoft.com/default. aspx?scid=fh;en-us;wmp)
View Reports Embedded in Forms
Preview reports, whether current or historical, directly on the form you are working on.
Access is one of the most powerful reporting tools on the market. Beginning with Access 97, Microsoft introduced the ability to create snapshot reports that you can view with the free Snapshot Viewer, available for download from Microsoft (search for ActiveX Snapshot Viewer at http://www. microsoft.com/downloads).
Access database application developers can use the ActiveX Snapshot Viewer to customize the look and feel of their applications by displaying reports embedded in forms.
Creating the Form
The form is composed of a combo box and the ActiveX Snapshot Viewer. The combo box contains a list of all the reports in the database. When the form opens, the Load event executes the following code to fill the combo box with a listing of all available reports:
		Private Sub Form_Load( )
		Dim obj As AccessObject, dbs As Object
			Dim strList As String
			Set dbs = Application.CurrentProject
			For Each obj In dbs.AllReports
			    strList = strList & obj.Name & ";"
			Next obj
			cboReports.RowSourceType = "Value List"
			cboReports.RowSource = strList
		End Sub
To add the ActiveX Snapshot Viewer, select More Controls from the toolbox, as shown in Figure 4-28, scroll down, and select Snapshot Viewer Control 11.0. Note that depending on your version of Access, your control might be earlier than the 11.0 version.

Size the Snapshot Viewer Control to an approximate width that matches the size of the paper on which you will print the report. This helps avoid having to scroll left and right to see a report once it is displayed. Figure 4-29 shows the form design with the Snapshot Viewer Control in place.

After adding the Snapshot Viewer Control, place the following code in the On Change event of the combo box. Make sure the name of the Snapshot Viewer on your form matches the name in the code:
		Private Sub cboReports_Change()
			DoCmd.OutputTo acOutputReport, cboReports, acFormatSNP, _
						Application.CurrentProject.path & "	emp.snp"
			SnapshotViewer1.SnapshotPath = _

					 Application.CurrentProject.path & "	emp.snp"
			End Sub
In this example, a temporary snapshot report is created, called temp.snp, and it is placed in the directory in which the database is running. The temp.snp snapshot report is then loaded into the Snapshot Viewer. This temp.snp file is replaced each time a new selection is made. If you are running from a shared location with a multiuser database, make sure you store the temporary snapshot file on the local machine, not on the network; this avoids any multiuser issues.
As shown in Figure 4-30, the final form displays an invoice report that was selected from a combo box.
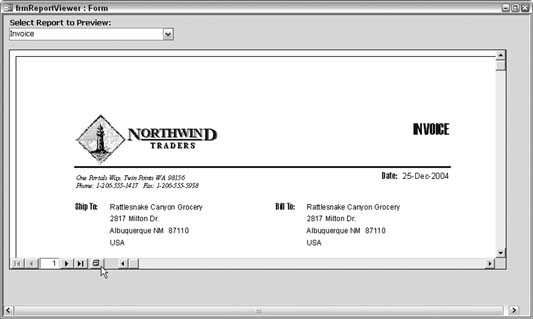
This hack gives the application one place for users to select reports and view them before printing. Also note that the ActiveX Snapshot Viewer includes a Print button next to the navigation buttons.
Hacking the Hack
An advantage to saving reports as snapshots is they are static, as opposed to the dynamic reports you get with report objects in Access. You can save those reports in a folder and view them as historical reports with the Snapshot Viewer. You also can change the code to have a combo box that displays the report names from a given directory, which allows the user to select historical reports to view with the Snapshot Viewer.
—Steve Huff
Put Line Numbers on a Report
Use the Running Sum property to include an incremental counter in your report.
Sometimes you might want to include line numbers on a report. This is fairly easy to do. The trick is to include an unbound text box, set its Running Sum property to Over Group or Over All, and set its Control Source to the starting value.
Figure 4-31 shows a report in Design mode. The text box on the left is unbound and will display an incremental value when the report runs. The property shows how its control source is set to =1, the beginning value.

Figure 4-32 shows how the report looks when run.
The value placed in the Control Source property not only provides the seed value, but also serves as the increment value. When a value of 1 is used, the counting starts at 1 and increments by 1. You can use other values as well. For example, a value of 10 might be desirable, in which case the counting starts at 10 and increments by 10, as shown in Figure 4-33.


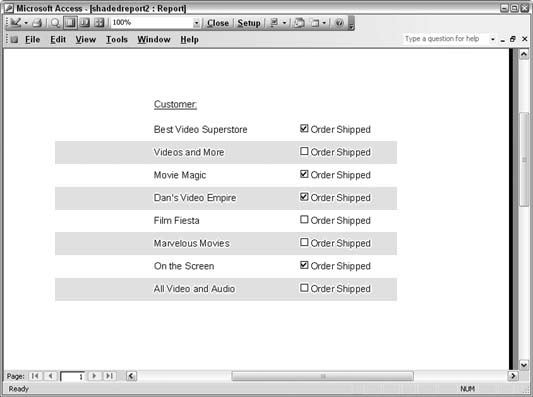
Shade Alternating Lines on a Report
Go for the readability factor. Use alternating shaded lines to make a more pleasing presentation.
A quick way to make reports easier to read is to shade every other line. Although no direct property or method provides this feature, you can achieve the look with a little planning. To accomplish this, use an unbound text box to keep an incremental value. As line items are processed, the incrementing value toggles between even and odd. You can then use this toggle’s values to your advantage.
The background color property of the report’s details section is changed, depending on the value of the incremental running sum. When the value is odd, one color is applied. When the value is even, another color is applied.
You have to set a few properties for this to work:
The Code
In the details section’s Format event, place this code:
	Dim even_odd As Integer
	Me.Detail.BackColor = vbWhite
	even_odd = Me.txtRunningSum Mod 2
	If even_odd = 0 Then
	 Me.Detail.BackColor = vbYellow
	End If
You use the Mod operator to determine whether the current running sum value is even or odd. Mod returns the remainder of a division operation. When an even number is divided by 2, the remainder is 0. The even_odd variable holds the result of the Mod operation.
The Results
The routine starts out by defaulting the background color to white. If the even_odd variable isn’t 0, the background color is changed to yellow.
Figure 4-34 shows how the report looks when run.
Hacking the Hack
A couple of alternatives are available. If, for example, you have to shade every third line, you can test whether the running sum is a multiple of 3. Any multiple of 3 divided by 3 has no remainder.
Alternatively, you can use the RGB function to control the color. RGB is an acronym for red, green, blue. The function works by blending the three colors, each as a number between 0 and 255. Look up the RGB function in the Access Help system; it’s a great function to get familiar with. To use it in this hack, just change the BackColor property, like this:
Me.Detail.BackColor = RGB(200, 200, 200)
You will have to experiment with different settings, but here’s a guide you can follow:
Setting all three
RGBargument functions to0creates black.Setting all three
RGBargument functions to255creates white.
All other colors are available by applying varying values to the arguments.
Save Paper by Reducing Whitespace
Use the Can Shrink property to condense your reports.
Empty data fields in a long report can pose a problem when it comes time to print the report. Imagine a list of 1,000 contacts, and only half have a phone number entered into a phone number field. When you designed the report, you included the phone number field for contacts that have a phone number. However, when you print the report, you see 500 empty spaces representing the phone number fields of customers without phone numbers. When other data fields are empty as well, the situation just gets worse.
All told, this whitespace can account for 50 or more extra pages in the report, depending on how the report is laid out. Figure 4-35 shows a report that suffers from this problem. Some contact information is missing, yet room is still set aside for it.

Figure 4-36 shows the design of the report. The detail section contains a group of fields. As shown in Figure 4-35, some of the fields are empty.

On the property sheet, set the Can Shrink property to Yes. Apply this to the fields in the detail section and to the detail section itself.
Tip
When you use the Can Grow or Can Shrink properties, you must apply the settings to both the bound controls and the detail section.
With Can Shrink set to Yes, any empty data fields on this report won’t take up space. Figure 4-37 shows the improved report.

In that figure, you can see some contacts are missing a phone number, and others are missing all the data. In both cases, the amount of empty space shrinks. As you can see when comparing the report in Figure 4-37 with the one in Figure 4-35, even the first page displays more contacts. As wasteful whitespace is dropped, the number of pages on the report is reduced.
The Can Grow property provides the opposite functionality as well. When designing a report, place controls where they make the most sense. Occasionally, you might have more data than you can display in the field, given the size of the bound control. Setting Can Grow to Yes lets the field expand as needed to print all the data.
Include the Date, Time, and Page Count
Use common expressions to quickly insert necessary header and footer information.
It’s always helpful to include a timestamp on a report, indicating when it was printed. This might be the only clue as to whether the information is up to date. Including page counts is also important. Having dozens of printed pages and not knowing the order in which they go can be quite frustrating.
Access provides an easy way to include these necessary and sometimes overlooked items. The Expression Builder contains a list of common expressions. While designing a report, the best way to display the Expression Builder is to first place an unbound text box in the report header or footer (or wherever makes sense) and then click the ellipses (…) next to the control source for the unbound text box. This opens up the Expression Builder, shown in Figure 4-38.
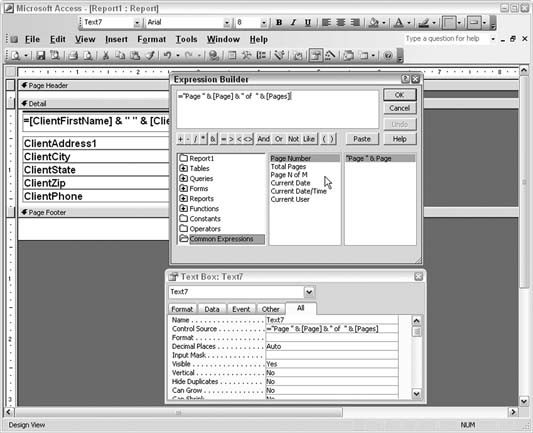
The available common expressions include page numbers, date and time, and current user. The Page N of M setting is particularly useful because it not only states the page number but also provides a message such as "Page 15 of 40.” Once you’ve selected the expression you want, click the OK button to insert the expression into the unbound text box. When the report runs, the page numbering (or other common expression) is included on the report.