Inventory and Cost of Goods Sold
5.1 Accounting for Inventory
5.2 Determining Inventory Quantity
5.3 Figuring Inventory Costs
5.4 Inventory Valuation Methods
5.5 Cost of Goods Sold

Major Inventory Issues
Classifying Inventory
Employing Inventory Systems
This subchapter offers a quick primer on the major issues related to inventory. We take you through how it’s classified and accounted for and help you choose an inventory system that works for your company.
Major Inventory Issues
Unless you’re in the service business, inventory is likely to be one of your company’s most significant assets. Inventory systems can be intimidating in their complexity, yet managing inventory isn’t that difficult if you stay focused on the major issues—valuation and costing.
Inventory represents items held for resale or product that will go into the manufacturing of goods to be sold.
Two separate accounting systems are reserved for inventory, and you have several different methods you can use to value it, the most common of which we deal with in this subchapter. But the basic equation involved in tracking this asset is a simple one:
Quantity × Cost = Inventory value
To figure out the value of your inventory at the end of a period, you need to know how much you have in stock, by product. To determine this, you can count it in what is known as a physical inventory, or you can estimate it. Then you need to determine the cost per unit. This includes the price you paid to buy or make the product, plus additional costs that relate to getting it ready for sale, like advertising and freight costs.
These terms might be unfamiliar right now (although we hope to help you around that), but the basic idea of what you’re trying to do all comes back to this equation:
Quantity × Cost = Inventory value
Physical inventory is the process of taking an actual physical count of the items you have in inventory.
Classifying Inventory
The way you classify your inventory depends a great deal on what kind of business you own or work for. If you’re a retailer like Target or The Home Depot or a grocer like Ralph’s, you’re likely to have hundreds of very different products at varying costs, all with one thing in common—they can all be recorded as merchandise inventory. Manufacturers record inventory at different stages, depending on how far along it is in the production process.
Merchandising Inventory
Merchandisers might list inventory in a single account, but it must be owned (not consigned) and substantially ready for sale; this means the inventory does not require further processing. For example, you wouldn’t include fabric that was cut out to make dresses but not sewn together as merchandising inventory for a retail store. These items would be considered work in process until they were completed. On the other hand, a bike that requires the customer to assemble it and can be sold that way qualifies as merchandise inventory.
Following is a balance sheet for the Right Stuff Co., a retailer that sells sporting goods and equipment for the serious outdoorsman. As you can see, Merchandise Inventory is a single line item in current assets.
RIGHT STUFF CO.
BALANCE SHEET
DECEMBER 31
Current Assets
| Cash | $2,500 |
| Accounts Receivable, Net | $5,600 |
| Merchandise Inventory | $6,350 |
| Prepaid Assets | $1,200 |
| Total Current Assets | $15,650 |
| Property, Plant and Equipment | $3,200 |
| Less: Accumulated Depreciation | $600 |
| $2,600 | |
| Long-Term Receivables | $1,000 |
| Intangible Assets | $1,000 |
| Total Noncurrent Assets | $4,600 |
| TOTAL ASSETS | $20,250 |
Current Liabilities
Merchandise inventory is made up of goods bought for resale that are just that—ready to sell. Any business that sells a product that it doesn’t have to make, build, manufacture, mine, or process generally has this type of inventory on its balance sheet.
Manufacturing Inventory
Manufacturers divide inventory into three different types:
• Raw materials
• Work in process
• Finished goods
Raw materials are the components, ingredients, and parts that go into making the company’s product. The steel needed to make cars, for example, would be considered a raw material. Work in process (W-I-P) is the second stage of manufacturing inventory and consists of products partially made or assembled. For example, a truck wheel assembly or unpainted pottery would be work in process. W-I-P would include the cost of raw materials used plus any labor or overhead costs expended to date. Finished goods are just that—manufactured goods that are complete and ready for sale. Finished goods include raw material, labor, and overhead costs.
Overhead refers to expenses related to the production process, such as rent, utilities, and insurance. These costs are usually allocated based on a percentage of direct labor hours.
Occasionally, a company might set up a separate account for manufacturing or factory supplies inventory, which would include items like nails, oil, and cleaning supplies that might not be a main component of the product but are used in production. However, it’s more common for these items to be expensed and become a component of overhead.
Employing Inventory Systems
Two accounting systems are used to track inventory—the perpetual inventory system and the periodic inventory system.
The Perpetual Inventory System
The perpetual inventory system is perhaps the most accurate inventory system in terms of tracking costs in and out of inventory. Inventory records are maintained continuously, so any item purchased is immediately recorded into inventory at actual cost and any item sold is immediately deducted from inventory, again at cost (usually, the purchase price plus shipping charges). Computerized accounting operates on the perpetual inventory system and always maintains an up-to-date inventory count.
For example, Factory Flatscreen Ltd. purchased three televisions—a 51-inch screen for $800, a deluxe 65-inch for $1,900, and another deluxe 80-inch for $2,750. The entry to record these purchases into inventory would be as follows:

In the perpetual inventory system, you won’t have a separate “Purchases” account for inventory. All stock purchases are debited directly to inventory when they’re made. Freight-in, purchase returns and allowances, and purchase discounts (cash discounts earned) are also recorded directly to the inventory account.
Freight-in refers to shipping charges paid by the purchaser that become part of the cost of the product.
SEE ALSO 6.2, “Accounting for Purchases”
Companies that manufacture and/or sell high-dollar items that can easily be tracked by price frequently use a perpetual inventory system. For example, on September 6, Factory Flatscreen Ltd. sold the deluxe 80-inch television for $5,999. The company would make the following journal entries to record the sale and cost of sales and subsequent reduction in inventory:

Scanners at stores have made perpetual inventory systems cheaper and accessible to many businesses. Freight-in is debited directly to inventory. Purchase returns and all discounts are deducted directly from inventory.
SEE ALSO 6.2, “Accounting for Purchases”
The Periodic Inventory System
Under a periodic inventory system, the actual quantity of inventory on hand is determined only at the end of the period. Unlike the perpetual system, purchases of inventory are usually recorded to an actual “purchases” account, with the total in that account being transferred to inventory at the end of the month. However, smaller businesses using a perpetual system may prefer to charge purchases directly to inventory for simplicity’s sake. This is acceptable, as long as you remain consistent. We cover both approaches in this section.
SEE ALSO 6.2, “Accounting for Purchases”
Using purchases account: Cost of goods sold is not determined product by product. Instead, it’s derived at the end of the period as follows:
Beginning inventory + Purchases = Goods available for sale
Goods available for sale – Ending inventory = Cost of goods sold
As an example, let’s assume the manager of Al’s All Sports Shop has determined the store has an inventory of $8,500 on hand at the end of the month. During the period, the store purchased $4,500 of merchandise, mostly seasonal baseball gear. Inventory at the beginning of the month was $6,200. In April, the store had sales of $9,100. Using the preceding formula, we can compute the cost of goods sold for Al’s:
Beginning inventory + Purchases = Goods available for sale
$6,200 + $4,500 = $10,700
Goods available for sale – Ending inventory = Cost of goods sold
$10,700 – $8,500 = $2,200
At the end of the month, Al’s All Sports Shop would make the following entries:

At the end of the period, Al also would need to close the purchases account into inventory, because purchases is only a temporary account. The company could then recognize cost of goods sold for the income statement. This transaction is reflected in the following entry.

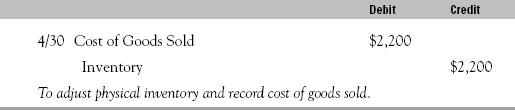
Without purchases account: If Al chooses not to use a purchases account, he would record the purchase directly to inventory.

The only entry Al’s All Sports would have to make at the end of the period would be to adjust the inventory to the inventory balance per the physical count. The difference would be the cost of goods sold for the month.
Of the two accounting systems used for inventory, the perpetual system, is perhaps the most accurate because it records and deletes the actual cost of items as they move in and out of inventory. But even with sophisticated computer systems for tracking prices of multiple goods, the perpetual system is not always practical. That’s why many companies use a periodic system, where regular verifications of actual physical count of inventory are used to determine inventory value and the cost of goods sold.
5.2 Determining Inventory Quantity
Taking Physical Inventory
Estimating Quantities
One of the basic issues of inventory valuation is determining the quantity of goods to be included. In this subchapter, you learn how to take a physical inventory and ways to monitor inventory levels when counting all your stock isn’t feasible.
Taking Physical Inventory
If you’ve chosen to use a periodic system to account for inventories, you need to physically count your inventory at the end of the period. Even with a perpetual system, you should take an annual inventory to be sure the stock listed on your books and what you have on hand is roughly equal. Small differences can be attributed to shrinkage, but large gaps may point to a more serious problem, like theft.
Shrinkage is a decline in inventory quantities due to breakage, damage, or loss.
Timing
Because it’s impractical for most businesses to count inventory monthly, the end of the year (or close to it) is the best time to take inventory. Most businesses either close for the day or choose a very slow period for doing the inventory to avoid having goods going in and out while they’re counting.
Inventory Procedures
How and when inventories are taken can vary by company, but certain standard procedures are followed each time. These are designed to enable you to get an accurate and verifiable count in the most efficient manner.
The following list of procedures can be applied in most cases:
• Choose employees who do not normally handle inventory to do the counting. Some companies hire outside contractors to ensure independence for this specific job.
• Put prenumbered tags on items as you count them. Large items should have their own tags. For smaller items, bolts, or diodes that must be weighed or measured, one tag is sufficient if all are together.
• Physically inspect any packages, boxes, containers, and locked storage sheds to be sure they contain what they say they do.
• Counts should be verified by a second employee and tags signed.
• A supervisor should make sure every item is tagged and that nothing is tagged more than once.
• All numbered tags should be accounted for.
• When the physical counting is concluded, quantities for each item should be listed on the inventory summary sheet. A separate employee should verify the accuracy of this sheet.
Following is a sample inventory summary sheet for Al’s All Sport Company, a sporting goods store. Notice how the tags are recorded in order and all are accounted for and the employee counting the items has initialed the Verified column.
AL’S ALL SPORT COMPANY
INVENTORY SUMMARY SHEET 1/15

Inventory tag 009, which was damaged during count, would be marked VOID and attached to the inventory sheet.
What to Include
An important aspect of taking inventory is making sure it’s complete and up to date. Because of timing differences in shipping and receiving, you might have to take out certain items and add others in. You’ll want to verify ownership of goods, too. Remember, only goods that are actually owned by the company on the inventory date should be included in its inventory.
Here’s a quick list of what’s included and what’s not:
Included:
Goods in transit shipped FOB shipping point
Goods at different facilities in showrooms, or at convention booths, for example
Goods out on consignment
Goods contracted for that have not yet been separated and applied to the contract
Not included:
Consigned goods
Goods in transit shipped FOB destination
Goods ordered for future delivery
FOB is a shipping term that means Free On Board; the purchaser does not pay freight until the point title changes hands.
FOB shipping point means the title to item changes hands at the point of shipping; the purchaser pays the freight charges.
FOB destination means the purchaser takes title when the goods are received; freight charges are paid by the seller.
Recording Shrinkage
Shrinkage refers to any shortages in inventory, or cases where there’s less product on hand due to loss, damage, theft, or some other unexplained reason. Companies usually account for shrinkage by writing it off to cost of sales.
Larger firms often set up a contra account known as Inventory Over and Short to record shortfalls in inventory. This account is then credited with the difference between the actual physical count and what was on the books in inventory. Overages, which happen as well due to miscounts or errors in the past, are recorded to this account as debits.
Smaller companies with lower value inventories may find it more efficient to directly expense any shortages to cost of goods sold. At the end of the period, cost of goods sold is deducted from the beginning inventory to arrive at the ending inventory.
SEE ALSO 11.2, “Adjusting Entries”
Estimating Quantities
Physical inventories are taken to verify the quantities of stock still on hand at the end of the period. But a physical count is not always feasible or practical. In these cases, businesses must find other ways to approximate ending inventory, often using gross profit or retail sales as a barometer.
The Gross Profit Method
This method is based on the assumption that over time, a company earns a fairly steady gross profit. Using this ratio as a guide allows you to estimate ending inventory.
As an example, assume Book Universe has a beginning inventory of $450,000. During the period, the company purchased additional stock of $100,000 and sold $300,000 of books at retail. The bookseller has a historical gross profit percentage of 20 percent.
| Beginning Inventory | $450,000 |
| Purchases | $100,000 |
| Cost of Goods Available for Sale | $550,000 |
| Sales $300,000 | |
| Less: Gross Profit (20% of $300,000) | $60,000 |
| Cost of Goods Sold | $240,000 |
| Ending Inventory (Estimated) | $310,000 |
SEE ALSO 13.1, “Analysis Methods”
SEE ALSO 13.2, “Assessing Profitability”
The Retail Inventory Method
The second method of estimating ending inventory uses sales price as opposed to cost to compute ending inventory. There’s some concern among accountants that it doesn’t match costs as well as the gross profit method, so we won’t go into detail on this method here.
Basically, instead of computing the cost of each product, the company takes the physical inventory using the retail prices right on the products or merchandise. This gives them the ending inventory at retail. They then deduce inventory value at cost by determining their historical ratio between cost and retail value. The gross profit and retail inventory methods are similar because both use gross profit as the indicator. The methods are most often used by retail stores.
Types of Costs
Allocating Overhead
When you’ve determined your inventory quantities in units, your next step is to apply the appropriate costs to them. In this subchapter, we explain the different kinds of costs that go into inventory and how to allocate them in a way that makes sense for your business.
Types of Costs
Inventory is valued on a cost basis. But what does that mean? Many different costs are related to inventory, but not all of them will become part of its value.
Product Costs
These are costs like freight-in for merchandising companies and labor for a manufacturing firm that makes a specific product. When determining product costs, ask yourself if an expense would disappear if the product had never been purchased or made. If the cost would disappear, it’s likely a product cost. Examples include material delivery fees, some supply and repair and maintenance expenses, and some plant electricity charges. Other than the freight, these costs are, of course, overhead.
Period Costs
General and administrative expenses like office worker salaries and business supplies are not dependent on production levels, so these are considered period costs. Even without acquiring or producing the product, these costs would still exist. Examples include salaries of administrative staff, office electricity, and insurance. These costs tend to appear in the expenses section of the chart of accounts. However, at the risk of complicating this issue, even these costs are sometimes required to be in overhead for tax purposes, although using a different formula. If you’re uncertain, check with a tax accountant.
SEE ALSO 1.4, “Establishing the Chart of Accounts”
There are three stages of inventory for a manufacturer:
• Raw materials
• Works in process
• Finished goods
Raw materials costs are generally product and freight costs. Work in process and finished goods also include costs for labor on the actual product as well as overhead (operational costs not directly related to production).
Variable vs. Absorption Costing
In variable costing (also known as direct costing), product and manufacturing costs are further divided into two groups: variable costs and fixed costs. Variable costs are expenses such as fuel or direct labor hours that fluctuate with output. Fixed costs are those that remain constant no matter what you produce. In variable costing, only variable costs are included in determining inventory value. Fixed costs are treated as period expenses.
Proponents of variable costing assert that fixed costs would be incurred anyway even if the production facilities were idle so they shouldn’t factor into inventory. It can be useful to management because it isolates those costs truly attributable to the product. However, this method is not acceptable for reporting purposes under GAAP, which requires that revenues and expenses be matched as closely as possible.
SEE ALSO 1.2, “Determining a Form of Entity”
Absorption costing (or full costing) includes all costs associated with the production of inventory. The IRS requires that you use a modified version of absorption costing that includes not only direct materials, but also indirect costs, such as utilities, rent, or plant insurance that benefit the product as well.
For the purposes of determining costs to be included in your product, you need to isolate the various expenses, create a schedule so you can see what you have, and allocate costs per unit.
Allocating Overhead
Detailed cost accounting is beyond the scope of this book, but it’s worth understanding the basics of computing a unit cost for a product. The following simple illustration outlines how to allocate costs. Assume the total direct costs for every 5,000 mobile home climate control panels made are as follows:
| Materials | $1,000 |
| Labor | $1,500 |
| Applied Evenly | $2,500 |
| Cost per Panel (2,500 ÷ 5,000) | $.50 |
Now assume the total indirect costs:
| Utilities per Month | $1,000 |
| Indirect Labor to Be Applied | $500 |
| Other | $1,400 |
| Total Indirect Costs | $2,900 |
| Total Indirect Costs per Panel (2,900 ÷ 5,000) | $.58 |
| Direct Cost Rate | $.50 |
| Indirect Cost Rate | $.58 |
| Total Direct and Indirect Costs per Panel | $1.08 |
If you produced 26,000 panels during the month:
26,000 × $1.08 = $28,080
So your amount charged to inventory would be $28,080.
Inventory must be valued at cost to comply with accounting rules. But which costs? Companies typically split the costs of doing business into two types: product or period costs. Product costs include any direct or indirect labor, materials, or other expenses associated with making the product or readying it for sale. Period costs are things like office salaries, rent, or utilities that would still be incurred separate from the product. When applying costs to inventory, some companies only use costs directly associated with the product (direct labor and materials) for internal purposes. However, the IRS requires that inventory reflects both direct and indirect costs, which can include everything from materials to office salaries. These costs are allocated on a per unit basis.
5.4 Inventory Valuation Methods
Specific Identification
Average Cost
First In, First Out (FIFO)
Last In, First Out (LIFO)
You’ve carefully recorded the cost of each purchase or product made for inventory. You’ve even taken a physical inventory so you know how much you have left in inventory. Now comes the tricky part, especially because your inventory may be composed of similar products that can have different costs. How do you identify which goods, at which costs, have been sold? In other words, what’s the best way to value your ending inventory?
This subchapter takes you through the four major methods of applying costs to inventory of like items—specific identification; average cost; first in, first out (FIFO); and last in, first out (LIFO)—and shows how your choice affects not only the value of your inventory, but your company’s financial performance as well.
Specific Identification
The specific identification method is only feasible for retail businesses. This method seeks to match specific costs with specific products. When an item is sold, the product cost associated with that item is multiplied by the number of units sold to come up with the cost of goods sold.
In the following example, Miller Home Construction Supply has sold 900 units for the month of July. Using the specific identification method, Miller’s accountant computes the cost of goods sold based on their actual unit cost:
SCHEDULE OF INVENTORY PURCHASES

The number of units of each product sold are then multiplied by its specific unit cost:
COMPUTATION OF COST OF GOODS SOLD USING THE SPECIFIC IDENTIFICATION METHOD

Total cost – Cost of goods sold = Ending inventory
$8,850 – $4,050 = $4,800
For this method, the actual units sold are multiplied by their actual costs to determine the cost of goods sold of $4,050. The company then would make the following journal entry:

To determine its ending inventory, Miller Home Construction Supply deducts the cost of goods sold from total purchases, which in this case is also its beginning inventory. This amount, $4,850, would be shown as inventory on its balance sheet for July. The specific identification method is useful for companies that sell a few high-ticket items and do not have a wide variety of inventory because costing it all out individually can become impractical.
Average Cost
Businesses that sell a wide variety of goods at a range of prices often find it more efficient to value their inventory using an average cost, or what is sometimes called the weighted-average method. The following table shows how Miller Home Construction Supply from our previous example would price its inventory using an average cost basis.

Inventory total cost ÷ Total units = Average cost
$8,850 ÷ 2,175 = $4.07
Units sold × Average cost = Cost of goods sold
900 × $4.07 = $3,663
Total cost inventory – Cost of goods sold = Ending inventory
$8,850 – $3,663 = $5,187
The average cost method saves time because it enables you to compute cost of goods sold using an average cost, as opposed to a number of different costs for the same product. To arrive at ending inventory, you simply subtract cost of goods sold from the total beginning inventory cost.
First In, First Out (FIFO)
This method closely tracks the actual movement of goods in and out of inventory. Using first in, first out, usually referred to as FIFO, the oldest costs should be used first when valuing inventory that’s sold. That is, you sell things in the order you bought them.
The following table shows the value of Miller Home Construction Supply total inventory at cost. For simplicity’s sake, assume that the inventory is composed of one item, plywood sheets. The unit price has been rising through July as housing starts and, therefore, demand has also picked up.

As before, assume Miller Home Construction Supply sells 900 units. Using FIFO, the company computes the cost of those units as follows:
| 400 @ $3.00 (7/10 price) | $1,200 |
| 500 @ $4.00 (7/14 price) | $2,000 |
| Cost of Goods Sold | $3,200 |
| Ending Inventory | $5,650 |
Ending inventory is calculated by subtracting cost of goods sold from the total goods in inventory of $8,850.
Last In, First Out (LIFO)
The last in, first out (LIFO) method of costing inventory is the opposite of FIFO. Here, a company uses the most recent inventory unit costs to value inventory as it goes out the door. The rationale is that the current costs are more in line with the costs of items being sold. Generally, the IRS frowns on LIFO, because in a period of rising prices, it results in lower net income. We don’t recommend it either, particularly if you’re just starting out. If you want to use it, you’ll have to file form 970 with the IRS requesting approval.
The following table shows how Miller Home Construction Supply would determine its cost of goods sold using LIFO.

Before you start applying costs to inventory and cost of goods sold, you need to decide what cost flow assumption you’re going to use. In other words, when you’ve manufactured or purchased the same goods over a period of time at different prices, which costs will you use to value what you sell? Each method has its advantages and disadvantages, as we outline in the next subchapter. The key is finding the one that best works for your company.
Regardless of the method they choose, most companies with volumes of stock now rely on automated systems to cost and record inventory as doing these calculations manually can be time-consuming and costly. Computerized accounting programs also can use the data to quickly produce reports that can help managers determine which products are selling well, which are not, and how to stock most cost-effectively.
Comparing Cost Flow Assumptions
Factoring in Rising and Falling Prices
Lower of Cost or Market
Cost of goods sold (COGS) is often key in determining whether your business is profitable or it isn’t, so making sure this line item on the income statement gives a true picture of your costs is important. As we know from previous subchapters, in computing COGS and ending inventory, companies are given wide berth. This subchapter compares COGS when different inventory flow methods are used and also shows the impact of your choices on the bottom line.
Comparing Cost Flow Assumptions
Cost of goods sold is computed as follows:
Beginning inventory + Purchases – Ending inventory = Cost of goods sold
Your cost of goods sold varies depending on the inventory flow method you choose. A method that uses the most recent costs to value what’s left in inventory could give you a lower cost of goods sold, for example, and hence a higher net income than you might get using a different valuation method.
The following table summarizes the effects of different valuation methods for the Miller Home Construction Supply examples discussed earlier:
COMPARISON CHART

Note the $950 range between the highest and lowest cost of goods sold and ending inventory estimates. That’s a 27 percent difference. This shows that the method you choose can have an impact on your financial results. Accounting rules permit you to choose the method to value cost of goods sold and inventory.
The cost flow method also need not approximate the flow of goods. What’s important (and what the IRS looks at) is picking a method that makes sense for your company and your industry and sticking to it. If you decide on making a change, you must disclose this and, in the case of switching to LIFO, obtain permission in advance from the IRS.
Factoring in Rising and Falling Prices
Even if your company has settled on a method, be aware of how a changing economy can affect how accurately it reflects your costs. Rising or falling prices can have a major impact on the suitability of a particular method. For example, let’s assume Fun Footwear has an inventory of shoes that breaks down as follows:

During the period, Fun Footwear sells 500 shoes at $15 a pair. It has operating expenses of $2,000. In times of rising prices for inventory, if the company uses FIFO, its cost of goods sold will be composed of cheaper inventory (the stuff it bought first when prices were lower). This means Fun Footwear’s cost of goods sold could be understated compared with the true cost of the products, resulting in an overstated net income. In addition, it might be overvaluing its remaining inventory.
Cost of Goods Sold:
| 400 Pairs @ | $2 $800 |
| 100 Pairs @ | $4 $400 |
| COGS | $1,200 |
Sales: $7,500 (500 × $15/pair) – COGS: $1,200 = $6,300 – Operating expenses: 2,000 = $4,300
With LIFO, Fun Footwear’s cost of goods sold is more in line with the current cost of the shoes, but its inventory may be understated in terms of current prices, and income low.
Sales: $7,500 – COGS: $3,200 = $4,300 – Operating expenses: $2,000 = $2,300
In times of falling prices, on the other hand, FIFO is more representative of Fun Footwear’s actual cost of goods sold, although perhaps understating its inventory. LIFO would be understating the company’s cost of goods sold and perhaps risk overstating inventory.
Lower of Cost or Market
In certain circumstances, companies might want to consider valuing inventory at a lower cost. The lower of cost or market method, or LCM, which is also suitable for tax purposes, could minimize disruption in markets where product costs fluctuate. Under this method, a company values each product by the lower of its cost or market value. For example, Fun Footwear’s men’s line has three styles of shoes, each with different costs and market values:

The LCM method would allow the company to value men’s dress shoes at their $50 market price because it’s lower than cost and men’s casual shoes at the $30 cost. This method can’t be used when the costs are computed on a LIFO basis. Even if a company doesn’t choose to use LCM, it’s allowed to use market value for its cost if it’s selling merchandise for less than its cost.
In determining the value of inventory, a company must look at the quantity of goods, the costs, and the flow of goods into the market. Quantities can be tracked, counted, or sometimes estimated. Merchandise inventory is usually costed at purchase price plus any additional charges to ready it for sale. Manufacturing inventory is first divided into stages: raw materials, work in process, and finished goods. Then, materials, labor, and other costs, known as overhead, are applied.
Finally, a business needs to choose an inventory valuation method that identifies which inventory items at which costs have been sold and which remain in stock. The IRS allows a variety of options, as we’ve outlined in this chapter. Each has different impact depending on the industry, the company, and the economy. Most large retailers use a method that allows inventory to be computed using gross profit and sales price. Small businesses more often choose FIFO, which matches the oldest costs with the first inventory sold, perhaps most accurately reflecting the changing costs of inventory purchased or produced at different times and its flow. The best method for your company depends on your particular situation.