The accounting for current liabilities may seem familiar because many of the accounts are mirror images of those in current assets. With current liabilities, a firm is on the opposite side of the transaction from that of current assets. Instead of selling, using, or converting something to cash within a year as it does with current assets, the firm has purchased something and must pay for it within a year or has received prepayment and must provide goods or services within a year. Current liabilities are current obligations to transfer assets or provide services in the next year and will generally be satisfied with current assets. Common examples of current liabilities are discussed below.
Bank Debt
Bank debt is a short-term or revolving (automatically renewed) loan. It can be thought of as negative cash. Most firms do not actually negotiate short-term loans as they need them. A firm instead arranges a line of credit from the bank before its actual funding requirements occur. This allows the firm to make payments even when it has no available cash in its bank account and without having to get a new loan approved each time—by prior agreement, the bank automatically lends money to the firm up to a certain amount. The rate and terms are all set in advance (the rate usually is a set percentage above what is called the “prime rate”).1 Banks charge a fee for the line of credit, usually falling around 30 basis points (i.e., 0.3 percent of the total possible loan amount). The bank charges this fee simply for making the line of credit available and regardless of whether the firm actually borrows any funds (e.g., a firm would pay $3,000 a year to have a $1 million line of credit open).
Current Maturity of Long-Term Debt
Loans to a firm from a public debt issue are often several years long. However, when such a long-term loan’s time to repayment is less than a year, the long-term loan is reclassified as a current liability (e.g., if a 10-year loan was issued 9 years ago, it will have to be repaid next year and thus moves from being a long-term liability to a current one).
Payables
There are many different types of amounts firms have to pay based on their operations. These amounts are called payables and include:
Accounts payable—amounts owed to suppliers of goods or services,
Wages payable—amounts owed to employees,
Taxes payable—amounts owed to the government for sales tax or income tax, and
Dividends payable—amounts which the board of directors has declared and set for payment to the owners (this will be discussed in more detail in Chapter 10).
The accounting for payables is much simpler than its receivable counterpart. This is because there is no need to estimate an allowance for doubtful accounts payable; the firm does not estimate amounts it owes that it will not pay.2 Thus, each of the items above represent what the firm expects to pay in the coming year based on past transactions.
Advances from Customers and Unearned Revenue
When a firm receives funds for which it has not yet provided any goods or services, or for which it has only provided part of the goods or services, the firm has a liability to provide them in the future. The liability reflects the total amount the customer(s) paid for the products or services to be provided. Note that that this means the liability equals the firm’s cost to provide the product or service plus its expected profit—the payable does not equal the cost of producing the goods or services but rather reflects the price the customer paid to the firm.
How would a customer’s advance payment be recorded? On the Balance Sheet, this would increase cash on the asset side (with a debit) and increase unearned revenue on the liabilities side (with a credit). But revenue would not be recorded on the Income Statement until the firm had delivered the product or service to the customer. (As discussed in Chapter 4, if the customer received part of the product or service order, then revenue could be recorded for the part that was delivered to the customer.)
Deferred Income Tax
Although the discussion of deferred income tax is included here, it could in fact be included in current assets, noncurrent assets, or noncurrent liabilities. When the deferral is expected to be reversed (i.e., when the income tax cannot be deferred any longer and must be paid) determines whether it is short-term or long-term. Whether it is a payment in advance or a delayed payment determines whether it is an asset or liability. Until December 14, 2016, firms can have four different classifications for deferred taxes: current assets, long-term assets, current liabilities, and noncurrent liabilities. After they must be classified as noncurrent.
Deferred taxes arise when a firm’s publicly reported financial statements do not match its tax returns. Remember, it is perfectly legal in most countries for firms to make different accounting choices (e.g., to recognize revenues or match expenses) for public reporting and tax purposes. The accounting policies for public reporting are supposed to reflect the underlying economics of the firm, at least in some sense.3 On the other hand, the accounting choices for tax policy are designed to optimize tax payments, which normally means delaying them because, all else equal, a firm would rather pay the government later.
The deferred tax account represents a difference in how tax expense is matched to income and how taxes are actually paid. Let us therefore look at how tax expenses are recorded before examining how deferred taxes are recorded.
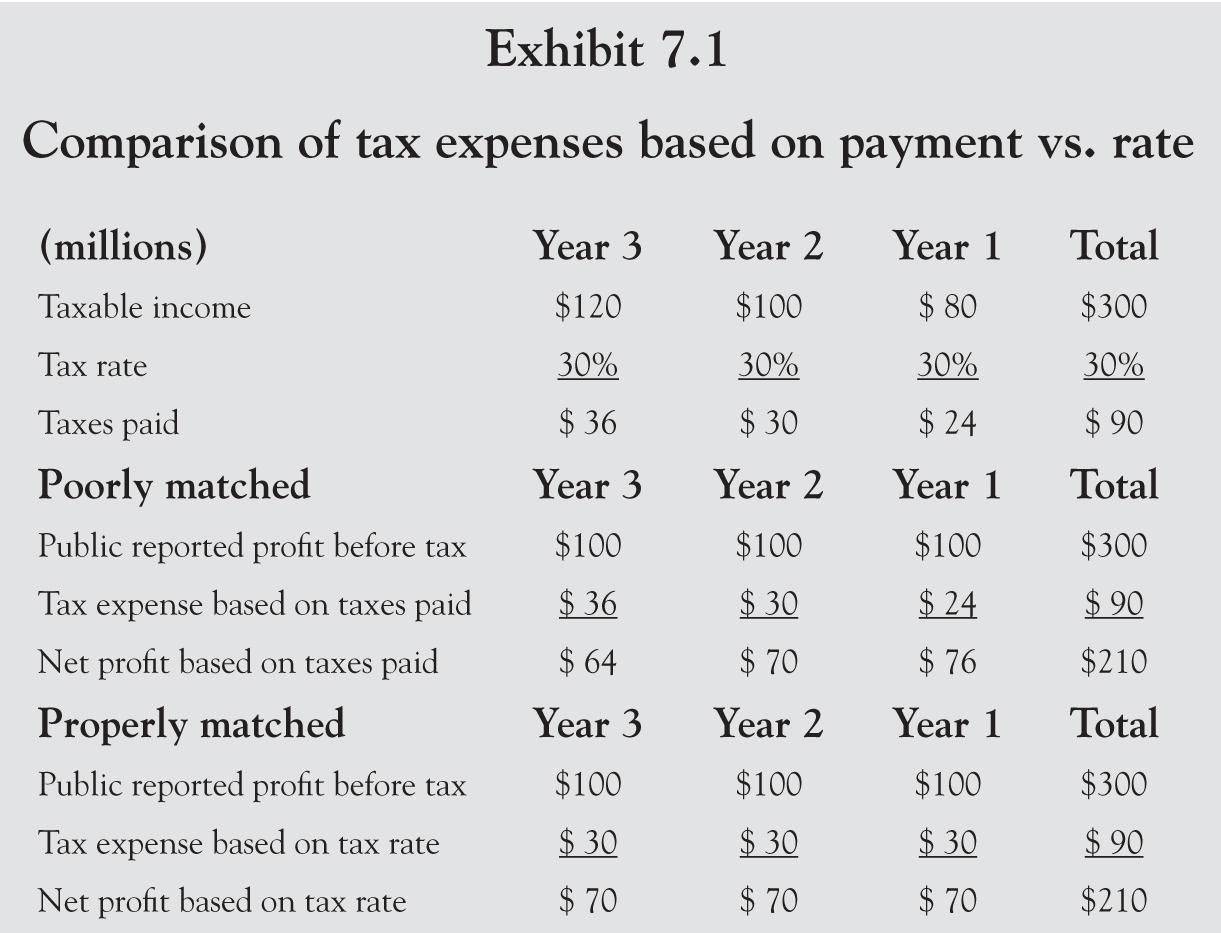
For example, imagine a firm with public reporting that shows profit before tax of $100 million a year for 3 years (a total of $300 million over the 3 years), whereas taxable income is reported to the government at $80 million, $100 million, and $120 million (still totaling $300 million over the 3 years). Further assume the corporate tax rate is 30 percent. The actual taxes paid are 30 percent of the taxable income that the firm reported to the government, which means $24 million, $30 million, and $36 million for a total of $90 million over the 3 years.
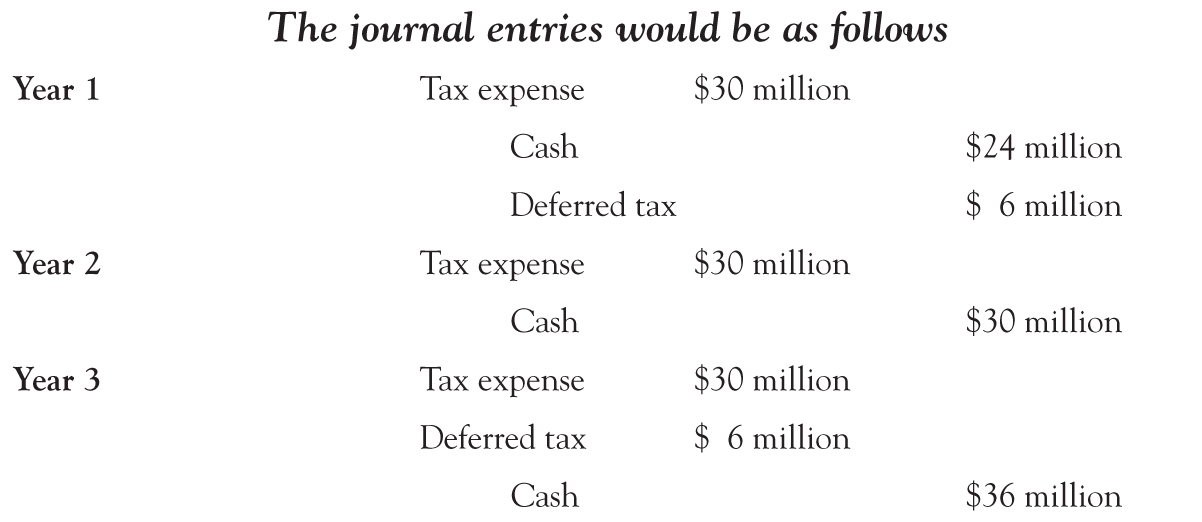
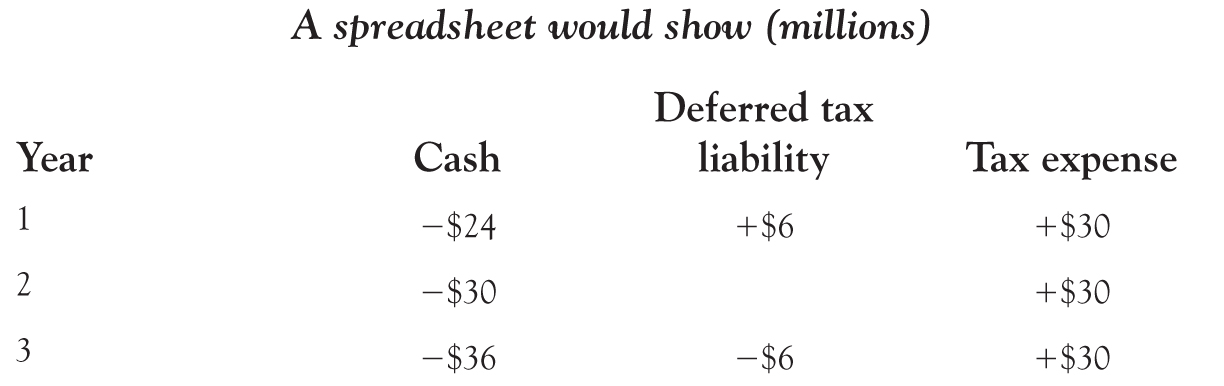
How does the firm record the taxes paid to the government? As will be shown in more detail with step-by-step journal entries below, the payments are reflected on the Balance Sheet (either as a decrease in cash or an increase in an amount owed to the government) with some corresponding expense on the Income Statement. You might think that the firm should have the tax expense recorded on the Income Statement equal the amount actually paid or owed in taxes.4 However, remember that accountants try to match expenses (costs) to revenue. Recording $24 million, $30 million, and $36 million as the tax expenses over the 3 years, as shown in Exhibit 7.1, would do a poor job of matching the tax expense to the revenue. The firm’s revenue was the same every year, so the best way to match tax expenses to revenues would be to apply the 30 percent tax rate to each year’s public reported profits of $100 million.
A couple of notes: First, in the example above, the public reported income was the same in all 3 years. This does not have to be true for the example to be valid. Second, in this example, the difference completely reverses out over 3 years because the 3-year totals are the same for both tax and public reporting. In reality, reversals can take a very long time, even decades, and while one tax deferral reverses others may be set up, causing the total deferred tax to grow.
What causes the differences in public and tax reporting? There are in fact two types of differences in a firm’s public and tax reporting of revenues and expenses. Some are permanent (i.e., certain revenues and expenses are never included in tax reporting) and some are temporary (i.e., the firm recognizes revenues or expenses in a different year for public reporting and tax purposes). The permanent ones impact the firm’s effective tax rate and have no effect on the difference between taxes paid and tax expense described in Exhibit 7.1. The temporary ones reverse out over time and cause the matching problems between tax paid and tax expense described above.
Permanent differences reduce the amount included as taxable revenues (e.g., interest earned on municipal bonds are never taxed for federal purposes) and taxable expenses (e.g., certain fines and penalties are never deductible for tax purposes). For example, assume a firm has revenue of $100 million and total expenses before tax of $80 million for a net profit before tax of $20 million and there are no temporary differences (i.e., the firm’s tax payment and tax expense will match). If the tax rate is 35 percent, the firm will have a tax expense of $7 million and net profit of $13 million ($20 million in profit before tax less $7 million in tax expense). Now assume $1 million of revenue is not taxable for one reason or another (a permanent difference). This means the firm has $99 million of taxable revenue (the amount reported to the government) with its same $80 million of taxable deductions, resulting in a taxable profit of $19 million. The firm pays tax of 35 percent on the $19 million, which equals $6.65 million. For public reporting purposes, the firm still shows total revenue of $100 million and total expenses of $80 million. However, now the firm shows a tax expense of $6.65 million on profit before tax of $20 million, and this represents an effective rate of 33.25 percent ($6.65 million of tax expense / $20 million of profit before tax). There are no matching problems as the $6.65 million tax expense is what is owed and paid. In a nutshell, if any part of a firm’s revenue or expenses are not taxable, it has the same effect as changing the tax rate.
Temporary differences (i.e., those that reverse out) occur due to the timing of when revenues and expenses are recognized for public reporting and tax purposes. Probably the single largest of these is the depreciation on property, plant, and equipment (PP&E) (see Chapter 6). In the United States, firms are allowed to use different depreciation methods for public and tax reporting, with most firms depreciating their plant and equipment faster for tax purposes than for public reporting purposes. Even when firms use double declining balance (as opposed to the more common straight-line method) for public reporting purposes, the tax method often still has a higher depreciation rate.
Extending the example above, Exhibit 7.2 assumes that, for both tax and public reporting, the firm earns $140 million before depreciation and tax. The firm has one long-term asset costing $120 million with a 3-year life and no salvage value. For tax purposes, the depreciation is $60 million in year 1, $40 million in year 2, and $20 million in year 3 (a total of $120 over the 3 years), netting the taxable income shown in Exhibit 7.2 (i.e., $80 million, $100 million, and $120 million). For public reporting purposes, the depreciation is $40 million a year (the $120 million depreciated evenly over the 3 years), netting the public reporting profit before tax shown in Exhibit 7.2 (i.e., $100 million each year).

As seen in Exhibit 7.2, the firm has a difference between tax paid (or payable) and tax expense.5 This results in deferred tax in the public financial statements.
In the example above, the deferred tax is initially classified as a long-term liability. The example assumes that the deferred tax will be paid (i.e., will reverse out) in year 3, so at the end of year 2, it becomes a current liability.
Why would the government allow firms to use different accounting choices for tax reporting that allow them to defer tax payments? Government tax policy is complex and well beyond the scope of this book. However, governments often provide firms with incentives to invest and to create employment (which helps keep the government officials in power). Allowing a higher depreciation rate for tax purposes is a somewhat hidden tax subsidy. The government sets the allowed depreciation rates for various types of plant and equipment based on how much the government wants to encourage firms to purchase these assets. For example, a government could allow a 100 percent write-off (full depreciation in the year of purchase) for the cost of solar panels, whereas for public reporting purposes, the firm would depreciate the panels over their expected useful lives, which is currently estimated at about 20 years.6
There are cases where the firm will record revenues sooner or expenses later for tax purposes. For example, in Exhibit 7.3, the firm records a $40 million depreciation expense a year for 3 years for tax purposes and $60 million, $40 million, and $20 million for public reporting purposes. The deferred tax becomes an asset instead of a liability because the firm is paying the government sooner rather than later.

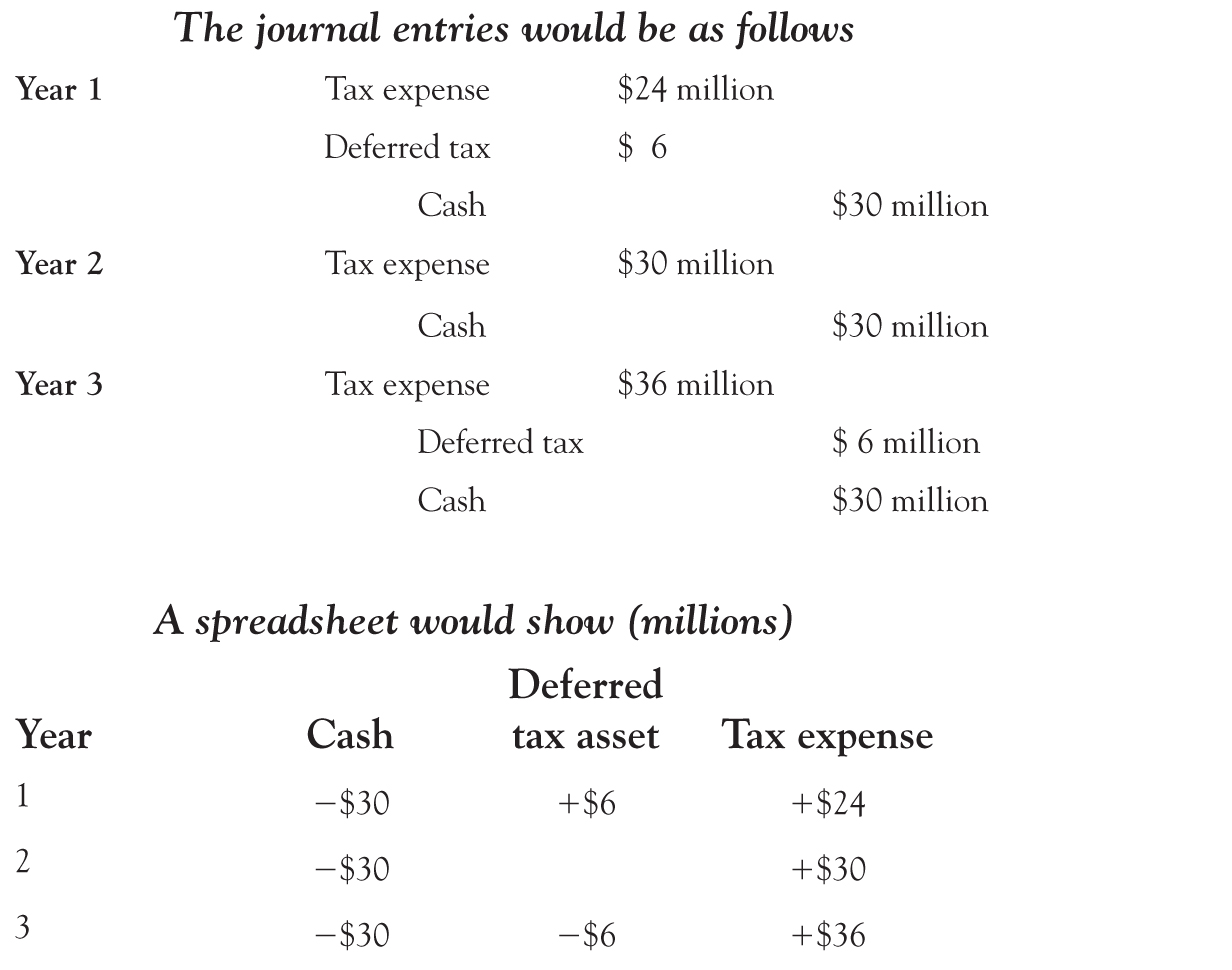
Deferred tax can be thought of as an interest-free loan from the government (if it is a liability) or to the government (if it is an asset). As shown above, using a higher initial depreciation for tax purposes (as opposed to using the same expense as it had for public reporting purposes) allows (as shown in Exhibit 7.2) the firm to delay a $6 million payment from year 1 to year 3.
Note that there is in fact a separate deferred tax account for each item with a timing difference. In most cases, the firm will have lower revenues or higher expenses for tax purposes, resulting in a deferred tax liability. Firms normally net the current deferred tax asset and liability and net the long-term deferred tax asset and liability, resulting in one current item and one long-term item.
What if there is a change in the tax rate? Does this affect deferred taxes? Yes, but only when enacted into law—proposed tax changes are ignored. Once a tax rate is changed, the timing difference is multiplied by the new rate, the deferred tax is adjusted, and the impact of the rate change either increases (if the rate went up) or decreases (if the rate went down) the current year’s income tax expense.
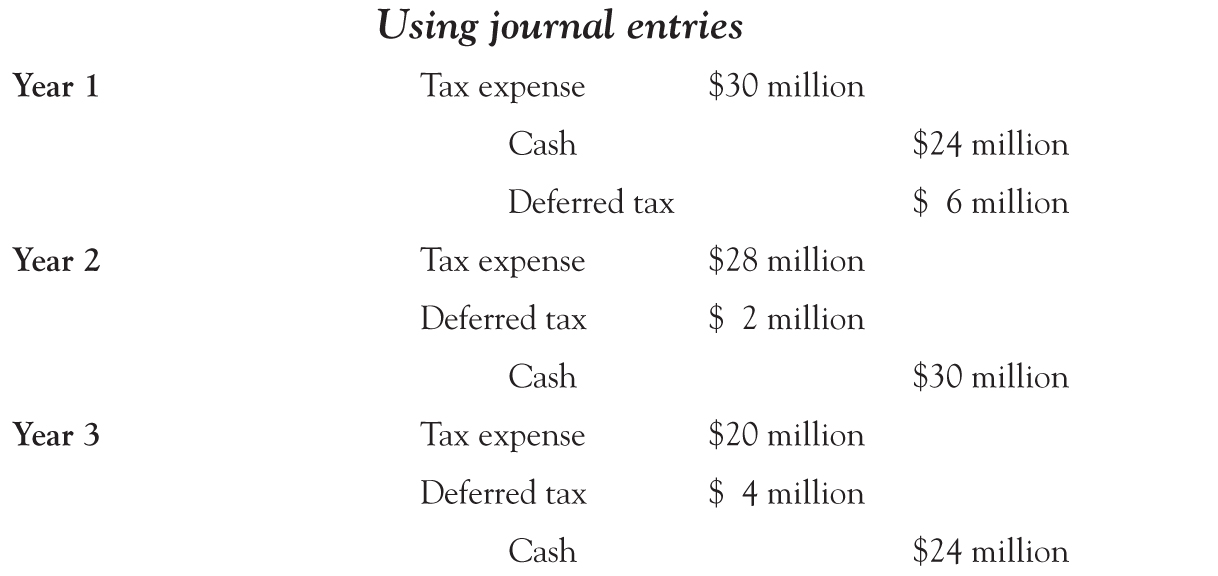
Assume that in our example above, the income tax rate decreased from 30 percent to 20 percent prospectively at the end of the second year, which means that the change in rate will be applied to year 3 but not year 2. The timing difference at the end of year 2 is $20 million as before (the cumulative depreciation for tax purposes is $60 million + $40 million = $100 million vs. the cumulative depreciation for public reporting purposes is $40 million + $40 million = $80 million). The deferred tax is $6 million based on the $20 million difference times 30 percent. However, because of the change in the law, when the reversal occurs it will now be only $4 million (the $20 million times the new rate of 20 percent). In year 2, the deferred tax would have to be lowered (the benefit of the lower rate is recognized) by $2 million (from $6 million to $4 million), and the tax expense would be reduced by $2 million (from $30 million to $28 million). In year 3, the tax expense is now based on the lower rate, and the deferred tax already adjusted in year 2 is reversed.

If the tax rates went up instead of down, the opposite would occur and the deferred tax liability and the tax expense would be increased. The benefit or future cost is adjusted in the year the tax change is enacted into law and then the new rate is applied in future years.
One final tax-related issue has to do with how tax losses are treated. If a firm does not have any profits for tax purposes, it pays no taxes. But what if a firm has losses? Does it get a tax break? It depends. In the United States, a firm can normally apply losses in the current year against profits from the prior 2 years and recover taxes paid through a refund by the government. This means that in a year in which a firm records a loss before tax (i.e., negative profit before tax), the firm may show recoverable taxes that reduce the net loss after tax. Of course, this only happens if the firm had profits and paid taxes in the prior 2 years. If a firm had no profits in the prior 2 years, or the losses in the current year are greater than the profits of the prior 2 years, the loss (or unused portion of the loss) can be applied (“carried forward”) against future profits for a set number of years (currently 7 years in the United States). This means the firm will pay no taxes until it earns back the amount lost.
Can the value of not paying taxes in the future be included in the current financial statements? Sometimes. For example, a tax loss carryforward can be applied against deferred tax liabilities. This is done by reducing the current year’s net loss on the Income Statement (with a tax recovery line on the Income Statement) and reducing the deferred tax liability on the Balance Sheet.
Deferred tax liability (Balance Sheet account)
Tax loss recovery (Income Statement account)
It is also possible in some situations (where a firm has a proven track record and is confident that it will have future profits before the tax loss carryforward expires) to record the tax loss carryforward as an asset and reduce losses in the current year (with the same tax recovery line on the Income Statement and setting up a deferred tax asset on the Balance Sheet).
Deferred tax asset (Balance Sheet account)
Tax loss recovery (Income Statement account)
Despite the complexity in the actual calculations, from the reader’s perspective, deferred tax liabilities should be thought of as interest-free loans from the government and deferred tax assets as interest-free loans to the government.
As an aside, one of the largest deferred tax liabilities must be that of the ExxonMobil Corporation, which had a long-term net deferred tax liability of $36.8 billion on December 31, 2015. If Exxon’s cost of debt is 4 percent, this represents an implicit tax subsidy of almost $1.5 billion a year, or 27.8 percent of the $5.4 billion Income Tax Expense that Exxon reported on its public Income Statement. (Remember, by deferring this amount in taxes, Exxon can use the funds that it would have otherwise given the government and will not have to take out a loan, which means Exxon is avoiding the 4 percent interest it would have been charged on a loan.) The firm’s notes detail the deferred tax liability, which on PP&E alone is a staggering total of $49.4 billion. However, Exxon’s deferred tax liabilities are offset somewhat by its significant deferred tax assets (these are related to the firm’s pensions and other assets) for a net of $36.8 billion.
Other Liabilities
This category includes a host of other items that, as with “other assets,” are not large enough in amount to merit their own line on the Balance Sheet. (Though if they are material for an individual firm, then they should be disclosed separately in their own line.) This includes items such as:
Returnable deposits—this includes a deposit for goods or services where the customer has not made a firm commitment to purchase, or for an amount that will be returned based on the customer’s actions. For example, supermarkets often add a refundable deposit on soft drink sales. When the customer returns the container, the supermarket refunds the deposit.7
Estimated warranties—firms that provide warranties on their products must estimate the cost of providing the future services under the warranty and then set up the related expense and liability in the period of the sale.
Accrued expenses—this category includes all year-end minor expenses, which the firm has incurred but not yet paid. One common example is the unpaid partial monthly bill for utilities (e.g., if the firm’s fiscal year-ends on December 31 but its last utilities bill runs from December 14 to January 13, then the firm will not have received a bill for December 31 and will have to record the unpaid partial bill for December 14 to 31 in its financial statements for the year).
The Bottom Line
Current liabilities are a mirror image of current assets. Bank debt can be thought of as negative cash. Payables are amounts owed to suppliers of goods and services. Unearned revenue reflects payments received in advance of providing goods or services. Deferred income tax (which can be an asset or liability, short or long-term) is the cumulative difference in taxes paid and payable versus those expensed (matched to income). A deferred tax liability (asset) can be thought of as an interest free loan to (from) the government.
The next chapter describes how to value future cash flows.
_________________
1The prime rate is a rate banks give their best customers. Currently it is about 3 percent above the U.S. government discount rate. Depending on a firm’s product market and financial situation, the company will pay anywhere from slightly below to well above this rate.
2If a firm does indeed fail to pay, it is likely to be in financial distress and will have greater problems than estimating allowances.
3Although the accounting policies for public reporting are supposed to reflect the underlying economics, as prior chapters discussed, the firm can choose to have more of a Balance Sheet approach (which more accurately reflects the value of its assets) or more of an Income Statement approach (which is a better predictor of future cash flows).
4For simplicity, tax paid is the taxable income times the tax rate. In fact, the taxes are not all paid by year-end, so the taxes owed for the year would have been partly paid and there would be a short-term liability of taxes payable for the difference.
5For simplicity, it is assumed that all taxes are paid during the year. In reality, only some portion of total taxes would be paid during the year leaving a tax payable at the end of the year, that would be paid the following year.
6Solar panels placed into service by December 31, 2011, could be 100 percent depreciated in 1 year. Certain qualifying equipment placed into service by December 31, 2013, had a 50 percent “bonus” depreciation. Currently, the U.S. government allows solar panels to be depreciated over 5 years.
7In most cases, after some period of time, unclaimed amounts are given to the government.