This chapter introduces traditional financial analysis on a firm. It is the process used to evaluate a firm’s financial health and the starting point in predicting its future cash flows.
Are the Numbers Reasonable?
Garbage In Garbage Out: First check if the raw data is reasonable.
Financial analysis should start by reviewing the numbers in the financial statements to check whether they make sense. First, does the growth in revenue seem reasonable (or plausible)? For example, in the scandal that engulfed the insurance firm Equity Funding Corporation of America in 1973, revenues were growing at 67 percent a year for 7 years.1 Today this may seem like a firm doing extremely well. However, back in the late 1970s, this growth rate made Equity Funding one of the fastest-growing firms in America. Was it possible? Perhaps. Was it likely, given that Equity Funding was an insurance firm, the insurance industry’s average growth rate at the time was 5 percent, and the next best growth rate of any firm in the industry was 12 percent? It certainly seems questionable. What allowed Equity Funding to report growth that was more than five times the number two player and 13 times the industry average? Massive fraud.
Second, still looking at whether the financial statements make sense, is the absolute level of each number plausible? For example, in the infamous Salad Oil Swindle of 1963, the Allied Crude Vegetable Oil Refining Company (Allied) claimed sales of $250 million, which represented 75 percent of total U.S. exports of cottonseed and soybean oil. Allied leased approximately 100 tanks to store the oil, with a total capacity of about 500 million pounds of vegetable oil, yet the firm claimed to have 1.8 billion pounds of oil in inventory. At the time, the United States exported about 1.2 billion pounds a year. Thus, Allied’s 1.8 billion pounds represented 1.5 times the total U.S. annual exports. Did it made sense for this one firm to have that quantity of inventory? Definitely not. When Allied filed for bankruptcy on November 19, 1963, the firm had only about 100 million pounds of various substances in the tanks (mostly water and sludge, not oil). Allied’s $100 million purported worth of vegetable oil turned out to be, in reality, a mere $6 million worth.2
Components of Financial Analysis
Financial analysis (also called ratio analysis) is a diagnostic tool. It is a starting point in understanding a firm’s underlying economics and measuring its financial health and performance. Ratios by themselves have little or no meaning. There is no magic number above or below which a ratio has to be. Rather, ratios must be compared to something, e.g., what is expected, a trend over time, the ratios of other firms, and/or industry averages. Understanding why a firm’s ratios differ from expectations help analysts understand what is happening in a firm.
There are four main categories of ratios: profitability, activity, leverage, and liquidity. Each will be discussed in turn below.
Profitability
Imagine two firms, one having a net profit of $5 million and the other having a net profit of $40 million. Which firm has done better? Clearly the second firm has earned more, but the profits do not tell the whole story. For example, if the first firm earned the $5 million with an investment of $25 million (a 20 percent return), whereas the second firm earned $40 million on an investment of $400 million (a 10 percent return), we might feel the first firm did better. In other words, there is more to determining a firm’s profitability than just looking at the total profit earned.
There are three main types of profitability ratios, of which profit divided by amount invested as noted above is just one:
Profit margins. This ratio essentially measures the return, or profit, on a dollar of sales revenue. It can be computed for various levels of profit (e.g., gross profit, operating profit, net profit, and so on). The numerator is the profit number, the denominator is the sales number.
Gross Profit / Sales
Operating Profit / Sales
Net Profit / Sales
Return on Assets (ROA) looks at the profit given the total resources available, independent of how the resources were financed. The numerator is net profit adjusted for the cost of financing net of any tax effects. The denominator is the total resources available.
ROA = (Net Income + Interest Expense (1 − the tax rate)) / Total Assets
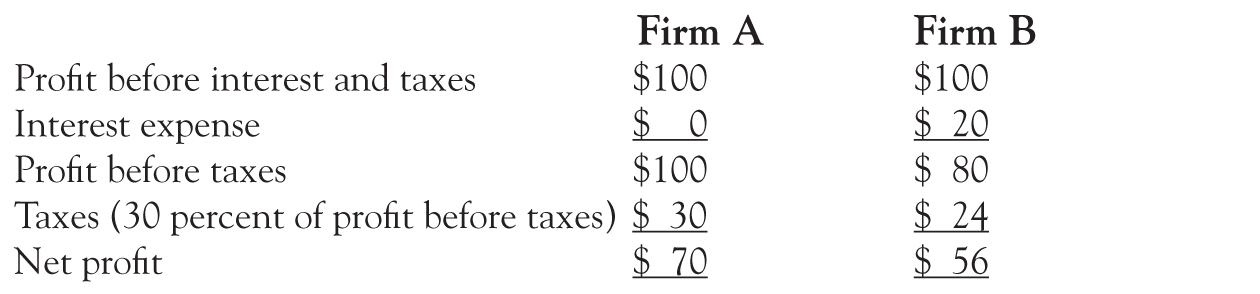
To explain a bit more: Imagine you have two firms, both earning $100 million before finance charges and taxes. The first firm has financed the resources entirely with equity. The second firm has financed with both debt and equity, and has an annual interest charge of $20 million. If the corporate tax rate is 30 percent, the first firm will have net profit of $70 million, whereas the second firm will have net profit of $56 million.
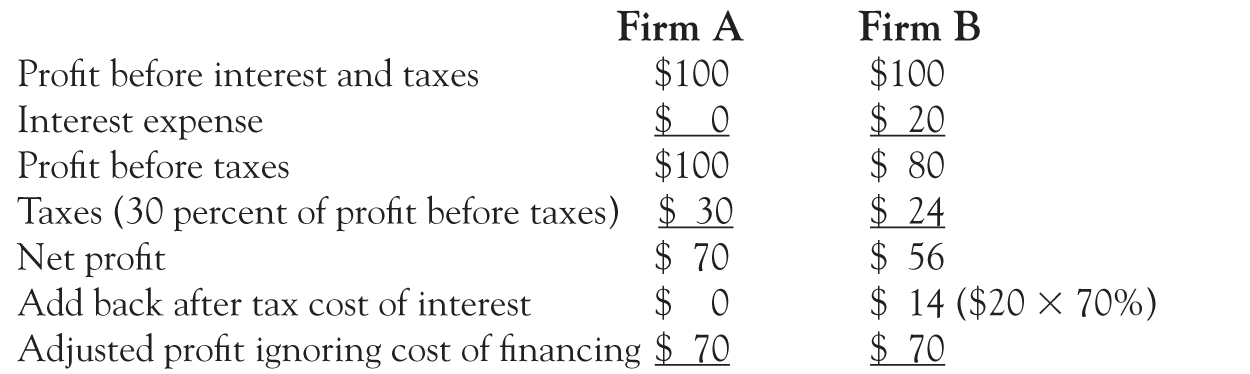
Considering profitability while explicitly excluding how the resources were financed requires adjusting for the cost of financing. However, simply adding back the interest expense (which would then have Firm B showing an adjusted profit of $76 million) is incorrect because the interest charges are tax deductible. Essentially, the government shares the cost of financing by allowing the firm to reduce taxable income by the interest expense. The government thus picks up $6 million of the total cost of financing (which can be seen in the difference in the tax of the two firms, $30 million vs. $24 million), and the true cost to Firm B of financing is $14 million, or interest minus tax savings (calculated as the $20 million in interest × [1 − the tax rate]). We can make the two firms’ profits directly comparable by adding back Firm B’s after-tax financing charge of $14 million.
Return on Equity (ROE) measures the return to a specific investor group: the owners. No adjustment is made to the numerator because borrowing well (or poorly) is part of the net return to the owners.
ROE = Net Income / Owner’s Equity
Doing the Math
There are hundreds if not thousands of different ratios, making it critical to understand their exact definitions and to be consistent across time and firms. It is also important to ensure the calculation is being done correctly. For example, when computing the profit margins above, an Income Statement number is divided by an Income Statement number (e.g., Net Income / Sales). As long as the same Income Statement is used, there should be no problem. However, for ROA and ROE, the Income Statement number is divided by a Balance Sheet number, which leads to the questions: Which Balance Sheet? The opening Balance Sheet (last year’s close), the closing Balance Sheet (this year’s close), or some average (simple average, monthly average, and so on)? Surprisingly, most textbooks suggest using the simple average (opening number / 2 + closing number / 2). However, unless the firm is continuously investing more funds, this makes no sense. Imagine investing $1,000 in a bank account, earning $50, and ending the year with $1,050 in the bank account. What is the return? It is not 4.88 percent ($50 / $1,025), using the average of the two investment amounts. It is not 4.76 percent ($50 / $1,050), using the ending number. Rather, it is 5 percent ($50 / $1,000), using the initial investment or opening number.
Often year-end numbers are used because they are readily available and being more precise would not result in a material difference (this is true when the opening and closing numbers are not materially different). Still, it is important to know and understand the choice used.
Appendix 12A provides selected financial information for Apple Inc. along with calculations for the ratios discussed. As can be seen Apple maintained a gross profit margin of about 40 percent and a profit margin of about 23 percent from 2012 through 2015. Thus, Apple generates $0.40 gross and $0.23 net per $1.00 of sales. Its return on assets average 21 percent with ROE averaging 37 percent from 2013 to 2015 (note to calculate the 2012 ratios requires the opening Balance Sheet numbers for 2012—which are the ending numbers for 2011). These are extraordinarily high ratios for any firm and explain Apple’s high market value.
Activity
Activity ratios focus on the firm’s operations. Below are a few possible activity ratios:

The first three ratios reflect how well a firm is managing its collections and inventory and how long the firm is taking to pay its suppliers. The last two indicate the amount of fixed assets (property, plant, and equipment [PP&E]) and total assets the firm needs in order to generate sales. Changes in these last two ratios are often related to changes in revenue.
Appendix 12A shows Apple’s ratios are consistent over the last few years. Apple took 26 days to collect in 2015. This reflects the combination of sales to third party vendors (e.g., phone companies) as well as directly to consumers (whose payment with credit cards would be received by Apple a day or two after the sale). Apple’s 2015 ratio of 6 days of inventory reflects a very efficient operation. At the same time, Apple takes 115 days to pay its suppliers. Days receivable plus days inventory less days payable is often referred to as net working capital. For most firms, net working capital is a positive number reflecting the amount of financing the firm requires for net working capital (days receivable plus days inventory less days payable). For Apple, it is a negative number (26 days + 6 days − 92 days = −60 days). Thus, Apple is using its large purchasing power to essential extract financing from its suppliers. Apple’s fixed asset turnover of almost 11 indicates the firm does not require much PP&E for operations. The total asset turnover is less the 1 because of the enormous amount of cash and marketable securities held by Apple.
Leverage
Leverage measures how a firm has funded its resources: the split between debt and equity. It is a measure of long-term risk. All else equal, the greater the funding from debt, the greater the risk that the firm will be unable to repay the debt and the greater the probability of bankruptcy.
Although there are many different ways to do the actual calculation, there are really two key differences in how this risk is calculated. One set of approaches counts only interest-bearing debt as debt (i.e., it excludes accounts payable, deferred taxes, and other such liabilities), whereas the other includes all liabilities as debt.
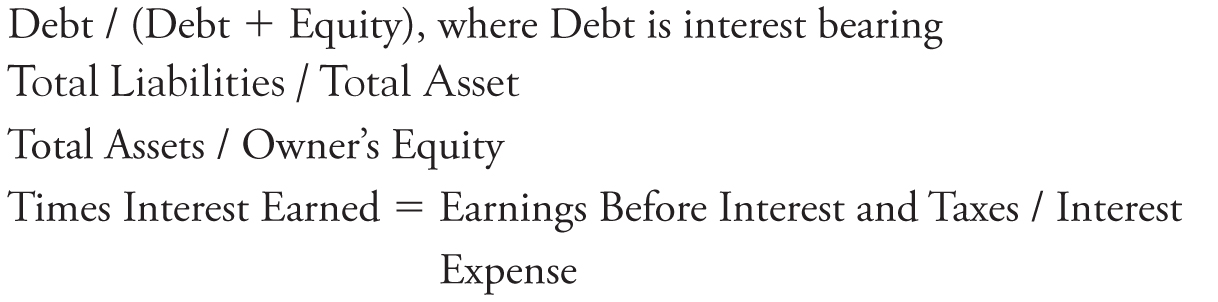
Note the second and third ratio above measure exactly the same thing. The second ratio may be more intuitive, whereas the third fits into the DuPont equation discussed below. The last ratio is an example of adapting a ratio to a specific user: Times Interest Earned is a banker’s ratio as it indicates whether a firm has enough funds to pay the interest on debt. A number less than one means the firm will not have enough funds to pay. The higher the number, the better the banker sleeps at night.
Appendix 12A indicates Apple is financed mostly with contributed capital and retained earnings. However, one may wonder why Apple has any debt given its cash and marketable securities balances. The reason is that much of the firm’s profit is overseas and would be subject to additional taxes if repatriated to the United States. Thus, Apple finds it less costly to borrow funds (which it can do at very low rates given its high profitability and low risk) to pay out dividends and buy back shares.
Liquidity
Liquidity is a measure of short-term risk. It considers whether the firm has the ability to pay its current debts as they come due. The two key liquidity ratios are:
Current Ratio = Current Assets / Current Liabilities
Quick Ratio = (Cash + Marketable Securities + Receivables) / Current Liabilities
The quick ratio is basically a more conservative version of the current ratio: It only includes those assets that could be quickly converted to cash if needed to repay current debts. Thus, inventory and prepaid expenses are excluded.
Appendix 12A indicates Apple Inc. has very large liquidity ratios indicating the firm’s low risk of not paying its debts as they come due. This makes sense given the firm’s cash and marketable security balances.
Other Ratios
There are numerous other ratios that are used to measure specific areas of a firm. For example, advertising expenses or research and development expenses as a percentage of sales. These ratios indicate whether a firm is trying to expand its market share and product line or perhaps is cutting back to improve short-term profits (potentially at the cost of long-term profitability).
Sales / Employees and Fixed Assets / Employees used to be very popular ratios. The idea was to measure the efficiency of employees (how much sales each employee generated and how much fixed assets are required per employee). Of course, a firm could improve these ratios by outsourcing, which is why it is so important for the analyst to consider any substantial change in the denominator and its cause.
Common Size Financial Statements
Dividing all financial statement numbers by sales produces what is called common size financial statements. Essentially, all components (line items) of the Income Statement and Balance Sheet are transformed into percentages of sales (i.e., are divided by sales). This allows for comparisons over time (both for the individual firm as well as to other firms), eliminates the impact of differences in size, and provides a starting point for forecasts. An alternative Common Value Balance Sheet divides all Balance Sheet numbers by total assets. Again, this allows for comparisons over time and across firms.
DuPont Analysis
The DuPont Model3 says that a firm’s ROE is the product of its profitability (selling stuff for more than it cost), its capital intensity (selling stuff without excess resources), and its financial leverage (financing well). These are measured by Net Income / Sales, Sales / Assets, and Assets / Equity, respectively. (Assets / Equity is the less-than-intuitive leverage ratio introduced above, which you can now see fits nicely into the DuPont formula). There are therefore three levers by which a firm can increase ROE.

Which can be stated in words as:

ROE can be increased by an increase in profitability and/or capital intensity and/or leverage. If you calculate the cross products in the above equation, sales cancels with sales and assets cancels with assets, leaving you with ROE = Net Income / Equity, or the net income return per dollar of equity. However, it is useful to consider each component of the DuPont Formula, instead of just the simplified Net Income / Equity, because each of the three levers are useful for analysis.
The Bottom Line
You should now be able to pick up an annual report, read it, understand much of it, and have a solid foundation to start asking questions about the firm. Hopefully this book showed you that accounting can be fun and informative, or at least that it is not as painful as you feared. This ends this book. Accounting for Fun and Profit: Understanding Advanced Topics in Accounting presents many of the more complex aspects of accounting.
_________________
1Equity Funding filed for bankruptcy on March 30, 1973, at a time when the media was fixated on the Watergate scandal involving President Richard Nixon (Nixon tried to cover up a break-in to the offices of the Democratic National Committee at the Watergate office complex in the District of Columbia, ordered by members of his staff). The break-in occurred on June 17, 1972. On April 30, 1973, President Nixon asked for the resignation of his top two aids. President Nixon himself resigned on August 8, 1974.
2The Allied Vegetable bankruptcy filing on November 19, 1963, was overshadowed by President John F. Kennedy’s assassination on November 23, 1963.
3Named after the DuPont Corporation, which first started talking about this type of analysis over a hundred years ago.
4Note that net income really should be adjusted here for interest net of taxes, but this is often not done in DuPont Analysis to facilitate the move from ROA to ROE. Also, the figure for total assets in the asset turnover formula is often the year-end number so it matches (and cancels out) the amount used in the leverage ratio.