
Chapter 21 – Nexus
“I might be just a little bit biased, but because of our long term vision and incredible determination, the Nexus has become what some consider the greatest BI tool on planet Earth!”
- Tera-Tom Coffing
Nexus is Now Available on the Microsoft Azure Cloud
|
NEXUS QUERY CHAMELEON |

Why the Nexus Chameleon should be your query tool of choice:
1)Queries every major system
2)Provides visualization and automatically writes the SQL
3)Can perform cross-system joins with a few clicks of the mouse
4)Converts table structures and moves the table and data between systems
5)Compares and synchronizes databases
6)Can move an entire database of tables or views between systems
7)Has the "Garden of Analysis" to re-query answer sets inside your PC
8)Provides a dashboard of graphs and charts for answer sets
Download the Nexus for a free trial at www.CoffingDW.com and use Nexus in-house or on the Microsoft Azure cloud.
Nexus Queries Every Major System

Priority number one for us was to build the best BI tool and then get it working on every major platform.
Setup of Nexus is as easy as pie
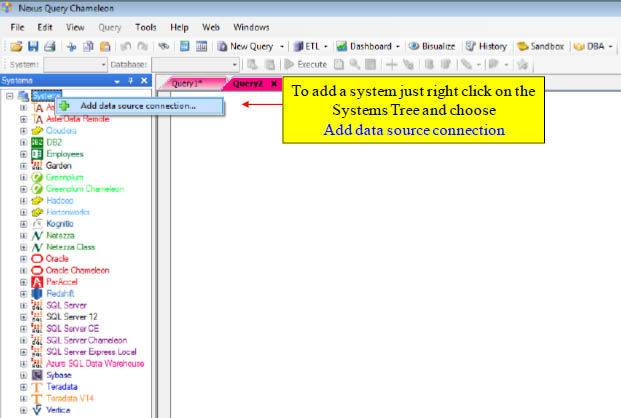
Some of the reasons Nexus is so popular on cloud platforms are because Nexus queries every major platform and it is so easy to setup. Just right click on the systems tree and choose "Add data source connection". You can then add all of your systems one by one and before you know it you are ready to query them all.
Setup of Nexus is a Easy as 1, 2, 3

Once you have right clicked on the Systems Tree and selected "Add new data source", you will come to the Data Source Connection page (see above). First, choose your Source Type from the drop down menu. Hit the Add New button and choose your driver from the System DSN tab (The Nexus Chameleon drivers are outstanding). Then, hit the CONFIGURE button and put in your IP address, login and password. You are ready to begin querying.
Nexus Data Visualization
“It never made sense to me that the data scientist and the business user couldn’t work together on the same playing field. We developed a way for them to work together, by building the Super Join Builder.”
- Tera-Tom Coffing
Nexus Data Visualization
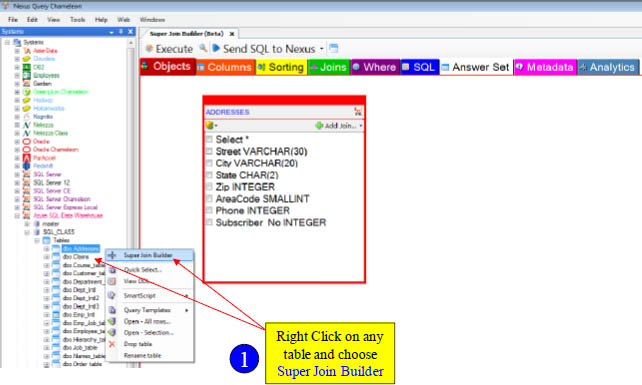
You can write the SQL yourself and Nexus will bring back an answer set, but why not let Nexus write the SQL for you? The Nexus has the best data visualization and it took years of work and millions of lines of code. Just right click on a table in any of your systems trees (above we chose the Addresses table) and then choose SUPER JOIN BUILDER. The table will appear visually and in color. It will show the table name, the columns and their data types. Just check the columns you want on your report and Nexus will build the SQL for you automatically!
Nexus Data Visualization Shows What Tables Can Be Joined

Once you see your first table in the Super Join Builder the fun is just beginning. Left Click on the top right of the visible table and select the drop down menu where it says "Add Join". Nexus will show you what tables can be joined. The Addresses table above can be joined to the Subscribers table. The Subscribers table can be joined to the Claims table. The Claims table can be joined to the Providers and Services tables. Be prepared to be amazed at the next page!
Nexus is doing a Five-Table Join

The "Add Join" button showed us the tables that could be joined and we chose them all. Notice that we can now see each table visually (and in color) and their respective columns and data types. Also, notice that we have checked the columns we want on our report. The Nexus has already built the SQL instantly and automatically for you and it does so perfectly. This technology puts the business user on the same level with the data scientist. The next page will show the SQL generated!
Nexus Generates the SQL Automatically

This is the SQL that was built automatically from the previous page. Since we are querying an Azure SQL Data Warehouse system, the Nexus built T-SQL to satisfy the query. It does not matter whether the system you are querying is Hadoop, Oracle, SQL Server, Teradata or any other system, the Nexus will build the SQL perfectly for that system. All you have to do now is hit the EXECUTE button and you will receive your answer set.
Nexus Delivers the Report
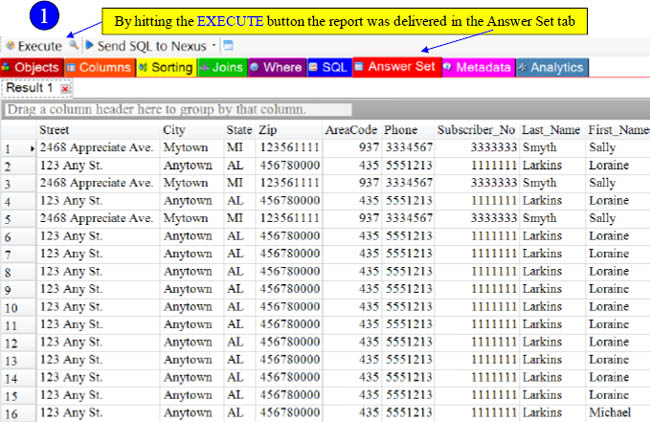
When you hit the EXECUTE button Nexus executes the query and delivers the report.
Cross-System Joins from Teradata, Oracle and SQL Server

The three tables at the top are from Teradata, but the tables at the bottom are from Oracle and SQL Server. When you hit EXECUTE, the Nexus will deliver the report. Nexus not only builds the SQL needed, but the table conversions and data movement to make it happen. Nexus does all of the difficult things for you. You just point and click on the columns you want from the tables and Nexus does the rest. Is that amazing or what?
The Tab of the Super Join Builder
“The 9 tabs of the Super Join Builder are each dedicated to a single query, but each provides a different function. This makes the automatic writing of the SQL so easy, intuitive, quick and yet powerful.”
- Tera-Tom Coffing
The 9 Tabs of the Super Join Builder – Objects Tab 1
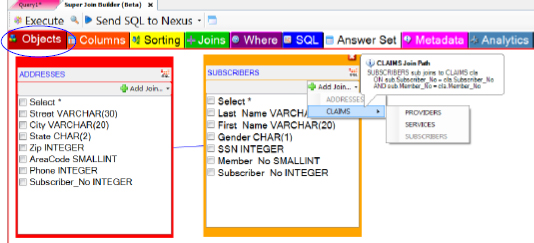
The Objects tab is the first screen you see whenever you right click on any table and choose Super Join Builder. The Objects tab (in red) shows the table, columns and their data types. The Objects tab also allows you to left click on the right corner of any table on the ADD JOIN dropdown to see what other tables are joinable. If you click on a joinable table in the ADD JOIN menu then that table will appear in the Objects tab as well. If you check mark any of the columns from any tables in the Objects tab the SQL will be built and include those selected columns in the report. Since we have not selected any columns yet the SQL has not been built. Once we begin to checkmark columns the SQL will be built.
Above, we first entered the Super Join Builder by right clicking on the Addresses table in our systems tree and we chose Super Join Builder. We then left clicked on the right corner of the Addresses table on the ADD JOIN drop down and we selected Subscribers. Both tables then appeared in the Object tab. We then left clicked on the Subscribers table on the ADD JOIN drop down and we can see that Claims joins to subscribers.
Selecting Columns in the Objects Tab

The Objects tab is the first screen you see whenever you right click on any table and choose Super Join Builder. The Objects tab (in red) shows the table, columns and their data types, and allows you to left click on the right corner of any table on the ADD JOIN dropdown to see what other tables are joinable. We have chosen a two table join between the Addresses table and the Subscribers table. Notice that we clicked on the checkbox on the columns Street, City and State of the Addresses table, and also notice that we clicked on the SELECT * of the Subscribers table which auto-clicked all columns. Our answer set (as of now) will come back with 9 columns (Street, City, State, Last_Name, First_Name, Gender, SSN, Member_No and Subscriber_No). The SQL has automatically been generated with each check of a column.
The 9 Tabs of the Super Join Builder – Columns Tab 2

The columns tab displays the columns that you selected in the Object tab that will be on the report (at the top). Notice the colors correspond to their respective tables. It is here that you can change the order of the columns by dragging them to the order that you prefer. Notice at the bottom are the columns that you did not select in the Objects tab. These will not be on the report. You can however drag these up to the top and then they will be on the report. The columns at the top are on the report and the columns at the bottom are not, but you can rearrange these columns until the report is exactly what you want.
Removing Columns from the Report in the Columns Tab

If you want to delete a column from the report, just drag it to the trashcan and it will appear at the bottom in the list in the area of non-selected columns. You can also remove a series of columns. Above, we did a CTRL click on the Gender column and then did a SHIFT click on the Member_No column. If we keep the SHIFT key down, and drag them all together to the trash can, then all three of these columns are removed from the report.
The 9 Tabs of the Super Join Builder – Sorting Tab 3

The Sorting tab allows you to sort the answer set by simply double clicking on a column or by dragging it up. The columns are listed near the bottom (in color) and the columns at the very bottom were not selected to be on the report, but you can still sort by them. In our example above, we chose the Column State to be the major sort key. The Column State was selected previously to be part of the report. The column Zip is the minor sort key, but as you can see it was not previously selected to be on the report. Now, the Nexus will automatically place an ORDER BY statement at the end of the query. That ORDER BY statement will be ORDER BY State, Zip DESC.
The 9 Tabs of the Super Join Builder – Joins Tab 4
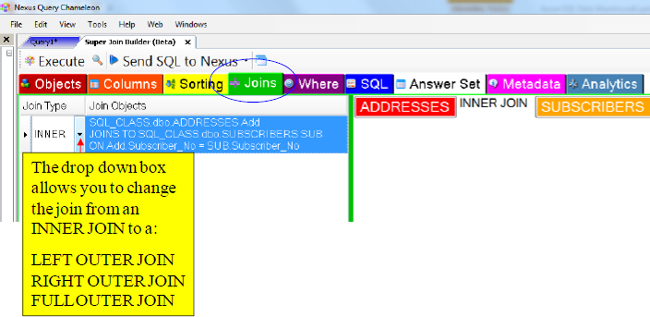
The Nexus defaults all joins to INNER JOIN, but the Joins tab will allow you to change any of the joins from an INNER JOIN to any OUTER JOIN. Just hit the drop down box (red arrow) and your outer join options await you.
The 9 Tabs of the Super Join Builder – Where Tab 5

The WHERE tab is designed to do two things. First, it shows you the indexes of the tables even if you are using views. This allows users to click on indexed columns and utilize an additional WHERE clause. Secondly, it shows all of the columns already on the report and those that are not on the report. Either way, you can double click on any column and write the WHERE or AND clause. I will demonstrate that on the next page.
Using the WHERE Tab For Additional WHERE or AND

The example above shows us double clicking on the Subscriber_No column. Notice (follow the arrow) that an additional WHERE clause was added. The Subscriber_No = awaited us to place a Subscriber_No in and we typed 123456778.
The 9 Tabs of the Super Join Builder – SQL Tab 6
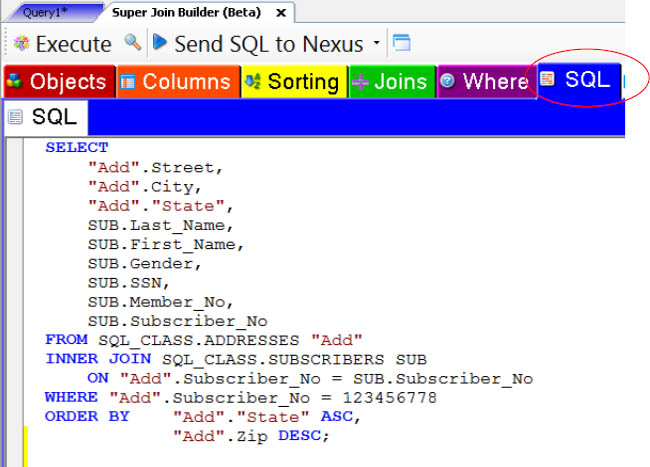
The SQL tab shows the SQL that Nexus has automatically generated. Every click from every tab can cause a change to the SQL. We first went to the Object Tab where we chose the Addresses table and the Subscribers table. We chose our columns in the Objects tab, but we then went to the Columns tab and deleted some of the columns. We then went to the Sorting tab and chose our ORDER BY keys of State and Zip DESC. We then went to the WHERE tab and added an additional WHERE clause choosing the column Subscriber_No and then we typed in = 123456778. The SQL reflects everything we did.
The 9 Tabs of the Super Join Builder – Answer Set Tab 7
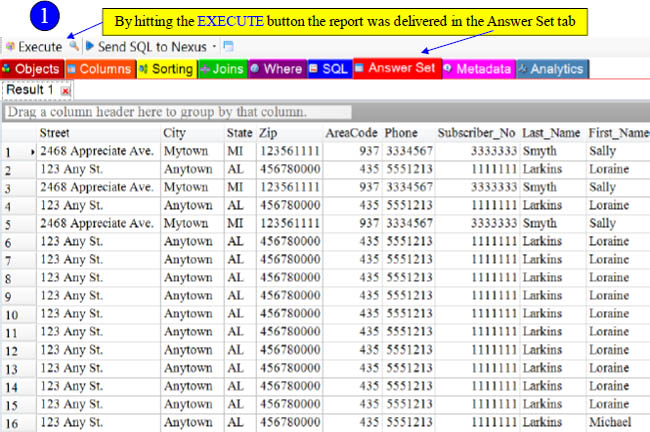
When you hit EXECUTE, the SQL generated is run on your system and you receive an answer set. The above example is a different example than our previous examples. This reflects just a two-table join.
The 9 Tabs of the Super Join Builder – Analytics Tab 9

The Analytics tab is used for Rank, OLAP, and for Group by Grouping Sets, Group by Rollup and Group by Cube queries. It is usually used with a single table. Above, we have right clicked on the Sales_Table and chosen Super Join Builder. We will next click on the Analytics tab to show you how to generate analytics quickly. Turn the page and let’s get started.
Analytics Tab

The Analytics tab is used for Rank, OLAP, and for Group by Grouping Sets, Group by Rollup and Group by Cube queries. It is usually used with a single table. Above, we have right clicked on the Sales_Table and chosen Super Join Builder. We will next click on the Analytics tab to show you how to generate analytics quickly. Turn the page and let’s get started.
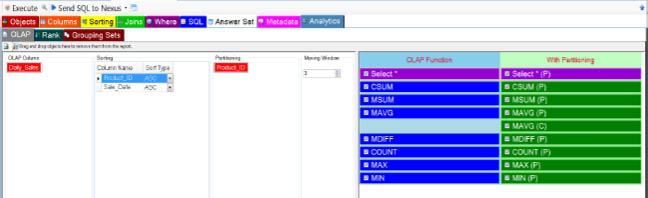
Analytics Tab – OLAP Example

This report will generate an OLAP report (Online Analytic Processing) such as a Cumulative Sum, Moving Sum, etc. We dragged the Daily_Sales column from the bottom to the OLAP column (top left). We dragged the Product_ID and Sale_Date columns to the sorting area. We dragged the Product_ID column to the Partitioning area and we changed our moving window to a 3. We then checked all of the OLAP functions on the top right, including the OLAP with Partitioning. The next slide will show the SQL automatically generated in the SQL tab.
Analytics Tab – OLAP Example of SQL Generated
SELECT
Sal.Product_ID,
Sal.Sale_Date,
Sal.Daily_Sales,
SUM(Sal.Daily_Sales) OVER ( ORDER BY Sal.Product_ID ASC, Sal.Sale_Date ASC ROWS UNBOUNDED PRECEDING),
SUM(Sal.Daily_Sales) OVER (ORDER BY Sal.Product_ID ASC, Sal.Sale_Date ASC ROWS 2 PRECEDING),
AVG(Sal.Daily_Sales) OVER (ORDER BY Sal.Product_ID ASC, Sal.Sale_Date ASC ROWS 2 PRECEDING),
Sal.Daily_Sales -SUM(Sal.Daily_Sales) OVER (ORDER BY Sal.Product_ID ASC, Sal.Sale_Date ASC ROWS BETWEEN 2 PRECEDING AND 2 PRECEDING),
COUNT(*) OVER (ORDER BY Sal.Product_ID ASC, Sal.Sale_Date ASC ROWS UNBOUNDED PRECEDING),
MIN(Sal.Daily_Sales) OVER (ORDER BY Sal.Product_ID ASC, Sal.Sale_Date ASC),
MAX(Sal.Daily_Sales) OVER (ORDER BY Sal.Product_ID ASC, Sal.Sale_Date ASC),
SUM(Sal.Daily_Sales) OVER (PARTITION BY Sal.Product_ID ORDER BY Sal.Product_ID ASC, Sal.Sale_Date ASC ROWS UNBOUNDED PRECEDING),
SUM(Sal.Daily_Sales) OVER (PARTITION BY Sal.Product_ID ORDER BY Sal.Product_ID ASC, Sal.Sale_Date ASC ROWS 2 PRECEDING),
AVG(Sal.Daily_Sales) OVER (PARTITION BY Sal.Product_ID ORDER BY Sal.Product_ID ASC, Sal.Sale_Date ASC ROWS 2 PRECEDING),
AVG(Sal.Daily_Sales) OVER (ORDER BY Sal.Product_ID ASC, Sal.Sale_Date ASC ROWS UNBOUNDED PRECEDING),
Sal.Daily_Sales -SUM(Sal.Daily_Sales) OVER (PARTITION BY Sal.Product_ID ORDER BY Sal.Product_ID ASC, Sal.Sale_Date ASC ROWS BETWEEN 2
PRECEDING AND 2 PRECEDING),
COUNT(*) OVER (PARTITION BY Sal.Product_ID ORDER BY Sal.Product_ID ASC, Sal.Sale_Date ASC ROWS UNBOUNDED PRECEDING),
MIN(Sal.Daily_Sales) OVER (PARTITION BY Sal.Product_ID ORDER BY Sal.Product_ID ASC, Sal.Sale_Date ASC),
MAX(Sal.Daily_Sales) OVER (PARTITION BY Sal.Product_ID ORDER BY Sal.Product_ID ASC, Sal.Sale_Date ASC)
FROM SQL_CLASS.Sales_table Sal;
The SQL above might take hours to write, but with the Nexus it can be generated in 30 seconds.
Analytics Tab – Grouping Sets Example
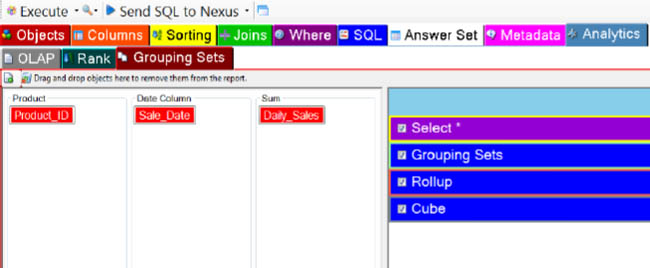
This report will generate Grouping Sets that also include Rollup and Cube. Notice that we dragged the Product_ID to the Product. We dragged the Sale_Date column to the Date Column and we dragged the Daily_Sales column to the Sum. We then checked the Grouping Sets, Rollup and Cube on the top right. The report is now ready to be executed.
Analytics Tab – Grouping Sets Answer Set

Notice now that there are three Result Sets. The picture above shows Result Set 3 which is the Group by Grouping Sets. The Result 1 tab will show the Group by Rollup and the Result 2 tab will show the Group by Cube.
Nexus Data Movement
“If you have ever had to build a load script or convert table structures between different systems, you have experienced the impossible. We spent 7 years to make sure our users could do it with a single click of a button.”
- Tera-Tom Coffing
Moving a Single Table To a Different System
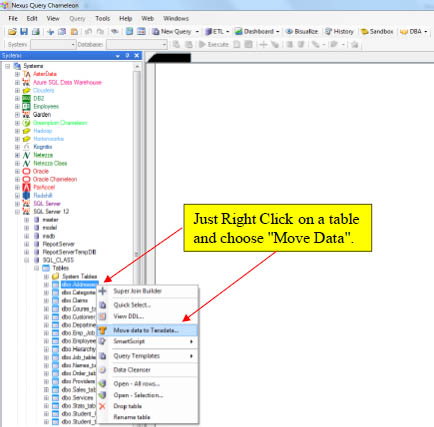
Just right click on any single table and select Move Data. The data movement screen will appear. Check out the next slide.
The Single Table Data Movement Screen

Choose your Target system and put in your login information once and Nexus will remember the next time. Above, we are moving the Addresses table from SQL Server to Teradata. When the EXECUTE button is hit, the table is converted automatically and moved. Simple and easy! Wait until you see the Database Mover! It is next.
Moving an Entire Database To a Different System

Just right click on any database and select Move Data. The database mover screen will appear. Check out the next slide.
The Database Mover Screen

Select all the tables, a single table, some of the tables or choose to move through the views (bottom left),and then press the blue arrow button. We are moving 19 tables from SQL Server to Teradata. Hit EXECUTE and all of the tables move. Don’t forget though to check out the Options tab. You can set your parameters there. The next slide will show the Options Tab.
The Database Mover Options Tab

The Options tab allows you to set more detailed parameters. Once you set them the first time, the Nexus Chameleon will remember them the next time (as defaults). You can change them as you see fit.
Converting DDL Table Structures

We right clicked on a Teradata database and chose Convert Table Structures and then chose to convert the Teradata tables to Hadoop. Check out the next couple of screens on the following pages.
Converting DDL Table Structures

You can click on the table’s box (red arrow) and it checks all the tables. You can uncheck any table you don’t want, but once you have the tables you want converted checked, then you just press the big blue arrow. The tables will move over to the right in the To Be Converted area. Just hit Execute (at the top) and the table structures (DDL) will be converted. This example has converted 19 Teradata tables to Hadoop table structures. Check out the DDL Nexus creates on the next page.
Converting DDL Table Structures
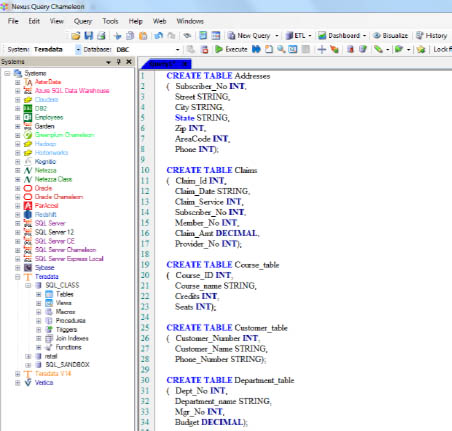
Nexus converts and creates the new DDL. You can logion to the system and paste in the table structures. This complex and difficult project sometimes takes a month, but with the Nexus it takes a minute.
Hound Dog Compression
“Using Multi-Value compression on a Teradata table is a win-win. Large tables are about 35% smaller, 35% faster and take up about 35% less network traffic. The only negative is you have to figure out the correct algorithm and write the DDL. We spent a long time making this all happen automatically.”
- Tera-Tom Coffing
Hound Dog Compression on Teradata
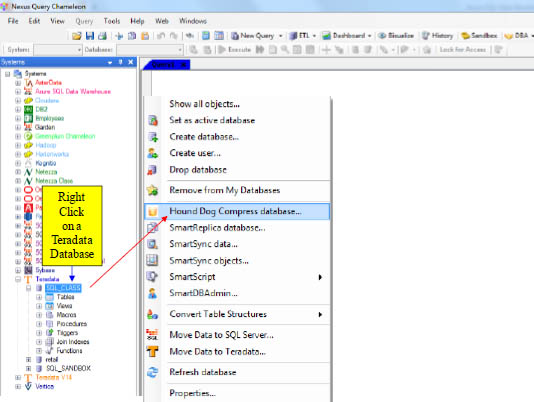
Save yourself an enormous amount of money by using the Hound Dog Compression tool. It is as easy as a right click on a Teradata database and then choosing Hound Dog Compress Database. Check out the next screen to see how easily it is done.
Hound Dog Compression on Teradata

You can click on the table’s box (red arrow) and it checks all the tables. You can uncheck any table you don’t want, but once you have the tables you want to be compressed just press the big blue arrow. The tables will move over to the right in the Table to Compress area. Just hit Execute (at the top) and the tables will be compressed. You can then look at the dashboard tab (top right) and see the compression savings for every table. .