
Chapter 14. Administering and monitoring ActiveMQ
- Understanding JMX and ActiveMQ
- Using advisory messages to monitor ActiveMQ
- Administering ActiveMQ
- Logging configuration in ActiveMQ
The final topic left to be covered is management and monitoring of ActiveMQ broker instances. As with any other infrastructure software, it’s important for developers and administrators to be able to monitor broker metrics during runtime and notice any suspicious behavior that could possibly impact messaging clients. Also, you might want to interact with your broker in other ways. For example, you might want to change broker configuration properties or send test messages from administration consoles. ActiveMQ implements some features beyond the standard JMS API that allow for administration and monitoring both programmatically and by using well-known administration tools.
We’ll start this chapter with the explanation of the Java Management Extension API (JMX), the standard API for managing Java applications. Next, we’ll explain the concept of advisory messages, which allow you to receive important notifications from the broker in a more messaging-like manner.
In later sections we’ll focus on administrator tools for interacting with brokers. We’ll explore some of the tools embedded in the ActiveMQ distribution such as the command agent and the web console as well as some of the external tools such as JConsole.
Finally, we’ll explain how to adjust the ActiveMQ logging mechanism to suit your needs and demonstrate how to use it to track down potential problems. We’ll also show you how to change the ActiveMQ logging preferences during runtime.
Now, let’s get started with explaining how to use the JMX API with ActiveMQ. In the following section you’ll learn how to configure JMX in ActiveMQ, and how you can write Java applications to gather various ActiveMQ statistics. It’s an important topic because many tools we’ll cover later use JMX to access the broker, so this is a lengthy section.
14.1. The JMX API and ActiveMQ
Nearly every story on management and monitoring in the Java world begins with Java Management Extensions (JMX). The JMX API allows you to implement management interfaces for your Java applications by exposing functionality to be managed. These interfaces consist of management beans, usually called MBeans, which expose resources of your application to external management applications. For this purpose, ActiveMQ exposes its management API through JMX, and it can be used to manage and monitor the broker during runtime. Some of these management and monitoring tasks may include
- Obtaining broker statistics, such as number of consumers (total or per destination)
- Adding new connectors or removing existing ones
- Changing some of the broker configuration properties
These tasks and many more can be achieved using JMX in ActiveMQ. Because JMX is the standard API for Java application management, most monitoring tools support the ability to execute JMX queries. This makes it incredibly easy to integrate the monitoring of a Java application into an existing tool that supports JMX.
In this section we’ll learn how JMX is used with ActiveMQ. We’ll start by explaining the difference between local and remote access to the broker’s management API, and how to expose ActiveMQ JMX MBeans. While doing this, we’ll cover various configuration options used to adapt JMX to your needs. Next, we’ll see an example of a Java application that uses the JMX API to gather various broker statistics. Finally, we’ll explain some more advanced JMX configuration topics, such as remote access and security.
14.1.1. Local vs. remote JMX access
The JVM provides what’s known as the JMX agent. The JMX agent is comprised of the MBean server, some agent services, and some protocol adapters and connectors. The JMX agent is used to expose the ActiveMQ MBeans. In order to control various aspects of the JMX agent, a set of properties is provided. Through the use of these properties, various features in the JMX agent can be enabled and disabled. For more information, see the document titled “Monitoring and Management for the Java Platform” (http://mng.bz/0Dzg).
Here’s a snippet from the ActiveMQ startup script for Linux/Unix concerning the JMX capabilities:
if [ -z "$SUNJMX" ] ; then
  #SUNJMX="-Dcom.sun.management.jmxremote.port=1099
-Dcom.sun.management.jmxremote.authenticate=false
-Dcom.sun.management.jmxremote.ssl=false"
  SUNJMX="-Dcom.sun.management.jmxremote"
fi
Here’s the same snippet from the ActiveMQ startup script for Windows concerning the SUNJMX variable:
if "%SUNJMX%" == "" set SUNJMX=-Dcom.sun.management.jmxremote
REM set SUNJMX=-Dcom.sun.management.jmxremote.port=1099
-Dcom.sun.management.jmxremote.authenticate=false
-Dcom.sun.management.jmxremote.ssl=false
Note that each snippet demonstrates the use of a variable named SUNJMX. This variable is specific to the ActiveMQ startup scripts, and is used to hold the JMX properties that are recognized by the JVM. Each snippet shows that the only JMX property that’s enabled by default is the com.sun.management.jmxremote property. Don’t let the name of this property fool you, as it enables the JMX agent for local access only. This can be easily tested by starting up JConsole and seeing ActiveMQ in the list of locally accessible objects as shown in figure 14.1.
Figure 14.1. Accessing ActiveMQ locally from JConsole

Upon selecting the ActiveMQ run.jar and clicking the Connect button, the main screen will appear in JConsole, as shown in figure 14.2.
Figure 14.2. The main JConsole screen with the ActiveMQ domain included

Note in figure 14.2 that the ActiveMQ JMX domain (listed as org.apache.activemq) is near the cursor. Using the default configuration and startup script in ActiveMQ, this is what will appear in JConsole, indicating that the JMX agent is enabled for local access. But attempts to access ActiveMQ remotely (from a remote host) via JCon-sole will fail, as the JMX agent hasn’t been exposed on a specific port number using the com.sun.management.jmxremote.port property. More on this later.
Here’s a snippet from the default broker configuration with the useJmx attribute explicitly enabled (shown in bold):
  <broker xmlns="http://activemq.org/config/1.0" useJmx="true"
    brokerName="localhost"
    dataDirectory="${activemq.base}/data">
...

  </broker>
By simply changing the useJmx attribute from true to false, the ActiveMQ domain will no longer be available for access:
  <broker xmlns="http://activemq.org/config/1.0" useJmx="false"

    brokerName="localhost"
    dataDirectory="${activemq.base}/data">
...

  </broker>
Upon making this small configuration change, you’ll be able to access the JMX agent via the ActiveMQ run.jar, but the ActiveMQ domain won’t be available (see figure 14.3). This is because the JMX agent for the JVM and the domain for ActiveMQ are distinct. The JMX agent in the JVM is controlled by the com.sun.management.jmxremote property, whereas the ActiveMQ domain is controlled by the useJmx attribute in the broker configuration file.
Figure 14.3. The main JConsole screen without the ActiveMQ domain included

14.1.2. Exposing the JMX MBeans for ActiveMQ
By default, the MBeans for ActiveMQ are enabled to be exposed for ease of use. In order to fully utilize the MBeans, there are additional properties in the broker configuration file to enable additional functionality. Listing 14.1 shows in bold what needs to be changed in the broker configuration to enable JMX support.
Listing 14.1. ActiveMQ JMX configuration
<broker xmlns="http://activemq.org/config/1.0" useJmx="true"

  brokerName="localhost"
  dataDirectory="${activemq.base}/data">

  <managementContext>
    <managementContext connectorPort="2011" jmxDomainName="my-broker" />
  </managementContext>

  <transportConnectors>
    <transportConnector name="openwire" uri="tcp://localhost:61616" />
  </transportConnectors>
</broker>
Two important items in the preceding configuration file are related to the JMX configuration. The first is the useJmx attribute of the <broker> element that enables/disables JMX support. The value of this attribute is true by default so the broker uses JMX by default, but it’s included in this example configuration for demonstration purposes.
By default, ActiveMQ starts a connector which enables remote management on port 1099 and exposes MBeans using the org.apache.activemq domain name. These default values are sufficient for most use cases, but if you need to customize the JMX context further, you can do so using the <managementContext> element. In our example we changed the port to 2011 and the domain name to my-broker. See the properties for the management context in table 14.1.
Table 14.1. ManagementContext properties
|
Property name |
Default value |
Description |
|---|---|---|
| useMBeanServer | true | If true, try to locate and use the existing JVM’s MBeanServer |
| jmxDomainName | org.apache.activemq | The JMX domain name |
| createMBeanServer | true | If true and if no MBeanServer can be located, create a new MBeanServer |
| createConnector | true | If true then create a JMX connector to the MBeanServer for remote management |
| connectorPort | 1099 | The port number to be used by the JMX connector |
| rmiServerPort | 0 | The port number to be used by the RMI server |
| connectorPath | /jmxrmi | The path to be used by the JMX connector |
Now we can start the broker with the following command:
$ ${ACTIVEMQ_HOME}/bin/activemq console
xbean:${EXAMPLES}src/main/resources/org/apache/activemq/book/ch14/
activemq-jmx.xml
Among the usual log messages shown during the broker startup, you may notice the following line:
INFO  ManagementContext  - JMX consoles can connect to
service:jmx:rmi:///jndi/rmi://localhost:2011/jmxrmi
This is the JMX URL we can use to connect to the broker using a utility such as JCon-sole, as discussed later in the chapter. As you can see from the output, the port number for accessing the broker via JMX has been changed from 1099 to 2011.
Now that JMX support has been enabled in ActiveMQ, you can begin utilizing the JMX API to interact with the broker.
14.1.3. Exploring broker properties using the JMX API
Using the JMX API, statistics can be obtained from a broker at runtime. The example shown in the following listing connects to the broker via JMX and prints out some of the basic statistics such as total number of messages, consumers, and queues. Next it iterates through all available queues and prints their current size and number of consumers subscribed to them.
Listing 14.2. ActiveMQ broker statistics

The preceding example is using the standard JMX API to access and use broker and request information. For starters, we have to create an appropriate connection to the broker’s MBean server. Note that we’ve used the URL previously printed in the ActiveMQ startup log. Next, we’ll use the connection to obtain the MBean representing the broker. The MBean is referenced by its name, which in this case has the following form:
<jmx domain name>:BrokerName=<name of the broker>,Type=Broker
The JMX object name for the ActiveMQ MBean using the default broker configuration is as follows:
org.apache.activemq:BrokerName=localhost,Type=Broker
But recall back in listing 14.1 that the JMX domain name was changed from local-host to my-broker. Therefore the JMX object name for the changed broker configuration looks like the following:
my-broker:BrokerName=localhost,Type=Broker
With this object name to fetch the broker MBean, now the methods on the MBean can be used to acquire the broker statistics as shown in listing 14.2. In this example, we print the total number of messages (getTotalMessageCount()), the total consumer count (getTotalConsumerCount()), and the total number of queues (getQueues().length()).
The getQueues() method returns the object names for all the queue MBeans. These names have a format similar to the broker MBean object name. For example, one of the queues we’re using in the jobs queue is named JOBS.suspend and it has the following MBean object name:
my-broker:BrokerName=localhost,Type=Queue,Destination=JOBS.suspend
The only difference between this queue’s object name and the broker’s object name is in the portion marked in bold. This portion of the object name states that this MBean represents a type of Queue and has an attribute named Destination with the value JOBS.suspend.
Now it’s time to examine the job queue example to see how to capture broker runtime statistics using the example from listing 14.2. But first the consumer must be slowed down a bit to be sure that some messages exist in the system before the statistics are gathered. For this purpose the following broker URL is used:
private static String brokerURL =
        "tcp://localhost:61616?jms.prefetchPolicy.all=1";
Note the parameter on the URI for the broker (the bold portion). This parameter ensures that only one message is dispatched to the consumer at a time.
Additionally, the consumer can be slowed down by adding a one-second sleep to the thread for every message that flows through the Listener.onMessage() method. Here’s an example of this:
public void onMessage(Message message) {
 try {
  //do something here
  System.out.println(job + " id:" + ((ObjectMessage)message).getObject());
  Thread.sleep(1000);
 } catch (Exception e) {
  e.printStackTrace();
 }
}
The consumer (and listener) modified in this manner have been placed into package org.apache.activemq.book.ch14.jmx, and we’ll use them in the rest of this section.
Now the producer can be started just like it was started in chapter 3:
mvn exec:java -Dexec.mainClass=org.apache.activemq.book.ch3.jobs.Publisher
And the modified consumer can be run as well:
mvn exec:java -Dexec.mainClass=org.apache.activemq.book.ch14.jmx.Consumer
Finally, run the JMX statistics class using the following command:
mvn -e exec:java -Dexec.mainClass=org.apache.activemq.book.ch14.jmx.Stats
The org.apache.activemq.book.ch14.jmx.Stats class output is shown next:
Statistics for broker ID:dejanb-52630-1231518649948-0:0 - localhost

-----------------

Total message count: 670

Total number of consumers: 2
Total number of Queues: 2

-----------------

Statistics for queue JOBS.suspend
Size: 208
Number of consumers: 1

-----------------

Statistics for queue JOBS.delete
Size: 444
Number of consumers: 1
Note that the statistics from the Stats class are output to the terminal. There are many more statistics on the MBeans from ActiveMQ. The example shown here is meant only to be an introduction.
As you can see, it’s easy to access ActiveMQ using the JMX API. This will allow you to monitor the broker status, which is useful in both development and production environments. But what if you want to restrict access to the JMX capabilities?
14.1.4. Advanced JMX configuration
In some situations, advanced configuration of the JMX agent is necessary. This includes remote access, restricting access to a specific host, and restricting access to particular users via authentication. Most of these tasks are fairly easy to achieve through the use of the JMX agent properties and by slightly modifying the ActiveMQ startup script.
Again, remember the snippet from the ActiveMQ startup script for Linux/Unix concerning the JMX capabilities:
if [ -z "$SUNJMX" ] ; then
  #SUNJMX="-Dcom.sun.management.jmxremote.port=1099
-Dcom.sun.management.jmxremote.authenticate=false
-Dcom.sun.management.jmxremote.ssl=false"
  SUNJMX="-Dcom.sun.management.jmxremote"
fi
Recall also the same snippet from the ActiveMQ startup script for Windows concerning the SUNJMX variable:
if "%SUNJMX%" == "" set SUNJMX=-Dcom.sun.management.jmxremote
REM set SUNJMX=-Dcom.sun.management.jmxremote.port=1099
-Dcom.sun.management.jmxremote.authenticate=false
-Dcom.sun.management.jmxremote.ssl=false
Note the portions that are commented out. These three additional properties will be covered in this section, as well as a fourth related property.
Enabling Remote JMX Access
Sometimes it’s necessary to allow access to the JMX agent from a remote host. Enabling remote access to the JMX agent is easy. The default ActiveMQ startup scripts include a configuration for remote access to the JMX agent using the com.sun.management.jmxremote.port property, but it’s commented out. By adding this property to the uncommented portion of the SUNJMX variable, remote access will be enabled on the specified port number.
Here’s a snippet from the ActiveMQ startup script for Linux/Unix with the com.sun.management.jmxremote.port property enabled:
if [ -z "$SUNJMX" ] ; then
  SUNJMX="-Dcom.sun.management.jmxremote.port=1234
-Dcom.sun.management.jmxremote.authenticate=false
-Dcom.sun.management.jmxremote.ssl=false"
fi
Here’s the same snippet from the ActiveMQ startup script for Windows with the com.sun.management.jmxremote.port property enabled:
if "%SUNJMX%" == "" set SUNJMX=-Dcom.sun.management.jmxremote.port=1234
-Dcom.sun.management.jmxremote.authenticate=false
-Dcom.sun.management.jmxremote.ssl=false
Note that the com.sun.management.jmxremote.port property is now enabled and port number 1234 has been specified. Also, two additional JMX properties related to JMX security have been enabled as well. Specifically the com.sun.management.jmxremote.authentication property and the com.sun.management.jmxremote.ssl property have both been set to false. These two properties are included and set to false to disable security because otherwise they’re both true by default for remote monitoring. The JMX agent in the JVM where ActiveMQ is started will be available for access via port number 1234. After enabling remote access, you can test this using JConsole’s Remote tab as shown in figure 14.4.
Figure 14.4. Accessing the JMX agent remotely on port 1234

Upon successfully connecting to the remote ActiveMQ instance, you’ll be able to remotely manage and monitor ActiveMQ.
Note
In order for the JMX remote access to work successfully, the /etc/hosts file must be in order. Specifically, the /etc/hosts file must contain more than just the entry for the localhost on 127.0.0.1. The /etc/hosts file must also contain an entry for the real IP address and the hostname for a proper configuration. Here’s an example of a proper configuration:
127.0.0.1       localhost
192.168.0.23    urchin.bsnyder.org urchin
Note the portion of the /etc/hosts file that contains an entry for the localhost and an entry for the proper hostname and IP address.
14.1.5. Restricting JMX access to a specific host
Sometimes you need to restrict the use of JMX to a specific host in a multi-homed environment, such as the host on which ActiveMQ is running. The fourth related property mentioned earlier will provide this type of restriction via the Java SE, not by ActiveMQ itself. The java.rmi.server.hostname property is used to provide just such a restriction. As defined in the Java SE documents on the section about RMI properties (http://mng.bz/65hS):
The value of this property represents the host name string that should be associated with remote stubs for locally created remote objects, in order to allow clients to invoke methods on the remote object. In 1.1.7 and later, the default value of this property is the IP address of the local host, in “dotted-quad” format.
This property must be added to the SUNJMX variable in the ActiveMQ startup script. Here’s an example of adding this property to the ActiveMQ startup script for Linux/Unix:
if [ -z "$SUNJMX" ] ; then
  SUNJMX="-Dcom.sun.management.jmxremote
- Djava.rmi.server.hostname=192.168.0.23"
fi
And here’s an example of adding this property to the ActiveMQ startup script for Windows:
if "%SUNJMX%" == "" set SUNJMX=-Dcom.sun.management.jmxremote
-Djava.rmi.server.hostname=192.168.0.23
This slight change to use the java.rmi.server.hostname property simply notes the name of the host to which the access should be restricted. After making this change, the ActiveMQ MBeans can only be accessed from this host.
14.1.6. Configuring JMX password authentication
Password authentication for the JMX agent is controlled by an access file and a password file. The access file is used to define roles and assign permissions to those roles. The password file is used to map roles to passwords. The JDK provides examples of each of these files, so the best way to begin is to take a look at these files. The files are located in the $JAVA_HOME/jre/lib/management/directory and are named jmxremote.access and jmxremote.password.template. Each of these files is intended to provide a starting point for you to define your own values.
Here are the contents of the default jmxremote.access file:
monitorRole readonly
controlRole readwrite
Note that monitorRole is the role name and readonly is the access level. The role name needs to correspond to a role name in the password file.
The contents of the default jmxremote.password.template file is empty but provides the following suggestion:
monitorRole QED
controlRole R&D
Note that monitorRole is the role name and QED is the password. This role name corresponds to the role name in the jmxremote.access file. The idea with the jmxremote. password.template file is that it should be used as a template—you should make a copy of the file to use as your password file and make changes specific to your needs.
To make a copy of the jmxremote.password.template file for Mac OS X, use the following command:
$ cp /System/Library/Java/JavaVirtualMachines/1.6.0.jdk/Contents/Home/lib/
management/jmxremote.password.template
/System/Library/Java/JavaVirtualMachines/1.6.0.jdk/Contents/Home/lib/
management/jmxremote.password
To make a copy of the jmxremote.password.template file for Linux/Unix, use the following command:
$ cp $JAVA_HOME/jre/lib/management/jmxremote.password.template
$JAVA_HOME/jre/lib/management/jmxremote.password
To make a copy of the jmxremote.password.template file for Windows, use the following command:
> copy %JAVA_HOME%jrelibmanagementjmxremote.password.template
%JAVA_HOME%jrelibmanagementjmxremote.password
Edit the new jmxremote.password file so that the contents match the following:
myRole foo
yourRole bar
Note that two new roles have been defined with their own passwords.
Now edit the jmx.access file to include the two new roles so that the contents match the following:
myRole readwrite
yourRole readonly
Note how the roles in the jmxremote.access and jmxremote.password files correspond to one another.
The last requirement is to enable password authentication on the JMX agent. To do so, remove the com.sun.management.jmxremote.authenticate property from the SUNJMX variable in the ActiveMQ startup script. Here’s an example of removing this property from the ActiveMQ startup script for Linux/Unix:
if [ -z "$SUNJMX" ] ; then
  SUNJMX="-Dcom.sun.management.jmxremote
-Dcom.sun.management.jmxremote.port=1099
-Dcom.sun.management.jmxremote.ssl=false"
fi
And here’s an example of removing this property from the ActiveMQ startup script for Windows:
if "%SUNJMX%" == "" set SUNJMX=-Dcom.sun.management.jmxremote
-Dcom.sun.management.jmxremote.port=1099
-Dcom.sun.management.jmxremote.ssl=false
After removing the com.sun.management.jmxremote.authenticate property, the last thing to do is make sure that the user running the JVM has access to the jmxremote. password file.
Note
After copying the jmxremote.password.template file, chances are that you’ll need to change the permissions on that file to disallow read access. If read access is allowed on the jmxremote.password file, the following error will potentially rear its head when starting up ActiveMQ:
$ ./bin/activemq console
Error: Password file read access must be restricted:
/System/Library/Java/JavaVirtualMachines/1.6.0.jdk/Contents/Home/lib/
management/jmxremote.password
The only thing left to do is start up ActiveMQ and make sure that there are no errors:
$ ./bin/activemq console
INFO: Using default configuration
(you can configure options in one of these file:
/etc/default/activemq /Users/bsnyder/.activemqrc)

INFO: Invoke the following command to create a configuration file
./bin/activemq setup [ /etc/default/activemq |
/Users/bsnyder/.activemqrc ]

INFO: Using java
'/System/Library/Frameworks/JavaVM.framework/Home/bin/java'
INFO: Starting in foreground, this is just for debugging purposes
(stop process by pressing CTRL+C)
Java Runtime: Apple Inc. 1.6.0_22
/System/Library/Java/JavaVirtualMachines/1.6.0.jdk/Contents/Home
  Heap sizes: current=258880k free=253105k max=258880k
    JVM args: -Xms256M -Xmx256M
    -Dorg.apache.activemq.UseDedicatedTaskRunner=true
-Djava.util.logging.config.file=logging.properties
-Dcom.sun.management.jmxremote
-Dactivemq.classpath=/Users/bsnyder/amq/apache-activemq-5.4.1/conf;
-Dactivemq.home=/Users/bsnyder/amq/apache-activemq-5.4.1
-Dactivemq.base=/Users/bsnyder/amq/apache-activemq-5.4.1
ACTIVEMQ_HOME: /Users/bsnyder/amq/apache-activemq-5.4.1
ACTIVEMQ_BASE: /Users/bsnyder/amq/apache-activemq-5.4.1
Loading message broker from: xbean:activemq.xml
 WARN | destroyApplicationContextOnStop parameter is deprecated,
 please use shutdown hooks instead
 INFO | PListStore:/Users/bsnyder/amq/apache-activemq-5.4.1/data/
 localhost/tmp_storage started
 INFO | Using Persistence Adapter: KahaDBPersistenceAdapter
 [/Users/bsnyder/amq/apache-activemq-5.4.1/data/kahadb]
 INFO | ActiveMQ 5.4.1 JMS Message Broker (localhost) is starting
 INFO | For help or more information please see:
 http://activemq.apache.org/
 INFO | Scheduler using directory:
 /Users/bsnyder/amq/apache-activemq-5.4.1/data/localhost/scheduler
 INFO | JobSchedulerStore:/Users/bsnyder/amq/apache-activemq-5.4.1/data/
 localhost/scheduler started
 INFO | Listening for connections at: tcp://mongoose.local:61616
 INFO | Connector openwire Started
 INFO | ActiveMQ JMS Message Broker
 (localhost, ID:mongoose.local-50084-1292777410913-0:0) started
 INFO | Logging to org.slf4j.impl.JCLLoggerAdapter
 (org.eclipse.jetty.util.log) via org.eclipse.jetty.util.log.Slf4jLog
 INFO | jetty-7.0.1.v20091125
 INFO | ActiveMQ WebConsole initialized.
 INFO | Initializing Spring FrameworkServlet 'dispatcher'
 INFO | ActiveMQ Console at http://0.0.0.0:8161/admin
 INFO | Initializing Spring root WebApplicationContext
 INFO | Connector vm://localhost Started
 INFO | Camel Console at http://0.0.0.0:8161/camel
 INFO | ActiveMQ Web Demos at http://0.0.0.0:8161/demo
 INFO | RESTful file access application at http://0.0.0.0:8161/fileserver
 INFO | Started [email protected]:8161
Now start up JConsole on a remote machine and attempt to use JConsole to remotely connect to ActiveMQ. Figure 14.5 shows what will happen when attempting to remotely log in to the JMX agent using a role name and password that don’t exist in the jmxremote.access/jmxremote. password file pair. To successfully make a remote connection to the JMX agent, you must use the correct role name and password as shown in figure 14.6.
Figure 14.5. Attempting to remotely connect to the JMX agent with the wrong role name and password

Figure 14.6. Making a successful remote connection to the JMX agent requires the correct role name and password.

Hopefully these advanced JMX configurations will help you with your ActiveMQ configurations and your ability to properly configure access.
Beyond the JMX features for monitoring and managing ActiveMQ, there are additional means of monitoring the inner workings of ActiveMQ via what are known as advisory messages.
14.2. Monitoring ActiveMQ with advisory messages
The JMX API is a well-known mechanism often used to manage and monitor a wide range of Java applications. But since you’re already building a JMS application using ActiveMQ, shouldn’t it be natural to receive messages regarding important broker events using the same JMS API? Fortunately, ActiveMQ provides what are known as advisory messages to represent administrative commands that can be used to notify messaging clients about important broker events.
14.2.1. Configuring advisory support
Advisory messages are delivered to topics whose names use the prefix ActiveMQ.Advisory. For example, if you’re interested in knowing when connections to the broker are started and stopped, you can see this activity by subscribing to the ActiveMQ.Advisory.Connection topic. A variety of advisory topics are available depending on what broker events interest you. Basic events such as starting and stopping consumers, producers, and connections trigger advisory messages by default. But for more complex events, such as sending messages to a destination without a consumer, advisory messages must be explicitly enabled as shown next.
Listing 14.3. Configuring advisory support

Advisory support can be enabled using the advisorySupport attribute of the <broker> element ![]() . Please note that advisory support is enabled by default, so technically there’s no need to set the advisorySupport attribute unless you want to be explicit about the configuration. The second and more important item is the use of a destination policy to enable more complex advisories for your destinations
. Please note that advisory support is enabled by default, so technically there’s no need to set the advisorySupport attribute unless you want to be explicit about the configuration. The second and more important item is the use of a destination policy to enable more complex advisories for your destinations ![]() . In the example, the configuration instructs the broker to send advisory messages if the destination has no consumers subscribed
to it. One advisory message will be sent for every message that’s sent to the destination.
. In the example, the configuration instructs the broker to send advisory messages if the destination has no consumers subscribed
to it. One advisory message will be sent for every message that’s sent to the destination.
To demonstrate this functionality, start the broker using the example configuration from above (named activemq-advisory.xml) via the following command:
$ ./bin/activemq
xbean:src/main/resources/org/apache/activemq/book/ch14/activemq-advisory.xml
14.2.2. Using advisory messages
To demonstrate this functionality, we need to create a simple class that uses the advisory messages. This Java class will use the advisory messages to print log messages to standard output (stdout) whenever a consumer subscribes/unsubscribes, or a message is sent to a topic that has no consumers subscribed to it. This example can be run along with the stock portfolio example to make use of the advisory messages (and therefore, certain broker events).
To complete this demonstration, we must modify the stock portfolio producer. ActiveMQ will send an advisory message when a message is sent to a topic with no consumers, but only when those messages are nonpersistent. Because of this, we need to modify the producer to send nonpersistent messages to the broker by setting the delivery mode to nonpersistent. Using the publisher from chapter 3, the following listing shows this simple modification (marked as bold):
Listing 14.4. Forcing an advisory message
public Publisher(String brokerURL) throws JMSException {
    factory = new ActiveMQConnectionFactory(brokerURL);
    connection = factory.createConnection();
    connection.start();
    session = connection.createSession(false, Session.AUTO_ACKNOWLEDGE);
    producer = session.createProducer(null);
    producer.setDeliveryMode(DeliveryMode.NON_PERSISTENT);
}
The consumer modified in this manner has been placed into package org.apache.activemq.book.ch14.advisory and we’ll use it in the rest of this section.
Now let’s take a look at our advisory messages example application shown next.
Listing 14.5. Advisory example

Listing 14.5 provides a demonstration using standard JMS messaging. In the main method, all topics of interest are traversed and consumers are created for the appropriate advisory topics. Note the use of the AdvisorySupport class, which you can use as a helper class for obtaining an appropriate advisory destination. In this example, subscriptions were created for the consumer and the no topic consumer advisory topics. For the topic named topic://STOCKS.CSCO, a subscription is created to the advisory topics named topic://ActiveMQ.Advisory.Consumer.Topic.STOCKS.CSCO and topic://ActiveMQ.Advisory.NoConsumer.Topic.STOCKS.CSCO.
Note
Wildcards can be used when subscribing to advisory topics. For example, subscribe to topic://ActiveMQ.Advisory.Consumer.Topic.> in order to receive advisory messages when a consumer subscribes and unsubscribes to all topics in the namespace recursively.
Now let’s take a look at the consumer listeners and how they process advisory messages. First we’ll explore the listener that handles consumer start and stop events, shown next.
Listing 14.6. Consumer advisory listener

Every advisory is basically a regular instance of an ActiveMQMessage object. In order to get more information from the advisory messages, the appropriate data structure must be used. In this particular case, the message data structure denotes whether the consumer is subscribed or unsubscribed. If we receive a message with the Consumer-Info as data structure, it means that it’s a new consumer subscription and all the important consumer information is held in the ConsumerInfo object. If the data structure is an instance of RemoveInfo, it means that this is a consumer that just unsubscribed from the destination. The call to removeInfo.getObjectId() method will identify which consumer it was.
In addition to the data structure, some advisory messages may contain additional properties that can be used to obtain important information that couldn’t be included in the data structure. The complete reference of available advisory channels, along with appropriate data structures and properties you can expect on each of them, can be found at the Advisory Message page on the ActiveMQ website (http://mng.bz/j749).
Next is an example of a consumer that handles messages sent to a topic with no consumers.
Listing 14.7. No consumer advisory listener
public class NoConsumerAdvisoryListener implements MessageListener {
 public void onMessage(Message message) {
  try {
   System.out.println("Message "
       + ((ActiveMQMapMessage)message).getContentMap()
       + " not consumed by any consumer");
  } catch (Exception e) {
   e.printStackTrace();
  }
 }

}
In this example, the advisory message is the actual message sent to the destination. So the only action to take is to print the message to standard output (stdout).
Running the Example
To run the example from the command line, use the following command:
$ mvn -e exec:java
-Dexec.mainClass=org.apache.activemq.book.ch14.jmx.Advisory
-Dexec.args="tcp://localhost:61616 CSCO ORCL"

...

Subscribing to advisory
topic://ActiveMQ.Advisory.Consumer.Topic.STOCKS.tcp://localhost:61616
Subscribing to advisory
topic://ActiveMQ.Advisory.NoConsumer.Topic.STOCKS.tcp://localhost:61616
Subscribing to advisory
topic://ActiveMQ.Advisory.Consumer.Topic.STOCKS.CSCO
Subscribing to advisory
topic://ActiveMQ.Advisory.NoConsumer.Topic.STOCKS.CSCO
Subscribing to advisory
topic://ActiveMQ.Advisory.Consumer.Topic.STOCKS.ORCL
Subscribing to advisory
topic://ActiveMQ.Advisory.NoConsumer.Topic.STOCKS.ORCL

...
Note that the example application has subscribed to the appropriate advisory topics, as expected.
In a separate terminal, run the stock portfolio consumer using the following command:
$ mvn -e exec:java -Dexec.mainClass=org.apache.activemq.book.ch3.Consumer
-Dexec.args="tcp://localhost:61616 CSCO ORCL"
Upon running this command, the Advisory application will print the following output to the terminal:
Consumer 'ID:dejan-bosanacs-macbook-pro.local-64609-1233592052313-0:0:1:1'
subscribed to 'topic://STOCKS.CSCO'
Consumer 'ID:dejan-bosanacs-macbook-pro.local-64609-1233592052313-0:0:1:2'
subscribed to 'topic://STOCKS.ORCL'
This means that two advisory messages were received, one for each of the two consumers that subscribed.
Now we can start the stock portfolio publisher that was modified earlier to send nonpersistent messages. This application can be started in another terminal using the following command:
$ mvn -e exec:java
-Dexec.mainClass=org.apache.activemq.book.ch14.advisory.Publisher
-Dexec.args="tcp://localhost:61616 CSCO ORCL"
Note that the messages are being sent and received as expected. But if the stock portfolio consumer is stopped, the Advisory application output will print messages similar to the following:
...
Consumer 'ID:dejan-bosanacs-macbook-pro.local-64609-1233592052313-0:0:1:2'
unsubscribed
Consumer 'ID:dejan-bosanacs-macbook-pro.local-64609-1233592052313-0:0:1:1'
unsubscribed
Message {up=false, stock=ORCL, offer=11.817656439151577,
price=11.805850588563015}
not consumed by any consumer
Message {up=false, stock=ORCL, offer=11.706856077241527,
price=11.695160916325204}
not consumed by any consumer
Message {up=false, stock=ORCL, offer=11.638181080673165,
price=11.62655452614702}
not consumed by any consumer
Message {up=true, stock=CSCO, offer=36.51689387339347,
price=36.480413459933544}
not consumed by any consumer
Message {up=false, stock=ORCL, offer=11.524555643871604,
price=11.513042601270335}
not consumed by any consumer
Message {up=true, stock=CSCO, offer=36.583094870955556,
price=36.54654832263293}
not consumed by any consumer
Message {up=false, stock=ORCL, offer=11.515997849703322,
price=11.504493356346975}
not consumed by any consumer
Message {up=true, stock=ORCL, offer=11.552511335860867,
price=11.540970365495372}
not consumed by any consumer
...
The first two messages indicate that the two consumers unsubscribed. The rest of the messages sent to the stock topics aren’t being consumed by any consumer, and that’s why they’re delivered to the Advisory application.
14.2.3. Conclusion
Although it took some time to dissect this simple example, it’s a good demonstration of how advisory messages can be used to act on broker events asynchronously, just as is standard procedure in message-oriented applications.
So far we’ve shown how the ActiveMQ APIs can be used to create applications to monitor and manage broker instances. Luckily, you won’t have to do that often, as many tools are provided for this purpose already. The following section takes a look at some of these tools.
14.3. Tools for ActiveMQ administration
A wide range of tools exist for monitoring and administering ActiveMQ. Which ones you’ll be using depends primarily on the environment you’re using, your setup, and also on your preferences. We’ll start this section with an explanation of command-line tools. Next we’ll see how we can use the JMS API to issue commands to ActiveMQ using the command agent (and how you can use it to access your broker using chat clients). The general-purpose management console for Java platform named JConsole and how it can be used with ActiveMQ is our next topic. Finally, we’ll cover the ActiveMQ web console, integrated with ActiveMQ, which provides you with a nice user interface for inspecting ActiveMQ resources. Most of these tools use the JMX API to communicate with the broker, so be sure to enable JMX support as explained earlier in the chapter. So let’s see what more can we do from the command line besides starting a broker.
14.3.1. Command-line tools
You already know how to use the bin/activemq script to start the broker. In addition to this script, the bin/activemq-admin script can be used to monitor the broker state from the command line. The activemq-admin script provides the following functionality:
- Start and stop the broker
- List available brokers
- Query the broker for certain state information
- Browse broker destinations
In the following sections, we’ll explore this functionality and the commands used to expose it through the use of examples. For the complete reference and explanation of all available command options, please refer to the Command-Line Tools page on the ActiveMQ website (http://mng.bz/lj9a).
Starting and Stopping the Broker
The standard method for starting ActiveMQ is to use the following command on the command line:
$ cd apache-activemq-5.4.1
$ ./bin/activemq
In addition, the following command using the bin/activemq script can also be used:
$ ./bin/activemq-admin start
Using the same script, ActiveMQ can also be stopped using the following command:
$ ./bin/activemq-admin stop
The bin/activemq script is a nice alternative for stopping the broker. It’ll attempt to use the JMX API to do this, so be sure to enable JMX support if you plan to use this script. Please note that the bin/activemq script connects to the default ActiveMQ JMX URL to send commands, so if you made some modifications to the JMX URL (as we did for the earlier JMX examples) or the JMX domain, be sure to provide the correct JMX URL and domain to the script using the appropriate parameters. For example, to stop the previously defined broker that starts the JMX connector on port 2011 and uses the my-broker domain, the following command should be used:
$ ./bin/activemq-admin stop
--jmxurl service:jmx:rmi:///jndi/rmi://localhost:2011/jmxrmi
--jmxdomain my-broker
This command will connect to ActiveMQ via JMX to send a command to the broker telling it to stop.
Now it’s time to see how to get information from ActiveMQ using the command line.
Listing Available Brokers
In some situations, multiple brokers may be running in the same JMX context. Using the bin/activemq script you can use the list command to list all the available brokers as shown next.
Listing 14.8. The activemq-admin list command
$ ./bin/activemq-admin list
Java Runtime: Apple Inc. 1.5.0_16
/System/Library/Frameworks/JavaVM.framework/Versions/1.5.0/Home
  Heap sizes: current=1984k free=1709k max=65088k
    JVM args: -Dactivemq.classpath=/tmp/apache-activemq-5.4.1/conf;
-Dactivemq.home=/tmp/apache-activemq-5.4.1
-Dactivemq.base=/tmp/apache-activemq-5.4.1
ACTIVEMQ_HOME: /tmp/apache-activemq-5.4.1
ACTIVEMQ_BASE: /tmp/apache-activemq-5.4.1
Connecting to pid: 99591
BrokerName = localhost
As you can see in listing 14.8, we have only one broker in the given context and its name is localhost.
Querying the Broker
Starting, stopping, and listing all available brokers are useful features, but what you’ll probably want to do more often is query various broker parameters. Let’s take a look at demonstrating the query command being used to grab information about destinations.
Listing 14.9. The activemq-admin query command
$ ./bin/activemq-admin query -QQueue=*
Java Runtime: Apple Inc. 1.5.0_16
/System/Library/Frameworks/JavaVM.framework/Versions/1.5.0/Home
  Heap sizes: current=1984k free=1709k max=65088k
    JVM args: -Dactivemq.classpath=/tmp/apache-activemq-5.4.1/conf;
-Dactivemq.home=/tmp/apache-activemq-5.4.1
-Dactivemq.base=/tmp/apache-activemq-5.4.1
ACTIVEMQ_HOME: /tmp/apache-activemq-5.4.1
ACTIVEMQ_BASE: /tmp/apache-activemq-5.4.1
Connecting to pid: 99591
DequeueCount = 0
Name = TEST.FOO
MinEnqueueTime = 0
CursorMemoryUsage = 0
MaxAuditDepth = 2048
Destination = TEST.FOO
AverageEnqueueTime = 0.0
InFlightCount = 0
MemoryLimit = 1048576
Type = Queue
EnqueueCount = 0
MaxEnqueueTime = 0
MemoryUsagePortion = 0.0
ProducerCount = 0
UseCache = true
MaxProducersToAudit = 32
CursorFull = false
BrokerName = localhost
ConsumerCount = 0
ProducerFlowControl = true
Subscriptions = []
QueueSize = 0
MaxPageSize = 200
CursorPercentUsage = 0
MemoryPercentUsage = 0
DispatchCount = 0
ExpiredCount = 0

DequeueCount = 0
Name = example.A
MinEnqueueTime = 0
CursorMemoryUsage = 0
MaxAuditDepth = 2048
Destination = example.A
AverageEnqueueTime = 0.0
InFlightCount = 0
MemoryLimit = 1048576
Type = Queue
EnqueueCount = 0
MaxEnqueueTime = 0
MemoryUsagePortion = 0.0
ProducerCount = 0
UseCache = true
MaxProducersToAudit = 32
CursorFull = false
BrokerName = localhost
ConsumerCount = 1
ProducerFlowControl = true
Subscriptions = [org.apache.activemq:BrokerName=localhost,
Type=Subscription,persistentMode=Non-Durable,
destinationType=Queue,destinationName=example.A,
clientId=ID_mongoose.local-59784-1255450207356-3_0,
consumerId=ID_mongoose.local-59784-1255450207356-2_0_1_1]
QueueSize = 0
MaxPageSize = 200
CursorPercentUsage = 0
MemoryPercentUsage = 0
DispatchCount = 0
ExpiredCount = 0
In listing 14.9, the bin/activemq-admin script was used with the query command and a query of -QQueue=*. This query will print all the state information about all the queues in the broker instance. In the case of a broker using a default configuration, the only queue that exists is one named example.A (from the Camel configuration example in the conf/activemq.xml file) and these are its properties.
The command-line tools reference page contains the full description of all available query options. If you call the query command without any additional parameters, it’ll print all available broker properties, which can you can use to get a quick snapshot of a broker’s state.
Browsing Destinations
Browsing destinations in the broker is another fundamental administrative task. This functionality is also exposed in the bin/activemq-admin script. The following is an example of browsing one of the queues we’re using in our job queue example.
Listing 14.10. The activemq-admin browse command
${ACTIVEMQ_HOME}/bin/activemq-admin browse
--amqurl tcp://localhost:61616 JOBS.delete
ACTIVEMQ_HOME: /workspace/apache-activemq-5.2.0
ACTIVEMQ_BASE: /workspace/apache-activemq-5.2.0
JMS_HEADER_FIELD:JMSDestination = JOBS.delete
JMS_HEADER_FIELD:JMSDeliveryMode = persistent
JMS_HEADER_FIELD:JMSMessageID =
ID:dejan-bosanacs-macbook-pro.local-64257-1234789436483-0:0:1:1:2
JMS_BODY_FIELD:JMSObjectClass = java.lang.Integer
JMS_BODY_FIELD:JMSObjectString = 1000001
JMS_HEADER_FIELD:JMSExpiration = 0
JMS_HEADER_FIELD:JMSPriority = 4
JMS_HEADER_FIELD:JMSRedelivered = false
JMS_HEADER_FIELD:JMSTimestamp = 1234789436702

JMS_HEADER_FIELD:JMSDestination = JOBS.delete
JMS_HEADER_FIELD:JMSDeliveryMode = persistent
JMS_HEADER_FIELD:JMSMessageID =
ID:dejan-bosanacs-macbook-pro.local-64257-1234789436483-0:0:1:1:3
JMS_BODY_FIELD:JMSObjectClass = java.lang.Integer
JMS_BODY_FIELD:JMSObjectString = 1000002
JMS_HEADER_FIELD:JMSExpiration = 0
JMS_HEADER_FIELD:JMSPriority = 4
JMS_HEADER_FIELD:JMSRedelivered = false
JMS_HEADER_FIELD:JMSTimestamp = 1234789436706

JMS_HEADER_FIELD:JMSDestination = JOBS.delete
JMS_HEADER_FIELD:JMSDeliveryMode = persistent
JMS_HEADER_FIELD:JMSMessageID =
ID:dejan-bosanacs-macbook-pro.local-64257-1234789436483-0:0:1:1:4
JMS_BODY_FIELD:JMSObjectClass = java.lang.Integer
JMS_BODY_FIELD:JMSObjectString = 1000003
JMS_HEADER_FIELD:JMSExpiration = 0
JMS_HEADER_FIELD:JMSPriority = 4
JMS_HEADER_FIELD:JMSRedelivered = false
JMS_HEADER_FIELD:JMSTimestamp = 1234789436708
...
The browse command is different from the previous commands, as it doesn’t use JMX, but browses queues using the QueueBrowser from the JMS API. For that reason, you need to provide it with the broker URL using the -amqurl switch. The final parameter provided to this command is the name of the queue to be browsed.
As you can see, a fair number of monitoring and administration operations can be achieved from the command line. This functionality can help you to easily check the broker’s state and can be helpful for diagnosing possible problems. But this isn’t the end of the administrative tools for ActiveMQ. There are still a few more advanced administrative tools; they’re explained in following sections.
14.3.2. Command agent
Sometimes issuing administration commands to the broker from the command line isn’t easily achievable, mostly in situations when you don’t have shell access to the machines hosting your brokers. In these situations you’ll want to administer your broker using some of the existing administrative channels. The command agent allows you to issue administration commands to the broker using plain old JMS messages. When the command agent is enabled, it’ll listen to the ActiveMQ.Agent topic for messages. All commands such as help, list and query submitted in form of JMS text messages will be processed by the agent and the result will be posted to the same topic.
In this section we’ll demonstrate how to configure and use the command agent with the ActiveMQ broker. We’ll also go one step further and introduce the XMPP transport connector, and see how you can use practically any instant messaging client to communicate with the command agent.
Let’s begin by looking at the following configuration example.
Listing 14.11. Command agent configuration
...
  <broker xmlns="http://activemq.apache.org/schema/core"
    brokerName="localhost"
    dataDirectory="${activemq.base}/data">

    <transportConnectors>
      <transportConnector name="openwire" uri="tcp://localhost:61616"/>
      <transportConnector name="xmpp" uri="xmpp://localhost:61222"/>
    </transportConnectors>

  </broker>

  <commandAgent xmlns="http://activemq.apache.org/schema/core"
    brokerUrl="vm://localhost"/>
 ...
Two details are important in this configuration fragment. First we’ve started the XMPP transport connector on port 61222 to expose the broker to clients via XMPP (the Extensible Messaging and Presence Protocol). This was achieved by using the appropriate URI scheme, like we do for all supported protocols. XMPP is an open XML-based protocol mainly used for instant messaging and developed by the Jabber project (http://jabber.org). Since it’s open and widespread, a lot of chat clients already support this protocol, and you can use these clients to communicate with ActiveMQ.
For the purposes of this book, we chose to use the Adium (http://www.adiumx.com/) instant messaging client. This client runs on Mac OS X and speaks many different protocols, including XMPP. Any XMPP client can be used here. The first step is always to provide the XMPP client with the details to connect to ActiveMQ, such as server host, port, username, and password, as shown in figure 14.7. Of course, you should connect to your broker on port 61222 since that’s where the XMPP transport connector is running, and you can use any user and password.
Figure 14.7. Connecting to the broker’s agent topic using XMPP (chat) client

After successfully connecting to the broker, you have to join the appropriate chat room, which basically means that you’ll subscribe to the topic with the same name. In this example we’ll subscribe to the ActiveMQ.Agent topic, so we can use the command agent.
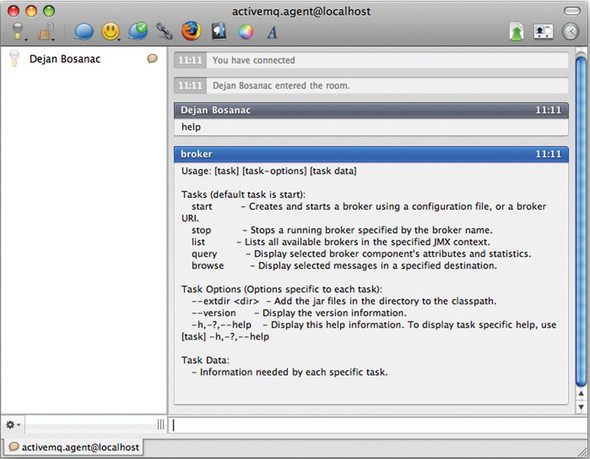
Typing a message in the chat room sends a message to the topic, so you can type your commands directly into the messaging client. An example of the response for the help command is shown in figure 14.8.
Figure 14.8. The result of executing help in XMPP client using the command agent
More complex commands are supported as well. Figure 14.9 shows how you can query the topic named TEST.FOO using the query -QTopic=TEST.FOO command.
Figure 14.9. The result of executing query in XMPP client using command agent

The example shown in this section introduced the use of XMPP protocol. This allows you to use instant messaging applications to interact with the ActiveMQ command agent to administer the broker via standard JMS messages. Now let’s return to some classic administration tools such as JConsole.
14.3.3. JConsole
As we said earlier, the JMX API is the standardized API used by developers to manage and monitor Java applications. But the API isn’t so useful without a client tool. That’s why the Java SE comes with a tool named JConsole, the Java monitoring and management console. JConsole is a client application that allows you to browse and call methods of exposed MBeans. Because ActiveMQ requires the Java SE to run, JConsole should be available, and is handy for quickly viewing broker state. In this section, we’ll cover some of its basic operations with ActiveMQ.
The first thing you should do after starting JConsole (using the jconsole command on the command line) is choose or locate the application you want to monitor (see figure 14.10).
Figure 14.10. Connecting to ActiveMQ using JConsole

In this figure, we see a local Java process running. This is the case when ActiveMQ and JCon-sole are started on the same machine. To monitor ActiveMQ on a remote machine, be sure to start a JMX connector from the ActiveMQ configuration file (via the createConnector attribute from the <managementContext> element). Then you can enter host and port information (such as localhost and 1099 in case of a local broker) in the Remote tab, or the full URL (such as service:jmx:rmi:///jndi/rmi://localhost:1099/jmxrmi) in the Advanced tab.
Upon successfully connecting to the local ActiveMQ broker, figure 14.11 demonstrates some of what you are able to see. This figure shows that the ActiveMQ broker exposes information about all of its important objects (connectors, destinations, subscriptions, and so on) via JMX. In this particular example, all the attributes for queue://example.A can be easily viewed. Such information as queue size and number of producers and consumers can be a valuable debugging aid for your applications or the broker itself.
Figure 14.11. Viewing queue properties using JConsole

Besides peaking at the broker state, you can also use JConsole (and the JMX API) to execute MBean methods. If you go to the Operations tab for the destination named queue://example.A, you’ll see all available operations for that particular queue as shown in figure 14.12. This figure shows that the sendTextMessage button allows you to send a simple message to the queue. This can be a simple test tool to produce messages without writing any code.
Figure 14.12. Executing queue operations using JConsole

Now let’s look at another similar tool that’s distributed with ActiveMQ.
14.3.4. Web console
In chapter 9, we saw how an internal web server is used to expose ActiveMQ resources via REST and Ajax APIs. The same web server is used to host the web console, which provides basic management functions via a web browser. Upon starting ActiveMQ using the default configuration, you can visit http://localhost:8161/admin/ to view the web console.
The web console is far more modest in capabilities compared to JConsole, but it allows you to do some of the most basic management tasks using an user interface adapted to ActiveMQ management. Figure 14.13 shows a screenshot of the web console viewing a list of queues with some basic information.
Figure 14.13. Show all queues via the web console page

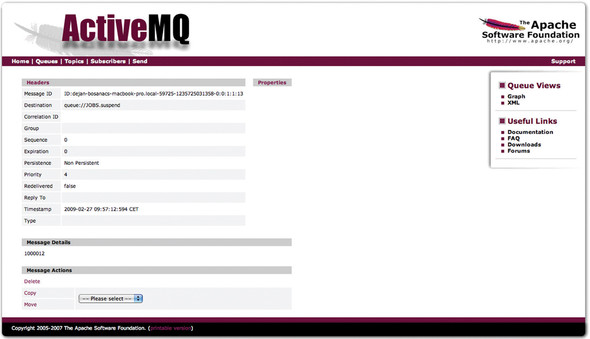
For every destination, you can also execute certain management operations. For example, you can browse, purge, and delete queues, or send, copy, and move messages to various destinations. Figure 14.14 shows the page that displays basic message properties.
Figure 14.14. View a message via the web console page
The ActiveMQ web console provides some additional pages for viewing destinations and sending messages. As stated earlier, this functionality is fairly basic and is meant to be used for development environments, not production environments.
14.4. Configuring ActiveMQ logging
So far we’ve seen how you can monitor ActiveMQ either programmatically or using tools such as JConsole. But there’s one more way you can peek at the broker status, and that’s through its internal logging mechanism. When you experience problems with the broker’s behavior, the first and most common place to begin looking for a potential cause of the problem is the data/activemq.log file. In this section you’ll learn how you can adjust the logging to suit your needs and how it can help you in detecting potential broker problems.
In this section we’ll see how we can adapt ActiveMQ logging for brokers and clients. We’ll also introduce a logging interceptor that can be used to track messages between brokers and clients. Let’s start with the broker-related logging discussion.
14.4.1. Broker logging
ActiveMQ uses the Apache Commons Logging API (http://mng.bz/xdQM) for its internal logging purposes. So if you embed ActiveMQ in your Java application, it’ll fit whatever logging mechanisms you already use. The standalone binary distribution of ActiveMQ uses Apache Log4J (http://mng.bz/940F) library as its logging facility.
The ActiveMQ logging configuration can be found in the conf/log4j.properties file. By default, it defines two log appenders: one that prints to standard output, and another that prints to the data/activemq.log file. The following listing shows the standard Log4J logger configuration.
Listing 14.12. Default logger configuration
log4j.rootLogger=INFO, stdout, out
log4j.logger.org.apache.activemq.spring=WARN
log4j.logger.org.springframework=WARN
log4j.logger.org.apache.xbean.spring=WARN
As you can see in listing 14.12, by default ActiveMQ will only print messages with a log level of INFO or above, which should be enough for you to monitor its usual behavior. In case you detect a problem with your application and want to enable more detailed debugging, you should change the level for the root logger to DEBUG. Just be aware that the DEBUG logging level will output considerably more logging information, so you’ll probably want to narrow debug messages to a particular Java package. To do this, you should leave the root logger at the INFO level and add a line that enables debug logging for the desired class or package. For example, to enable trace-level logging for the TCP transport, add the following configuration to the conf/log4j.properties file:
log4j.logger.org.apache.activemq.transport.tcp=TRACE
After making this change in the conf/log4j.properties file and restarting ActiveMQ, you’ll begin to see the following log output:
TRACE TcpTransport
- TCP consumer thread for tcp:///127.0.0.1:49383 starting
DEBUG TcpTransport
- Stopping transport tcp:///127.0.0.1:49383
TRACE TcpTransport
- TCP consumer thread for tcp:///127.0.0.1:49392 starting
DEBUG TcpTransport
- Stopping transport tcp:///127.0.0.1:49392
In addition to starting/stopping ActiveMQ after changing the logging configuration, one common question is how to change the logging configuration at runtime. This is a reasonable request, since you may not want to stop ActiveMQ to change the logging configuration. Luckily, you can use the JMX capabilities in ActiveMQ along with JConsole to achieve this. Just make the necessary changes to the conf/log4j.properties file and save them. Then open JConsole and select the Broker MBean as shown in figure 14.15.
Figure 14.15. Reload Log4J config using JConsole

Locate the button reloadLog4jProperties on the Broker MBean’s Operations tab. Click the button named reloadLog4jProperties and the conf/log4j.properties file will be reloaded and your changes will be applied.
In addition to logging from the broker side, logging is also available on the client side.
14.4.2. Client logging
Logging on the broker side is definitely necessary, but how do you debug problems on the client side in your Java applications? The ActiveMQ Java client APIs use the same logging approach as the broker, so you can use the same style of Log4J configuration file in your client application as well. In this section we’ll show you a few tips on how you can customize client-side logging and see more information about what’s going on inside the client-to-broker communication.
For starters, a Log4J configuration file must be made available to the client-side application. The following listing shows an example Log4J configuration file that will be used in this section.
Listing 14.13. Client logging
log4j.rootLogger=INFO, out, stdout

log4j.logger.org.apache.activemq.spring=WARN
log4j.logger.org.springframework=WARN
log4j.logger.org.apache.xbean.spring=WARN

log4j.logger.org.apache.activemq.transport.failover.FailoverTransport=DEBUG
log4j.logger.org.apache.activemq.transport.TransportLogger=DEBUG
As you can see, the standard INFO level is being used for the root logger. Additional configuration has been added (marked in bold) to monitor the failover transport and TCP communication.
Now, let’s run our stock portfolio publisher example, but with some additional properties that will allow us to use logging settings previously defined.
$ mvn exec:java
-Dlog4j.configuration=file:
src/main/resources/org/apache/activemq/book/ch14/log4j.properties
-Dexec.mainClass=org.apache.activemq.book.ch14.advisory.Publisher
-Dexec.args="failover:(tcp://localhost:61616?trace=true) CSCO ORCL"
The log4j.configuration system property is used to specify the location of the Log4J configuration file. Also note that the trace parameter has been set to true via the transport connection URI. Along with setting the TransportLogger level to DEBUG, this will allow all the commands exchanged between the client and the broker to be easily viewed.
Let’s say an application is started while the broker is down. What will be seen in the log output are messages like the following:
2009-03-19 15:47:56,699 [ublisher.main()] DEBUG FailoverTransport
- Reconnect was triggered but transport is not started yet.
Wait for start to connect the transport.
2009-03-19 15:47:56,829 [ublisher.main()] DEBUG FailoverTransport
- Started.
2009-03-19 15:47:56,829 [ublisher.main()] DEBUG FailoverTransport
- Waking up reconnect task
2009-03-19 15:47:56,830 [ActiveMQ Task ] DEBUG FailoverTransport
- Attempting connect to: tcp://localhost:61616?trace=true
2009-03-19 15:47:56,903 [ActiveMQ Task ] DEBUG FailoverTransport
- Connect fail to: tcp://localhost:61616?trace=true, reason:
java.net.ConnectException: Connection refused
2009-03-19 15:47:56,903 [ActiveMQ Task ] DEBUG FailoverTransport
- Waiting 10 ms before attempting connection.
2009-03-19 15:47:56,913 [ActiveMQ Task ] DEBUG FailoverTransport
- Attempting connect to: tcp://localhost:61616?trace=true
2009-03-19 15:47:56,914 [ActiveMQ Task ] DEBUG FailoverTransport
- Connect fail to: tcp://localhost:61616?trace=true, reason:
java.net.ConnectException: Connection refused
2009-03-19 15:47:56,915 [ActiveMQ Task ] DEBUG FailoverTransport
- Waiting 20 ms before attempting connection.
2009-03-19 15:47:56,935 [ActiveMQ Task ] DEBUG FailoverTransport
- Attempting connect to: tcp://localhost:61616?trace=true
2009-03-19 15:47:56,937 [ActiveMQ Task ] DEBUG FailoverTransport
- Connect fail to: tcp://localhost:61616?trace=true, reason:
java.net.ConnectException: Connection refused
2009-03-19 15:47:56,938 [ActiveMQ Task ] DEBUG FailoverTransport
- Waiting 40 ms before attempting connection.
With debug level logging enabled, the failover transport provides a detailed log of its attempts to establish a connection with the broker. This can be extremely helpful in situations where you experience connection problems from a client application.
Once a connection with the broker is established, the TCP transport will start tracing all commands exchanged with the broker to the log. An example of such traces is shown next:
2009-03-19 15:48:02,038 [ActiveMQ Task  ] DEBUG FailoverTransport
- Waiting 5120 ms before attempting connection.
2009-03-19 15:48:07,158 [ActiveMQ Task  ] DEBUG FailoverTransport
- Attempting connect to: tcp://localhost:61616?trace=true
2009-03-19 15:48:07,162 [ActiveMQ Task  ] DEBUG Connection:11
- SENDING: WireFormatInfo {...}
2009-03-19 15:48:07,183 [127.0.0.1:61616] DEBUG Connection:11
- RECEIVED: WireFormatInfo { ... }
2009-03-19 15:48:07,186 [ActiveMQ Task  ] DEBUG Connection:11
- SENDING: ConnectionControl { ... }
2009-03-19 15:48:07,186 [ActiveMQ Task  ] DEBUG FailoverTransport
- Connection established
2009-03-19 15:48:07,187 [ActiveMQ Task  ] INFO FailoverTransport
- Successfully connected to tcp://localhost:61616?trace=true
2009-03-19 15:48:07,187 [127.0.0.1:61616] DEBUG Connection:11
- RECEIVED: BrokerInfo { ... }
2009-03-19 15:48:07,189 [ublisher.main()] DEBUG Connection:11
- SENDING: ConnectionInfo { ... }
2009-03-19 15:48:07,190 [127.0.0.1:61616] DEBUG Connection:11
- RECEIVED: Response {commandId = 0, responseRequired = false,
correlationId = 1}
2009-03-19 15:48:07,203 [ublisher.main()] DEBUG Connection:11
- SENDING: ConsumerInfo { ... }
2009-03-19 15:48:07,206 [127.0.0.1:61616] DEBUG Connection:11
- RECEIVED: Response { ... }
2009-03-19 15:48:07,232 [ublisher.main()] DEBUG Connection:11
- SENDING: SessionInfo { ... }
2009-03-19 15:48:07,239 [ublisher.main()] DEBUG Connection:11
- SENDING: ProducerInfo { ... }
Sending: {offer=51.726420585933745, price=51.67474584009366,
up=false, stock=CSCO}
on destination: topic://STOCKS.CSCO
2009-03-19 15:48:07,266 [ublisher.main()] DEBUG Connection:11
- SENDING: ActiveMQMapMessage { ... }
2009-03-19 15:48:07,294 [127.0.0.1:61616] DEBUG Connection:11
- RECEIVED: Response { ... }
Sending: {offer=94.03931872048393, price=93.94537334713681,
up=false, stock=ORCL}
on destination: topic://STOCKS.ORCL
For the purpose of readability, some details of specific commands have been left out except for one log message, which is marked bold. These traces provide a full peek into the client-broker communication, which can help to narrow application connection problems further.
This simple example shows that with a few minor configuration changes, many more logging details can be viewed. But beyond standard Log4J-style logging, ActiveMQ also provides a special logger for internal broker events.
14.4.3. Internal broker event logging
The previous sections demonstrated how the broker side and the client side can be monitored through the use of standard Log4J logging. Similar functionality is available on the broker side for internal broker operations using a logging interceptor (aka logging plug-in). ActiveMQ plug-ins were introduced in chapter 6 where you saw how they can be used to authenticate client applications and authorize access to broker resources. The logging interceptor is a simple broker plug-in that uses the broker’s internal event mechanism to log internal broker events. The types of events that are logged can be controlled via the configuration of the logging plug-in using the properties shown in table 14.2.
Table 14.2. Logging plug-in properties
|
Property name |
Default value |
Description |
|---|---|---|
| logAll | false | Log all events |
| logMessageEvents | false | Log only events related to producing, consuming, and dispatching messages |
| logConnectionEvents | true | Log only events related to connections and sessions |
| logTransactionEvents | false | Log only events related to transaction handling |
| logConsumerEvents | false | Log only events related to message consumption |
| logProducerEvents | false | Log only events related to message production |
| logInternalEvents | false | Log only events related to internal broker operations such as failover, querying internal objects, and so on |
The logging plug-in is useful for seeing more information about the broker’s internal events. This can be useful for debugging purposes during development as well as for informational purposes during production deployment. It provides more finite logging for particular event types and allows you to see more information about what the broker’s doing.
To install this plug-in, add the <loggingBrokerPlugin/> element to the list of your plug-ins in the conf/activemq.xml configuration file. Here’s an example of this:
...
    <plugins>
      <loggingBrokerPlugin/>
    </plugins>
...
After restarting the broker, you’ll see output indicating that the logging plug-in has been activated. After table 14.2 we see an example of such output during the broker startup.
...
Loading message broker from: xbean:activemq.xml
 INFO | Created LoggingBrokerPlugin: LoggingBrokerPlugin(logAll=false,
logConnectionEvents=true, logConsumerEvents=false,
logProducerEvents=false, logMessageEvents=false,
logTransactionEvents=false, logInternalEvents=false)
...
Note that the logging plug-in is using the default configuration. Send some messages to the broker, and you’ll see the following output from the broker:
...
INFO | Adding Connection :
org.apache.activemq.broker.ConnectionContext@1c45ce17
INFO | Adding Session : SessionInfo {commandId = 3, responseRequired =
false, sessionId = ID:mongoose.local-58504-1278340965484-0:0:1}
INFO | Removing Session : SessionInfo {commandId = 0, responseRequired =
false, sessionId = ID:mongoose.local-58504-1278340965484-0:0:-1}
INFO | Removing Session : SessionInfo {commandId = 3, responseRequired =
false, sessionId = ID:mongoose.local-58504-1278340965484-0:0:1}
INFO | Removing Connection : ConnectionInfo {commandId = 1,
responseRequired = true, connectionId =
ID:mongoose.local-58504-1278340965484-0:0,
clientId = ID:mongoose.local-58504-1278340965484-1:0, userName = null,
password = *****, brokerPath = null, brokerMasterConnector = false,
manageable = true, clientMaster = true}
...
Note that the output indicates that a connection and session were added to the broker (a connection and a session were created), and a connection and session were removed from the broker (a connection and session were destroyed). These are events that are logged from a producer connecting to the broker, sending some messages, and disconnecting from the broker. If you want to see more detailed information, then you need to enable the appropriate logging properties as listed in table 14.2.
Coupled with the other logging techniques, the logging interceptor can help you to gain a much better perspective of the internal broker activities while building message-oriented systems.
14.5. Summary
After we learned how to configure the broker and write applications using it, this last chapter showed us how we can administer and monitor ActiveMQ instances in production. We saw how we can do it programmatically and also covered some of the tools most often used for this purpose.
With this discussion, we’ve come to the end of the topics planned for this book. We hope you enjoyed reading it, and that it helps bring your ActiveMQ and messaging knowledge to the next level. This should by no means be the end of your journey into ActiveMQ, since it’s a project that is being continuously developed and improved.