


Troubleshooting PureApplication System Environment
This chapter describes how to troubleshoot IBM PureApplication System. The concentration is on problems that can affect the user or customer in the following environments:
•PureApplication systems
•Guest virtual machine (VM)
•Virtual applications
•IBM support
Troubleshooting is a technique to solve the problem. The problem within a PureApplication System environment can take many forms, including PureApplication System, poor performance, virtual system and application, unavailability, and unexpected results. The first step in resolving a problem is to isolate and understand it.
The following topics are covered in this chapter:
8.1 Troubleshooting overview
IT infrastructure environments have advanced and there are many levels of redundancy that provide continuous availability of software, systems, and infrastructure. Even with all the advances, hardware and software components can unexpectedly stop functioning. When a failure occurs, it is necessary to collect as much information as possible to assist with problem determination and root cause analysis (RCA). IBM PureApplication System provides a set of troubleshooting functions to enhance the examination of failed hardware or software components. It automatically captures all logs from management software, firmware, and hardware in a rack.
For a user to troubleshoot a problem on PureApplication System, they must be assigned correct roles and permissions. To perform troubleshooting steps, the user needs the hardware administration role with permission to manage hardware resources (full permission).
PureApplication System automatically creates several log files to determine the problems in hardware and software components. Of the many logs that are created, the following types of logs are included:
•System Logs
System logs consist of underlying hardware, firmware, system components, and management nodes. System logs can be accessed by using the PureApplication System console.
•Workload Logs
Workload logs consist of operating system logs from virtual machines, middleware (such as WebSphere, DB2, and scripts), logs from within VMs that are related to middleware runtime components, and configuration scripts. Workload logs can be accessed by using the PureApplication Workload console.
Figure 8-1 shows the troubleshooting breakdown of System and Workload logs.
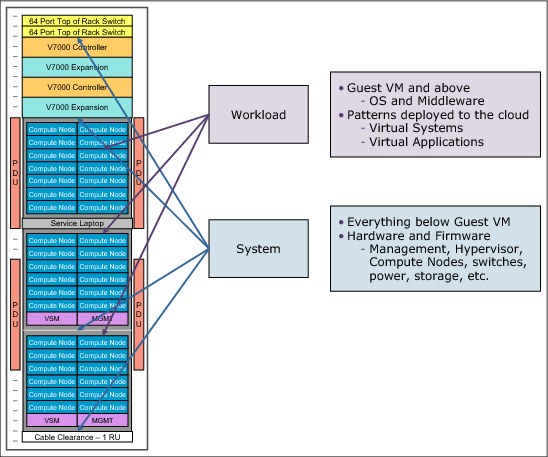
Figure 8-1 Troubleshooting breakdown logs
8.2 Consoles available for PureApplication System troubleshooting
The following sections describe the two consoles that are available for PureApplication System to troubleshoot a problem:
•System Console
•Workload Console
8.2.1 System Console
To troubleshoot system-related issues and diagnose problems, use the troubleshooting panel, as shown in Figure 8-2.
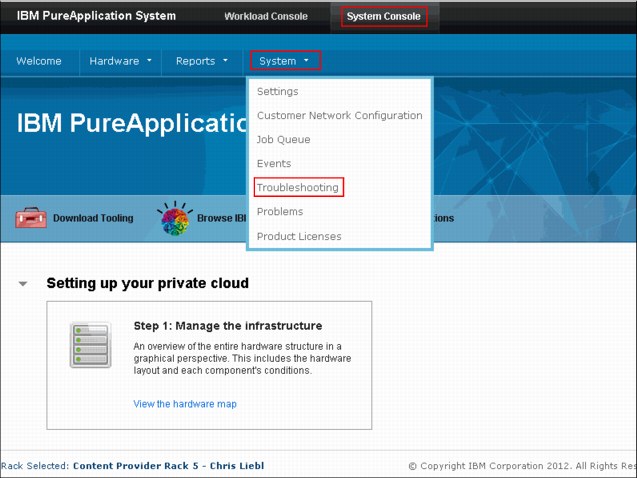
Figure 8-2 Troubleshooting panel
Enabling shell account
To troubleshoot the system features, you must enable the shell account to access the system’s features. After you create the shell account, you can enter the help command in the shell to display the list of available commands.
Complete the following steps to create the shell account, as shown in Figure 8-2 on page 332.
1. Browse to System Console → System → Troubleshooting.
2. Expand the shell account.
3. Enter a password in the password of current user field.
4. Click Create.
System console user interface for user tasks
The system console user interface is used to access tasks that are related to troubleshooting information and actions.
There are several options for troubleshooting information, such as events, problems, and guided and service tasks, as shown in Figure 8-3.
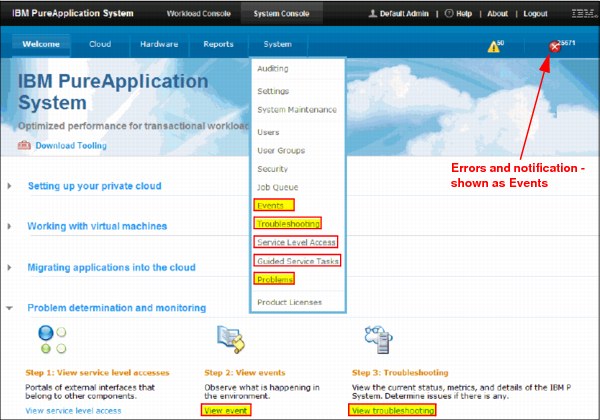
Figure 8-3 System console user interface for user tasks
The following options are available for troubleshooting:
•Events: A central view for events (errors and notifications) sent by different components.
•Troubleshooting: Contains system logs, vendor information, LEDs, and other information.
•Service Level Access: Access is restricted and is available only to IBM Customer Engineers. IBM Customer Engineers have access to complete all hardware maintenance and upgrades and updates to hardware firmware and system software.
•Guided Service Tasks: Access is restricted and is available only to IBM Customer Engineers. In Guided Services tasks, level access for IBM Customer Engineer provides tools to access advanced service level access panels (for access to underlying system panels).
•Problems: Contains a list of problems in the system for which the IBM PureApplication System customer might open a service request with the IBM support team.
System logs, collection logs, traces, and LED status
This section describes system logs, collection logs, traces, and LED status. It outlines the following features and important usage information:
•System logs: These logs come from underlying hardware components and system software.
– The issues that are related to VM and include mainly hardware, system software, and storage networking.
– Trace settings can be specified here as requested by from the IBM support team.
– Actions, such as the collection of these logs, are accessed through System Logs, as shown in Figure 8-4.
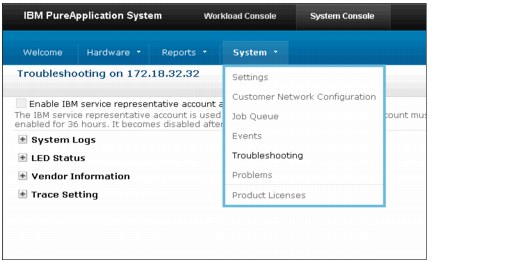
Figure 8-4 System logs pane
On the left side of the pane, System Logs has a + icon next to it. Click + to expand System Logs to access the function that are used to collect system logs, as shown in Figure 8-4.
Click Collect System Logs to access its options, as shown in Figure 8-5.
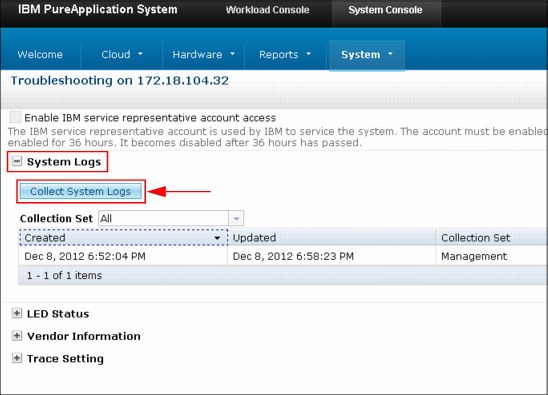
Figure 8-5 Collection System Logs
When the Request System Logs pane opens, select a collection that is set from the drop-down menu, as shown in Figure 8-6.
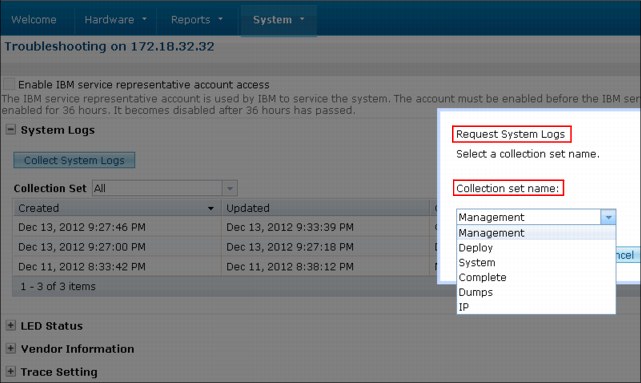
Figure 8-6 Request System Logs pane
The following capabilities are available for capturing system data for troubleshooting:
•Collection Logs:
– Captures continuous collection logs and on-demand logs.
• Continuous logs are gathered asynchronously. These logs rotate daily, weekly, and monthly to regulate disk usage.
• On-Demand logs are collected when a user requests to extract the logs.
– Supports compression and retrieval from either of two active PureApplication System Management nodes.
– Client requested logs: These logs are collected into a single .zip file for the user and there is no built-in viewer of the log. The following options for logs are available from the user interface:
• Management: Captures only PureApplication System software logs on the PureApplicaiton System management node.
• Deploy: Latest version of workload console action logs.
• System: The default logs that collect the management, deploy and syslogs from remote systems, and firmware syslogs.
• Dumps: Contains the Java virtual machine dumps from PureApplication System node.
• Complete: Collects system and historical deployment logs.
• IP (IP address): Collects specific on-demand items from the IP, such as dumps and configuration.
An example of the collection set logs is shown in Figure 8-7.
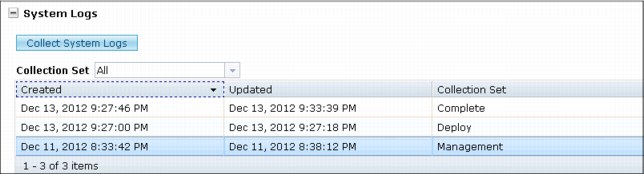
Figure 8-7 Collection set logs
•Trace Settings: Used to add details in the logs.
There are multiple trace levels, such as OFF, SEVERE, WARNING, INFO, FINE, FINER, FINEST, and ALL, as shown in Figure 8-8.
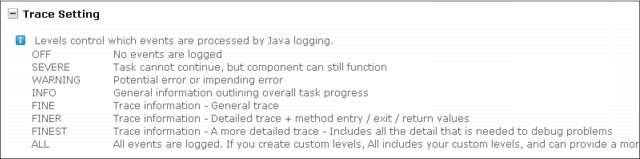
Figure 8-8 Trace settings
•LED Status
LED status is ON or OFF. This status shows you whether a component is ON or OFF, as shown in Figure 8-9.
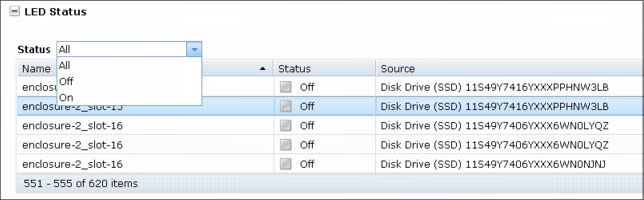
Figure 8-9 LED Status panel
•Vendor Information: This setting is an information only collection.
Allows client or IBM SSR to see the information about a vendor, such as serial number and other details, as shown in Figure 8-10.
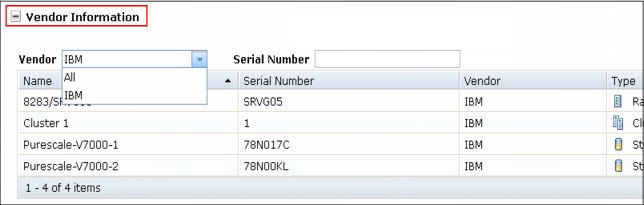
Figure 8-10 Vendor information
System events
System events generate the events of PureApplication System components. System events use Simple Network Management Protocol (SNMP) for generating these events for those system components. You can filter the system events that are based on type, severity, category, and time interval, as shown in Figure 8-11.
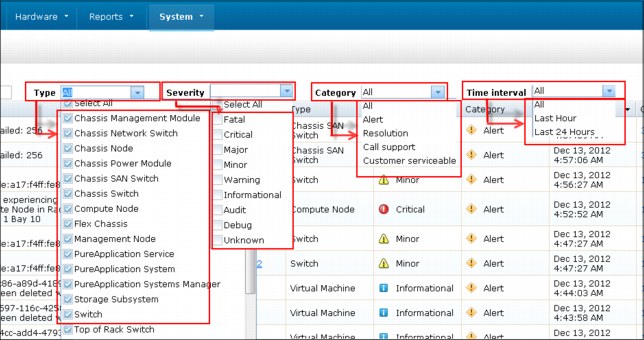
Figure 8-11 System events
Infrastructure map
The infrastructure map shows the entire rack and its components. This map contains important information to help you troubleshoot and with the performance of PureApplication System. There are two views to see the infrastructure map: Graphical and Tree.
The Graphical view is shown in Figure 8-12.
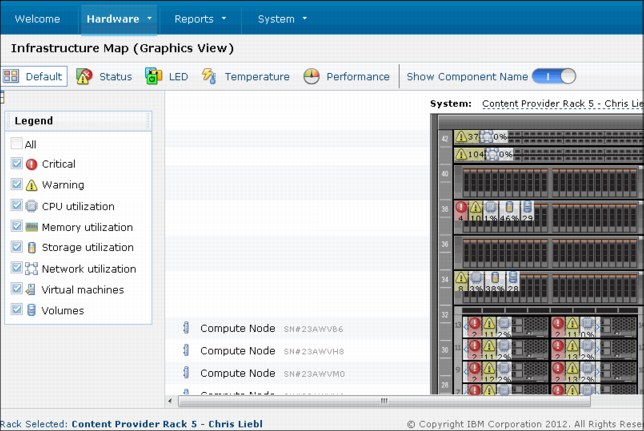
Figure 8-12 Graphical view of the infrastructure map
To switch your view of the infrastructure map from graphical to tree view, click Switch to Tree View from within the System Console pane, as shown in Figure 8-13.
Figure 8-13 Switch option for views of the infrastructure map
The infrastructure map tree view is shown in Figure 8-14.
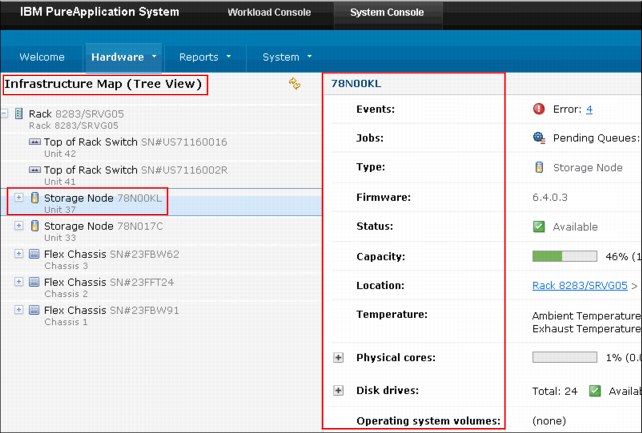
Figure 8-14 Tree view of infrastructure map
8.2.2 Workload Console
Workload Console is used to troubleshoot the deployed virtual application instances and virtual systems. Virtual applications have common troubleshooting capabilities that are provided by the foundation pattern type.
To troubleshoot issues that are related to virtual applications and virtual systems, use the Workload Console, as shown in Figure 8-15.
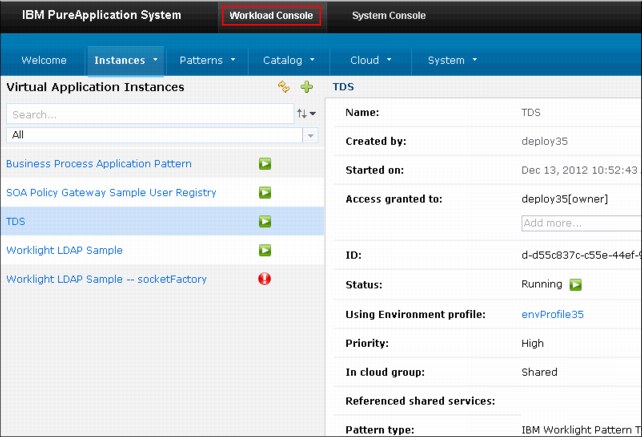
Figure 8-15 Workload Console
Virtual application instance
To troubleshoot the virtual application patterns that are based on the pattern types, enable the pattern type and configure the system plug-ins for those pattern types (where applicable). Enabling and configuring must be done to view or create the virtual application patterns.
To see the virtual application instance logs, click Workload Console → Instances → All instances. Select Virtual Application and double-click the selected Virtual Application.
You can see the components that are related to the virtual application instance view. These components include middleware logs and the operations menu, as shown in Figure 8-16.
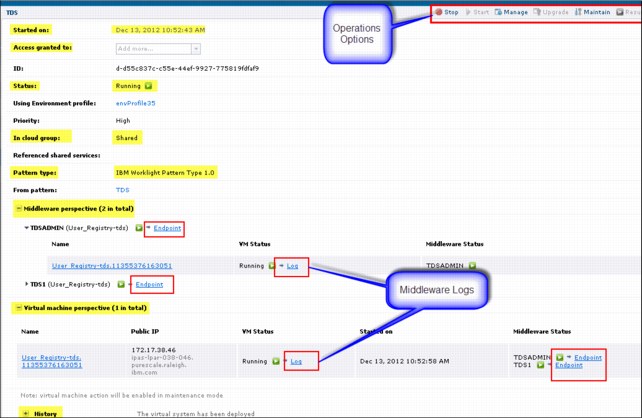
Figure 8-16 Virtual application instance view
As shown in Figure 8-16 on page 342, when the virtual application is started, then the status, type of cloud group, type of pattern that is used for this application, middleware logs, and endpoints are displayed. You can see the middleware log viewer by clicking log in the middleware prospective. The log then displays, as shown in Figure 8-17.
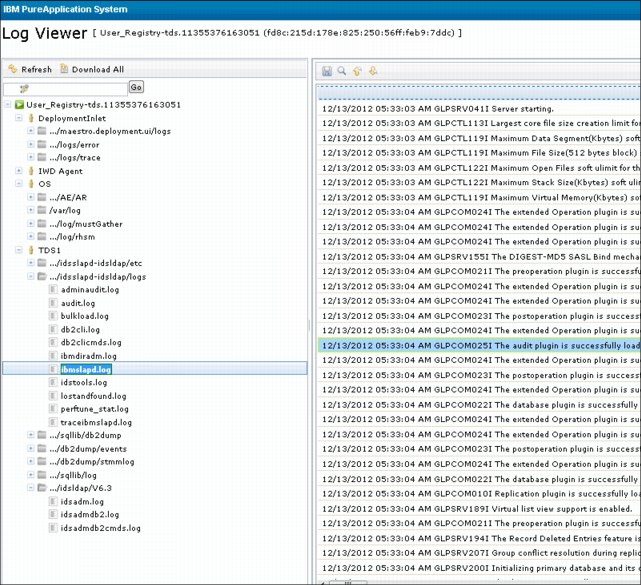
Figure 8-17 Virtual machine middleware log viewer
In Log viewer, you can download the logs or you can view the log in a browser. You can see logs from the operating system, agent, middleware, and user registries. Figure 8-17 shows those options and as an example, TDS1 was selected. TDS1 is a virtual application middleware instance. The pane shows the logs available for the IBM directory server.
Configure the trace for workload agent
Workload agent tracing must be enabled to debug and troubleshoot problems that are related to the workload agent process. The following methods are available to enable the tracing:
•Existing
To enable tracing for existing virtual application instance workload agent trace settings, complete the following steps:
a. Browse to Workload Console → Instances → Virtual Applications, then select the application instance.
b. Click Manage, then click Operation, and select the agent role from the list of operations.
c. The detail page displays the configuration options. Expand the Update agent trace settings by clicking the + icon, and specify the appropriate settings, as shown in Figure 8-18.
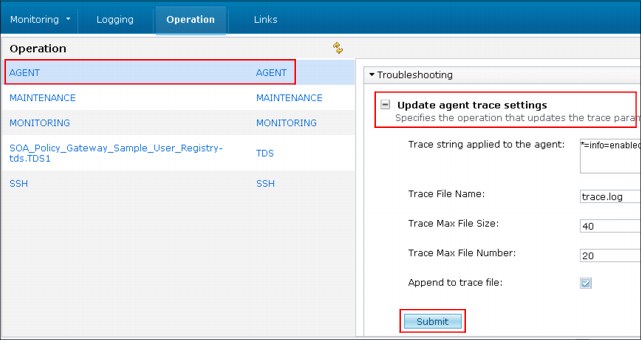
Figure 8-18 Existing virtual application instance workload agent trace settings
•New
To enable tracing for all new virtual application deployments, configure the workload agent plug-in to enable tracing of the workload agent process. Complete the following steps to enable this type of tracing:
a. Browse to Workload Console → Cloud → System Plug-ins → Foundation Pattern Type.
b. From the drop-down list, select the agent plug-in that you want.
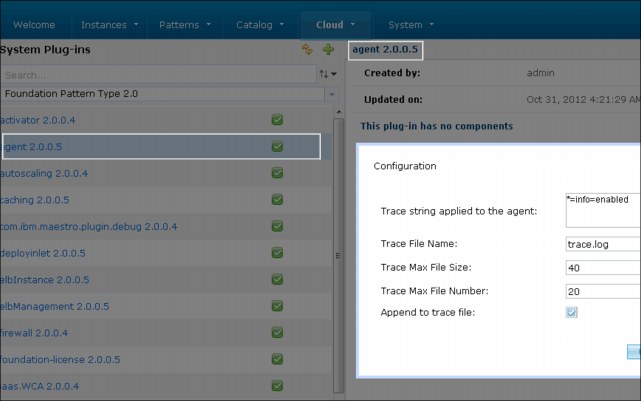
Figure 8-19 New virtual application deployments and workload agent trace settings
Virtual system instance
The virtual system instances panel is used to view and download the log files, access the administration console, and enable various traces.
To troubleshoot the virtual system instances problems, use the virtual system instances panel. You can access that panel by browsing to Workload Console → Instances → Virtual Systems.
During deployment of the virtual system instance, enable the Secure Shell (SSH) and virtual network computing (VNC) options to access the SSH and VNC session. SSH is a method of securely communicating to target or another computer. VNC is a method of communicating to target or another computer in graphics mode. You can enable traces by using the WebSphere console.
The virtual system instance panel for each virtual machine can be opened. You can log in to the virtual machines as a root user, as shown in Figure 8-20.
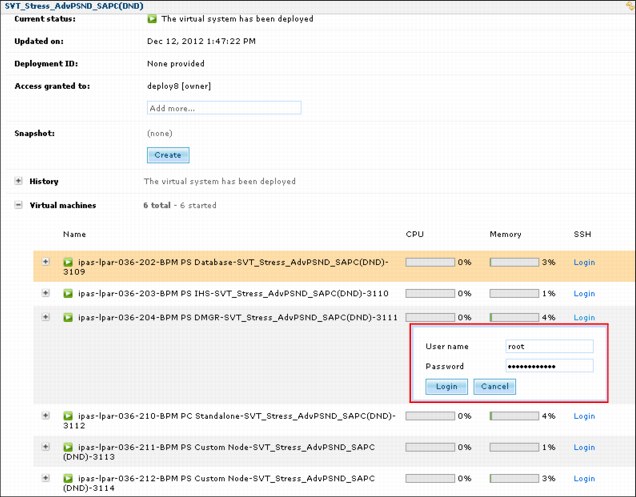
Figure 8-20 SSH login to virtual machine
You can download or view the logs of any virtual machine, as shown in Figure 8-21 on page 347.
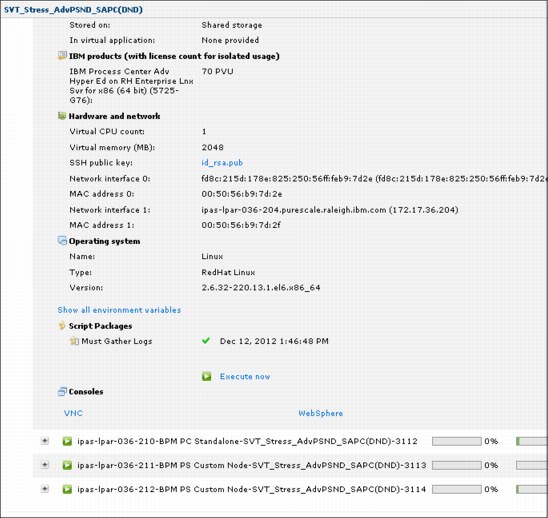
Figure 8-21 Download or view log files
8.3 Command-line interface
This section describes problem determination by using the command-line interface (CLI) and working with IBM PureApplication System W1500 and W1700. This section covers how CLI is used with objects for problem determination and multi-byte character sets.
The following types of objects are available for problem determination:
•Diagnostics objects
•Trace objects
•Errors objects
Diagnostics object
Diagnostics objects represent the diagnostics package for the IBM PureApplication System.
By using CLI, you can access help for a diagnostics object. To use help, pass the diagnostics object as an argument to the help() function, as shown in Example 8-1.
Example 8-1 Diagnostics object help by using a command line
>>> help(deployer.diagnostics)
The following diagnostics object methods are available:
•get method
The get method downloads the diagnostics package as a compressed file. This method takes an optional path where the file is stored. The default path is ./diagnostics.zip, as shown in Example 8-2.
Example 8-2 Default path for get method
>>> deployer.diagnostics.get()
>>> deployer.diagnostics.get('/some/path/diagnostics.zip')
•getLatest method
The getLatest method downloads a diagnostics package as a compressed file that contains only the latest version of the diagnostics files and is a much smaller file size. This method takes an optional path where the file is stored. The default path is ./diagnostics.zip, as shown in Example 8-3.
Example 8-3 Default path for getLatest method
>>> deployer.diagnostics.getLatest()
>>> deployer.diagnostics.getLatest('/some/path/diagnostics.zip')
Trace object
Trace objects represent running trace files on the IBM PureApplication System.
By using CLI, you can access help for trace objects. To use help, pass the trace object as an argument to the help() function, as shown in Example 8-4.
Example 8-4 Trace method
>>> help(deployer.trace)
The following methods are available for trace objects:
•Add: This method adds a logger and optional log level to the trace file specification. The default value is OFF. Logger names use Java package name syntax and the log levels are one of the following values:
– OFF
– SEVERE
– WARNING
– CONFIG
– INFO
– FINE
– FINER
– FINEST
Example 8-5 shows the add method in use with a logger value.
Example 8-5 Add method
>>> deployer.trace.add('com.ibm.ws.deployer', 'FINE')
>>> deployer.trace.add('com.ibm.ws.deployer.not.interested')
•Remove: This method removes an existing logger from the trace file specification. Logger names use Java package name syntax, as shown in Example 8-6.
Example 8-6 Remove method
>>> deployer.trace.remove('com.ibm.ws.deployer.not.interested')
•Set: This method sets the log level for an existing logger in the trace file specifications. Logger names use Java package name syntax and the log levels are one of the following values:
– OFF
– SEVERE
– WARNING
– CONFIG
– INFO
– FINE
– FINER
– FINEST
Example 8-7 shows the set method that uses logger values.
Example 8-7 Set method with logger value
>>> deployer.trace.set('com.ibm.ws.deployer', 'FINE')
>>> deployer.trace.set('com.ibm.ws.deployer', 'SEVERE')
•Spec: This method returns a map with the trace file specification for the IBM PureApplication System. The map has key-value pairs in which the key is the package name and the value is the log level.
•Tail: In this method, tail prints the last <n> lines of the file, where <n> is an integer. The default value is 10. Example 8-8 shows the tail method with integer values.
Example 8-8 Tail method with integer values
>>> deployer.trace.tail(10)
>>> deployer.errors.tail(100)
Errors object
Errors objects return an ErrorFile object that represents the running error file on the IBM PureApplication System.
Use the CLI to access help for errors objects. For help, pass the Errors object as an argument to the help() function, as shown in Example 8-9.
Example 8-9 Errors object
>>> help(deployer.errors)
The errors object has one method, the tail method. The tail method prints the last <n> lines of the file, in which <n> is an integer. The default value is 10. The tail method is shown in Example 8-10.
Example 8-10 Tail method
>>> deployer.trace.tail()
>>> deployer.errors.tail(100)
Resolving CLI errors when multi-byte character sets are used
Codecs are commonly used for languages with multi-byte characters. You can see the errors when you use the codecs. Jython 2.5.1 errors most commonly occur when the CLI is used in interactive mode. Errors usually occur as LookupErrors, which indicates that your encoding is unknown. If you are using Jython 2.5.1 in a multi-byte character set, you can see a LookupError error, as shown in Example 8-11.
Example 8-11 LookupError
LookupError: unknown encoding 'gb2312'
If you have LookupErrors by using the CLI, complete the following steps to resolve the issue:
1. Determine the firmware version of the particular system. Identify the lib directory that corresponds to the firmware version of the IBM PureApplication System. The deployer.cli/lib directory contains one subdirectory for each PureApplication System firmware version with which the CLI communicated. Use the following command format to determine the firmware version of particular system:
$ pure -h <system_hostname> -u <username> -p <password> -c deployer.version
Example 8-12 shows the command that is used to determine the version of firmware for system.
Example 8-12 Command to check firmware version for system
$ pure -h mysystem.foo.com -u cbadmin -p pw -c deployer.version
The output of the command that is used in Example 8-12 returns the following information:
System at mysystem.foo.com firmware version 3.0.0.0-30839
The lib directory for the output from Example 8-12 is in the following location:
pure.cli/lib/3.0.0.0-30839
2. Update the registry file. Complete the following steps to update this file:
a. Uncomment the following lines:
# python.console.encoding=iso-8859-1
# deployer.console.encoding=gb2312
b. Update deployer.console.encoding to specify the correct codec for your environment. As an example, the following list includes specific codecs for certain locales:
• Simplified Chinese: deployer.console.encoding=gb2312
• Traditional Chinese: deployer.console.encoding=big5
• Japanese: deployer.console.encoding=shift_jis
• Korean: deployer.console.encoding=ks_c_5601-1987
• Western European: deployer.console.encoding=ibm850
c. Ensure that you add a back slash, () ,as an escape sequence to these characters (a, , f,
,
, ,x,v). These characters also are known as string literals when directories or file paths are specified.
An example of these string literals is shown in Example 8-13.
Example 8-13 String literals
c:\foo.tgz
d. Restart the CLI.
8.4 Product logs and tracing
Product logs and messages can be a good resource to troubleshoot the problems. This section describes the messaging framework and explains logging customization options.
8.4.1 Enable product tracing
Product tracing is enabled on the server and the client. These options are described next.
Server-side component of the Eclipse client
A trace log level is needed to set the global log level, an individual component, or logger. In RAFW_HOME/logging.properties, trace log levels are SEVERE, WARNING, INFO, CONFIG, FINE, FINER, FINEST, and ALL.
To enable tracing for all components, complete the following steps:
1. Set the global logging level to one of the trace levels:
# Default global logging level is ALL
level=ALL
2. Run the command or action that caused the problem.
3. Review the messages in the product logs.
4. To see more messages, set the global logging level to a higher trace level and rerun the command or action.
5. Fix the problem.
6. Reset the global logging level to INFO.
Client-side components of the Eclipse client
To enable tracing on the client, complete the following steps:
1. Start the Eclipse client, and set the Java virtual machine property (in the log4j.xml configuration file or in the rafui.ini file). Use the following options to set the Java virtual machine property:
– By using the CLI, start the Eclipse client by issuing the following command:
RAF_CLIENT_HOME
afui.exe -vmargs -Dcom.ibm.rational.raf.tracing.configfile=path_to_ log4j_config_file
– You can modify the shortcut to start the Eclipse client. To do so, right-click the shortcut to the Eclipse client, and click Properties. In the Target field (after the path), add -vmargs -Dcom.ibm.rational.raf.tracing.configfile=path_to_ log4j_config_file. Start the Eclipse client by using the modified shortcut.
– You can modify the rafui.ini file. To do so, open the RAF_CLIENT_HOME
afui.ini file. After the vmargs section, add -Dcom.ibm.rational.raf.tracing.configfile=path_to_ log4j_config_file.
2. Save and close the file.
8.4.2 Product logs
Product logs contain generated messages from product commands and actions, which are sent to the standard output stream.
Message severity levels are determined where the messages are logged.
Standard output stream
In a standard output stream, messages are found from all components that are of the level of INFO and higher. The following rules apply to the standard output stream:
•When global logging is set to the default (.level=INFO), all messages of INFO level and higher are sent to the standard output stream.
•Commands or actions that are run on the framework server. Standard out messages are sent to the terminal.
•Commands or actions that are run in the web client. Standard out messages are sent to the step logs for the job.
•Actions that are run on the target system. Standard out messages are generated that are sent to an action.log file that is saved to the RAFW_HOME/logs directory on the framework server.
|
Important: If you decrease the global logging level (for example, from INFO to SEVERE), fewer messages are sent to the standard out.
You cannot increase the messages that are sent to standard out. If you set the global logging level to ALL, messages of severity ALL and higher are sent to product trace logs, but only messages of INFO and higher are sent to standard out.
|
Product logs
Product messages are written to standard output and product logs. The following types of product logs are described in this section:
•Product trace logs
•Action log
•Server and client log
•IBM Tivoli Remote Execution and Access trace log
Product trace logs
Product trace messages are written to different logs, as show in Table 8-1.
Table 8-1 Product trace logs
|
Log files
|
Content or significance
|
|
RAFW_HOME/logs/framework.log.x
|
Actions and other product commands that run on the framework server, or write messages to the framework.log files.
The framework.log files are on the framework server.
|
|
RAFW_HOME/logs/log_scope/action.trace.x
|
Actions that run on target systems and write messages to the action.trace log files. The action.trace files are saved to the framework server.
In the naming structure, action is the name of the action, and
log_scope represents the scope or run path of the action.
The following formats of the log_scope path components are available:
- Cell path: env_name/cell_name/
- Cluster path: env_name/cell_name/cluster_name/
- Node path: env_name/cell_name/node_name/
- Server path: env_name/cell_name/node_name/server_name/
|
|
RAFW_HOME/logs/wsadmin.trace.x
|
On target systems, actions run commands that are run by the WebSphere administrative (wsadmin) scripting program. The wsadmin program writes messages to wsadmin.trace files.
The wsadmin.trace files are saved to the framework server.
|
|
RAFW_HOME/logs/log_scope/transfer.trace.x
|
Commands, that run a transfer of shared components and write messages to the transfer.trace file instead of an action.trace file. The transfer.trace file is on the framework server.
Shared components are transferred from the framework server to a target system by running the rafw command without an action.
The scope or run path of the rafw commands are represented by log_scope. The following formats of the log_scope path components are available:
- Cell path: env_name/cell_name/
- Cluster path: env_name/cell_name/cluster_name/
- Node path: env_name/cell_name/node_name/
- Server path: env_name/cell_name/node_name/server_name/
|
Action log
Actions are run in remote target systems. Messages that are directed to standard output on the remote target system are saved to the action log file, as shown in Table 8-2.
Table 8-2 Action log
|
Log file
|
Content or Significance
|
|
RAFW_HOME/logs/log_scope/action.log
|
Commands that are run on target systems write messages of INFO level and higher to the action.log file. The action.log file is on the framework server. The scope or run path of the action is represented by log_scope. The following format of the log_scope path components is available:
- Cell path: env_name/cell_name/
- Cluster path: env_name/cell_name/cluster_name/
- Node path: env_name/cell_name/node_name/
- Server path: env_name/cell_name/node_name/server_name/
|
Server and client logs
The location of server logs depends on the operating system. Client logs are available on Eclipse client installation directory, as shown in Table 8-3.
Table 8-3 Server and client logs
|
Log file
|
Content or Significance
|
|
UI_ROOTworkspace.metadata.log
|
Contains messages from the Eclipse client regarding client plug-ins and performance issues.
|
|
install_directoryApache omcatlogs
af.date.log
install_directory/server/tomcat/logs/raf.date.log |
Contains messages from the application server and shows the traffic between the Eclipse client and the framework server.
|
IBM Tivoli Remote Execution and Access trace log
The product uses the Tivoli Remote Execution and Access toolkit to authenticate and connect to remote target systems and to transfer files, as shown in Table 8-4.
Table 8-4 IBM Tivoli Remote Execution and Access trace log
|
Log file
|
Content or Significance
|
|
/tmp/rxa_trace.log
|
The Tivoli Remote Execution and Access toolkit writes messages to the rxa_trace.log file.
The default location is /tmp/rxa_trace.log on the framework server.
|
|
Important: The rxa_trace.log cannot be in the RAFW_HOME directory or in any of its subdirectories.
By default, Tivoli Remote Execution and Access message logging is not enabled in RAFW_HOME/logging.properties. Do not enable message logging for the toolkit unless directed to do so by IBM support. Enabling messaging for the toolkit negatively impacts product performance.
|
Accessing product logs
Product log files are in plain text format. You can view the product logs by using any text editor. Log files are stored in the RAFW_HOME/logs directory.
Logging customization
For product trace logs, you can change the logging levels for components and change management options in RAFW_HOME/logging.properties. By using logging customization, you can modify the logging configuration.
The following logging configuration information is available for the server-side component of the Eclipse client:
•The global logging level is set in the RAFW_HOME/logging.properties configuration file.
•The logging.properties file controls the size of the logs that are generated by the interaction between the Eclipse client and the framework server.
•On Windows Systems, the file is in the RAF_SERVER_HOME/Apache/tomcat/webapps/rafservices/WEB-INF/classes directory.
•On Linux Systems, the file is in the RAF_SERVER_HOME/server/tomcat/webapps/rafservices/WEB-INF/classes directory.
•The logging file that controls the number of messages that are generated by the Apache file handler is in org.apache.juli.FileHandler.level.
•The logging file that controls the number of messages that are generated by the server-side component of the Eclipse client is in com.ibm.rational.raf.services.level.
|
Important: If you are running the product from WebSphere Application Server rather than from an Apache Tomcat server, use the administrative console to set logging levels.
|
Log level settings
Log level settings control the quantity of messages that are sent to the product logs. Log levels in the RAFW_HOME/logging.properties file specify the number of messages that are generated for a particular component.
The following supported level values are available:
•SEVERE (the lowest level that includes only severe error messages)
•WARNING
•INFO
•CONFIG
•FINE
•FINER
•FINEST
•ALL (includes all possible messages)
Use the following syntax formula to set the log levels:
property=level
For this formula, change property to the name of the specific logging component. Change level to one of the supported level values.
Components in the RAFW_HOME/logging.properties file are commented out by default, except for the global logging component, which is enabled.
Example 8-14 shows the default global logging level.
Example 8-14 Default global logging level information
# Default global logging level.
.level=INFO
Example 8-15 shows the log level parameters.
Example 8-15 Log Level parameters  # .level=INFO
# example.component.level=ALL
Example 8-16 shows the removal of the comment character (#). This removal is done to activate a specific logging level for a particular component. In this example, INFO level logs are generated for all components except the example.component. All messages are logged for the example.component.
Example 8-16 Activating a specific logging level by removing the # character
.level=INFO
example.component.level=ALL
Global logging component
The global logging component sets the logging level for all components in the RAFW_HOME/logging.properties file. The default level for global logging components is .level. The default log level is INFO in the RAFW_HOME/logging.properties file, as shown in Example 8-17.
Example 8-17 Default global logging level
# Default global logging level.
.level=INFOScope of global logging
Scope of global logging
The global logging level applies to all the components or loggers in the RAFW_HOME/logging.properties file.
Example 8-18 Scope of global logging
# Default global logging level.
.level=INFO
# You can override the global level for various components of the framework #jython.level=CONFIG
#com.ibm.rational.rafw.ant.tasks.RafwLogTask .level=ALL
Overriding the global logging level
For an individual component to override the global logging level, uncomment the component and specify a valid log level, as shown in Example 8-19.
Example 8-19 Overriding the global logging level
# You can override the global level for various components of the framework jython.level=ALL
#com.ibm.rational.rafw.ant.tasks.RafwLogTask.level=SEVERE
Action trace logs and customize logging properties
This section describes customizing the logging property settings. The action trace logs are in the RAFW_HOME/logs/log_scope directory. The following logs are the action logs:
•action.trace
•wasadmin.trace
•transfer.trace
The log_scope represents the run path of the action or of the rafw command. The following formats are available for the log_scope:
•Cell path: env_name/cell_name/
•Cluster path: env_name/cell_name/cluster_name/
•Node path: env_name/cell_name/node_name/
•Server path: env_name/cell_name/node_name/server_name/
Table 8-5 on page 357 describes the customizable logging properties for action trace logs in the RAFW_HOME/logging.properties file.
Table 8-5 Customizable properties for action trace logs
|
Property and default settings
|
Description
|
|
actionlog.count=1
|
The number of logs (0 - 4) per log type in the rolling log sequence.
Messages are written to the current log file of using action.trace.0, wsadmin.trace.0, or transfer.trace.0.
Logs are stored at the log_scope that represents the run scope of the action or command.
|
|
actionlog.limit=1024000 bytes
|
The maximum number of bytes in the log file.
When the approximate maximum byte number is reached, messages append or overwrite their log file.
If actionlog.append=TRUE, messages append to the current log file.
If actionlog.append=FALSE, messages overwrite previous messages in the current log file.
|
|
actionlog.append=TRUE
|
The current logs are action.trace.0, wsadmin.trace.0, and transfer.trace.0.
If actionlog.append=TRUE (the default), messages append to the current log file.
If actionlog.append=FALSE, each action or rafw command run overwrites messages in the current log file.
actionlog.append=TRUE | FALSE (You can use TRUE or FALSE).
|
Customizing logging properties for framework server trace logs
You can customize logging for framework server trace logs by changing the property settings. Framework server trace logs are in the RAFW_HOME/logs directory. The format for naming individual logs is framework.log.x (where x is a number 0 - 4). When the approximate maximum byte limit is reached, the content in framework.log.0 rolls to framework.log.1. The framework.log.0 log always contains the current message output.
Table 8-6 Customizable properties of framework server trace logs
|
Property and default settings
|
Description
|
|
java.util.logging.FileHandler.pattern=/logs/framework.log.x
|
The default location of the framework.log.x trace logs is in RAFW_HOME/logs.
The variable x represents the log number in the rolling log sequence. Messages are written to the current log file, framework.log.0
|
|
java.util.logging.FileHandler.limit=10240000 bytes
|
The approximate maximum number of bytes in a framework.log.x file.
|
|
java.util.logging.FileHandler.count=5
|
The number of logs (0 - 4) in the rotating log sequence. The most current message output is always written to framework.log.0.
|
|
java.util.logging.FileHandler.append=true
|
If FileHandler.append=true (the default), messages are appended to the current log file until it reaches the approximate maximum number of bytes that is specified in FileHandler.limit.
If FileHandler.append=false, messages overwrite previous messages in the current log file.
append=true | false (true or false)
|
Customizing logging for Jython classes
This section describes customizing logging properties for Jython classes. Several components or loggers control log levels for Jython classes as provided by the product.
To diagnose a problem in the Jython code, you can modify log level for all Jython classes. You can remove the comment from the jython.level component and change the log level.
Example 8-20 Log level
# Default global logging level.
.level=INFO
# You can override the global level for various components of the framework
jython.level=ALL
Example 8-21 Log level for ConfigReader
############################################################
# Facility specific properties.
# Provides extra control for each logger.
############################################################
# For example, set the com.xyz logger to only log SEVERE
# messages:
#com.xyz.level = SEVERE
ConfigReader.level=ALL
#TransferClient.level=ALL
#manageServer.level=INFO
#XmlProperty.level=INFO
#SystemUtils.level=INFO
#FileHelper.level=INFO
8.5 Image Construction and Composition Tool
This section describes various problems that are related to the Image Construction and Composition Tool.
8.5.1 Troubleshooting the Image Construction and Composition Tool
This section focuses on the following possible problems with the Image Construction and Composition Tool install and upgrade:
These problems are described next.
Install executable launcher error during installation
Sometimes upon installation, an installation executable launcher error occurs. Notice whether the Image Construction and Composition Tool fails with following error when the ./install file runs:
The Install executable launcher was unable to locate its companion shared library.
This error indicates that a version of the Image Construction and Composition Tool exists on the system. To resolve this problem, upgrade the most recent version or install new most recent version instead of installing the same version of the Image Construction and Composition Tool.
Install executable Error 1 during installation
During the installation of the Image Construction and Composition Tool on a system, you might receive the following error:
‘exec error 1’
The problem is caused when port 443 is used by another application. To resolve the problem, issue the following command to check the port status:
# netstat -na | grep 443
If status returns a response that it is in LISTEN mode, the port is in use. You must ensure that port 443 is not used by another application. You also must make any needed configuration changes to free the port.
ICYOIG0005E: Universal ID '<ID>_<version>' is not unique
The version of every asset and combination of universal ID must be unique. If you extend an image and do not enter a unique universal ID and version number combination for the newly extended virtual image, you receive an error. The following error message is found in the trace.log and error.log files:
Cannot create the image: Error: HTTP response code:409
message: "CYOIG0005E: Universal ID '<ID>_<version>' is not unique."
To resolve this issue, enter a unique universal ID and version combination for the extended asset.
Use the current file link, does not work correctly
When you receive this error, the Image Construction and Composition Tool did not revert to the previous file correctly. The error might occur when the Cancel - use the current file is used in the Files to Copy section on the Install or Config tab for a software bundle. The occurrence is specific to an attempt to cancel the process and use an edited file.
Consider the following scenario. You upload a file to the Files to Copy section on the Install or Config tab for a software bundle, save that file, and edit it. Then, after the file is saved and edited, you select a new file to upload. Next, you click Cancel - use the current file. The problem occurs because the file is still updated with the new file, although you tried to revert to the previous file. This issue does not always occur, but can occur on occasion.
To resolve this issue, you have the following options:
•Click Cancel if the file is not updated correctly.
•If you click OK, and see the wrong file, refresh the software bundle to omit all the changes.
VMware ESX Server error when virtual machines are used with snapshots
If you use virtual machines with snapshots in VMware ESX, you receive an error in the trace.log file. The VMware ESX cloud provider does not support virtual images where the virtual machine has snapshots.
The error message in the trace.log file is similar to the following output:
java.io.IOException: disk conversion of /drouter/ramdisk2/mnt/
raid-volume/raid0/templates/2/base-rhel55-64-000001-delta.vmdk
from monolithicFlat to streamOptimized failed!
From that output, the -delta.vmdk syntax indicates that there are snapshots in the virtual machine.
To resolve this issue, you have the following options:
•Do not use virtual machines that have snapshots.
•Remove the snapshots from your virtual machine before you use the virtual machine in the Image Construction and Composition Tool.
Failure during open virtualization appliance disk conversion
This error occurs when the conversion of disk files that are contained in the open virtualization appliance (OVA) files fails. When the disk files are converted, an error occurs in the OVA import-to-export operations.
To resolve this issue, verify that the following conditions are met:
•The free disk space that is available in the /drouter directory. The free disk space must be at least twice the size of the disk that is converted.
•If you are getting errors similar to "Bad ELF interpreter", verify the ld-linux shared library is available.
•In Red Hat Enterprise Linux V6.1, you must install the following packages:
– # yum install libz.so.1
– # yum install ld-linux.so.2
CYOES0033E: Unable to import image, another image exists with the name
Importing the same OVA image into multiple VMWare ESX server cloud providers causes a failure. The failure gives the following error message:
CYOES0033E: Unable to import image. Another image exists with the name:
CoC_RHEL62_64 and version: 1.0.6. If the image has already been
imported using another cloud provider, use the Import from
cloud provider option instead of the Import option.
To avoid this issue, verify that the image you want to use was not imported for this VMware ESX cloud provider. If the image was imported for a different VMware ESX cloud provider, you can still import the image into other VMware ESX cloud providers. To resolve the multi-import issue, instead of using the Import option, use the Import from cloud provider option.
Error occurs during open virtualization appliance (OVA) export
During OVA export operations, errors occur. You might see the following error message in the log files:
CYOCU0005
To resolve this issue, ensure that the user that is specified in the user interface has write permission for the specified target folder.
Open virtualization appliance deployment to VMware vSphere Client fails
This error can occur when an OVA template is deployed from VMware vSphere Client by using the File → Deploy OVF Template. If it occurs, the following error message is displayed:
This OVF package uses features that are not supported when deploying directly to an ESX host.
The OVF package requires support for "OVF Properties" and "Unsupported element Property"
OVA deployment directly to ESX or ESXi is not supported. To resolve this issue, you must use VMware vCenter Server (VirtualCenter) instead of VMware ESX/ESXi to deploy the OVA template. To verify the server type, use VMware vSphere Client to select the server in the left column. In the right pane above the Summary tab, check whether the server is a VMware ESX/ESXi server or a VMware vCenter Server.
If you do not have VMware vCenter Server (Virtual Center), you can install it in the license VMware vCenter Server and then deploy the OVA file to this VMware vCenter.
Virtual image capture fails
On occasion, the virtual image capture fails with the following error message:
Capture failed Failure to initiate capture. There are insufficient
resources to capture the image.
Check your private instance quota. Image cannot be saved.
To resolve this issue, use one of the following options:
•Enable the capture option again by expanding the virtual image capture error and clicking the option to try the capture again.
•Delete the failed virtual image and then re-create the virtual image and complete the capture process again.
Files are not replaced correctly (software bundle)
Sometimes the content of a software bundle file is not updated when a software bundle is added and replaced. Specifically, when a file is added to the Files to Copy section on the Install, Config, or Rest tab of a software bundle. After you add that file and then try to replace it, the content of the file is not updated but the name of the file is updated in the Image Construction and Composition Tool.
To resolve this issue, save the software bundle before you click the file to download the contents.
Unable to upload 2 GB or higher size file in the user interface
At times, when the user interface is used, the Image Construction and Composition Tool stops responding when you upload a 2 GB or higher size file.
To resolve this issue, upload the file by using the New file window. Uploads by using this window are asynchronous, while local uploads are synchronous. Complete the following steps to upload the 2-GB file:
1. In the New file window, select Remote and specify the URL for the file to be uploaded in the text box.
2. Verify that the file is uploading by checking the status indicator for the entry. The status locator is in the Files to Copy table.
3. Continue to refresh the software bundle definition until the upload is complete.
Limitation when concurrent updates are performed
The limitation is that you can use only a single mechanism of updating an object in Image Construction and Composition Tool. You can use the web interface in a single browser or the CLI.
Cannot remove software bundles from a personality
If a software bundle is added to a personality and then the virtual image is synchronized, the added software bundles cannot be removed from the personality.
To resolve this issue, delete the existing personality and create another personality where you add only the software bundles that you need.
Bundles are not displayed in the list of compatible images
Bundles are not displayed in the list of compatible images.
To resolve this issue, in the Add software bundles window, clear the check box for the Show only bundles compatible with the image option.
Limitation when bundles are added to a personality
For virtual images that have a single personality, all software bundles that are added to the image are automatically added to the personality. This behavior means that, in this case, the personality is identified with the image.
For virtual images that have multiple personalities, software bundles that are added to the image are not added automatically to any of the personalities in the image. For these images, you must explicitly add the software bundles to the personalities, as needed.
Complete the following steps to have specific control of bundles and personality association:
1. Extend the virtual image with the single personality.
2. Add software bundles, as required. Make sure these bundles are bundles that you want to be added to the personality because the bundles are added to the personality by default.
3. Add another personality to the image.
4. Add more bundles to the images. The bundles are not added to any personality by default because there is more than one personality.
5. If required, add the bundles to the appropriate personality.
Limitation when images that are synchronizing are deleted
Do not delete an image while it is synchronizing. Wait until the synchronization process completes and then delete it. If synchronization is active, it cannot delete the image. You might not able to delete image and it gives an error while the images are deleted.
Time lag when virtual images are deleted
If you delete a virtual image, it might take a while for the virtual image to be removed from view. There is a refresh issue that causes a deleted virtual image to remain in view until the deletion process completes. The deletion process can take a while to complete. After the deletion process completes, refresh your browser. The view should be correct.
|
Important: The final time that you refresh the resource and then select the virtual image, you receive an unable to load resource error message. This message arises because the virtual image was deleted. After this message, the view is refreshed.
|
SSL exception error
When the CLI of the Image Construction and Composition Tool is used in Linux, you might receive the SSL exception error socket.sslerror: (-1, 'SSL exception'). This error occurs if the Java Runtime Environment version that you are using is incompatible.
To verify your current Java Runtime Environment version, use the # java version command.
Complete the following steps to resolve the issue:
1. Use a different Java Runtime Environment, which can be downloaded from this website:
2. Install the new Java Runtime Environment version.
You can set the following environment variables to allow this new Java Runtime Environment to be used by the CLI instead of the existing Java Runtime Environment:
# export JAVA_HOME=/opt/IBM/icct/jre
# export PATH=$JAVA_HOME/bin:$PATH
Cannot pass characters for arguments on the command line
You might not be able to pass certain characters for arguments on the CLI. For example, when you are starting the CLI on Windows and passing arguments that contain an exclamation point (!), this character is removed from the argument during processing. This condition occurs because the CLIU is based on Python. In certain cases, specific characters are used to indicate special characteristics.
To resolve this issue, when you want to pass the exclamation point as a command-line argument, use the caret character (^) to escape the exclamation point character. Also, enclose the argument in double quotation marks. For example, instead of entering "password!", enter "password^!".
TCP/UDP firewall ports might appended incorrectly on a Red Hat system after synchronization
If a software bundle has firewall rules that are defined when the bundle is added to a Red Hat image through the VMware ESX cloud provider, the TCP/UDP firewall ports might be appended incorrectly after synchronization.
The TCP/UDP firewall ports might not be appended correctly on a Red Hat Linux system after synchronization.
Complete the following steps to resolve the problem:
1. Run the # service iptables save command.
2. Run the # service iptables stop command.
3. Browse to the # cd /etc/sysconfig directory.
4. Open the iptables file.
5. If the new firewall rules are appended after the reject rules, move the new firewall rules before the reject rules. If the new firewall rules use a UDP port instead of a TCP port, change tcp to udp for the new firewall rule.
6. Run the # service iptables start command.
8.5.2 Image Construction and Composition Tool log files
This section describes Image Construction and Composition Tool log files and the settings that are required to troubleshoot problems. The following issues are described in this section:
Accessing and downloading the logs
The Image Construction and Composition Tool server log files are accessed from the user interface. Click Welcome on the home page and then click Download logs. The logs are downloaded locally as compressed log files, as shown in Figure 8-22.
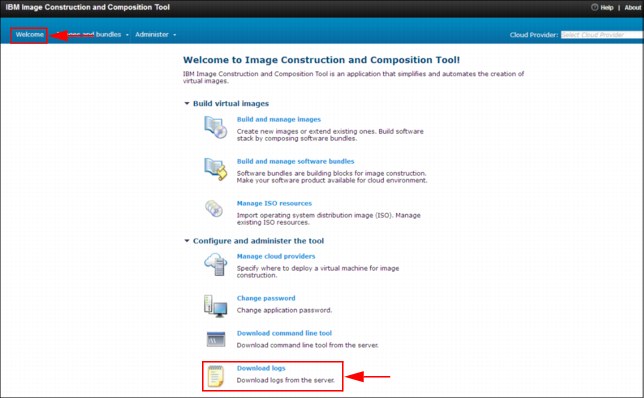
Figure 8-22 Image Construction and Composition Tool Server log download page
The downloaded compressed log file contains the following log files:
•Trace:
– Location of the trace file is /drouter/ramdisk2/mnt/raid-volume/raid0/logs
– The trace.log file is the most recent trace file.
– Default size of the trace.log file is 100 MB
– Nine levels of trace.log backup files
•Error:
– Location of the trace file is /drouter/ramdisk2/mnt/raid-volume/raid0/logs
– The error.log file is the most recent error file.
– Default size of the error.log file is 2 MB.
– Four levels of error.log backup files
Using log files to troubleshoot installation problems
During Image Construction and Composition Tool installation, if any problem occurs, you can see the following manager log files to troubleshoot the installation problems:
•# /var/ibm/InstallationManager/logs/<date_time>.xml
•#/var/ibm/InstallationManager/logs/ant/<date_time>.log
|
Important: The date_time format is YYYYMMDD_HHSS. For example, 20121206_1139.
|
|
Important: In the log files, the Image Construction and Composition Tool message codes start with CYO.
|
Synchronization log files
Log files can help you troubleshoot the problems that are related to virtual image synchronization. If synchronization fails before the deployed virtual machine, no log files are available. If synchronization failed during or after the bundle installation, see the following log files for use with troubleshooting:
•VM logs: error.log and trace.log
•Bundle installation logs: err.log and out.log
Configuring timeout settings
Timeout settings are used to indicate how long they can wait to come out from session. You can set the timeout settings parameters in a configuration file, which is in /opt/IBM/icon/icn.app/config. The following timeout settings can be changed:
•ShimTimeoutInMinutes=120
•WindowsCommandTimeOut=3
•BundleExeuctionTimeout=360
•restReadTimeout=90000
•"maxIWDDeployWaitTime=0
•IWD_SYSTEM_CREATION_ATTEMPTS=120
•IWD_WAIT_FOR_SYSTEM_CREATION_RETRY_DELAY=30
•IWD_WAIT_FOR_DEPLOY_STATUS_DELAY=10
•IWD_WAIT_FOR_STARTUP_COMPLETE_DEALY=30
•IWD_MAX_SYSTEM_ACTIVATION_WAIT_TIME=300
•IWD_MAX_CAPUTRUE_ATTEMPTS=180
•IWD_WAIT_FOR_CAPTURE_STATUS_DELAY=60
•SCE_MAX_CAPTURE_VM_ATTEMPTS=240
•SCE_WAIT_BETWEEN_CAPTURE_ATTEMPTS=30
•SCE_MAX_CONNECTION_ATTEMPTS=120
•SCE_WAIT_BETWEEN_CONNECTION_ATTEMPTS=10
•SCE_WAIT_COMMAND_RETRY_DEPLAY=60
•SCE_MAX_DELETE_VM_ATTEMPTS=30
•SCE_WAIT_DELETE_VM_DELAY=60
•SCE_WAIT_DEPROVISION_DELAY=30
Example 8-22 shows the content of the configuration file and the settings that are available for change.
Example 8-22 TimeOut settings configuration file
## Timeout settings Config File.
# Configurable timeouts
"ShimTimeoutInMinutes" : 120,
# Enable Single sign-on
"EnableSSO" : false,
# ICCT instance user
"InstanceUser": "",
# When executing windows commands how long do we wait before we timeout
# in minutes. This default value for this timeout is 3 minutes.
"WindowsCommandTimeOut": 3,
# When running the execution bundle during a synchronization,
# how long do we wait before timing out in minutes. Default
# values is 6 hours.
"BundleExeuctionTimeout": 360,
# IWD REST timeout
"restReadTimeout": 90000,
# IWD Max deploy wait time (minutes) Default value is 0 which
# disables the max Deploy time. If set by default we have put in
# 300 minutes (5 hours). If this is set it will work in conjunction
# with the following configuration parameters:
# IWD_SYSTEM_CREATION_ATTEMPTS
# IWD_WAIT_FOR_SYSTEM_CREATION_RETRY_DELAY
# IWD_WAIT_FOR_DEPLOY_STATUS_DELAY
# IWD_WAIT_FOR_STARTUP_COMPLETE_DEALY
# IWD_MAX_SYSTEM_ACTIVATION_WAIT_TIME
"maxIWDDeployWaitTime": 0,
# IWD Max number of creation attempts also the same
# number of attempts for deployment status checks.
"IWD_SYSTEM_CREATION_ATTEMPTS": 120,
# IWD delay between creation retries (seconds)
"IWD_WAIT_FOR_SYSTEM_CREATION_RETRY_DELAY": 30,
# IWD delay between checks for deployment status in (seconds)
"IWD_WAIT_FOR_DEPLOY_STATUS_DELAY": 10,
# IWD wait for startup complete (seconds)
"IWD_WAIT_FOR_STARTUP_COMPLETE_DEALY": 30,
# Amount of time to wait for the system to become active. This is checked
# after system creation and deploy status checks. Default value is 300
# minutes.
"IWD_MAX_SYSTEM_ACTIVATION_WAIT_TIME": 300,
# How many times to check to see if the capture of an image
# has completed before we fail the capture. The default
# value is 180 times.
"IWD_MAX_CAPUTRUE_ATTEMPTS": 180,
# When capturing an images in IWD. How long to wait before
# we check the status again in seconds. Default value is 60 seconds.
"IWD_WAIT_FOR_CAPTURE_STATUS_DELAY": 60,
# Maximum number of time to attempt to capture a VM.
# Default values is 240 times.
"SCE_MAX_CAPTURE_VM_ATTEMPTS" : 240,
# Time to wait between connection attempts in seconds.
# Default value is 30 seconds.
"SCE_WAIT_BETWEEN_CAPTURE_ATTEMPTS" : 30,
# Maximum number of time to try to connect to a VM.
# Default value is 120 times.
"SCE_MAX_CONNECTION_ATTEMPTS" : 120,
# Time to wait between connecting to the VM.
# Default value is 10 seconds.
"SCE_WAIT_BETWEEN_CONNECTION_ATTEMPTS" : 10,
# When running commands on the VM. Time to delay between checking the return
# code of the command to see if it is done or not. Default value is 60 seconds
"SCE_WAIT_COMMAND_RETRY_DEPLAY" : 60,
# Maximum number of time to try and delete a VM.
# Default value is 30 times.
"SCE_MAX_DELETE_VM_ATTEMPTS" : 30,
# Time to wait between checking to see if the VM is deleted.
# Default value is 60 seconds
"SCE_WAIT_DELETE_VM_DELAY" : 60,
# Time to wait after the VM's deletion state goes to deprovision.
# Default value is 30 seconds.
"SCE_WAIT_DEPROVISION_DELAY" : 30,
Configuring logging levels for troubleshooting
The trace and logs files are available to troubleshoot any problem and are required for many issues that arise. The content of these files and the logged information that is generated depends on definitions that follow the Java logging convention and WebSphere Application Server levels.
The following log level values are available for Java and WebSphere Application Server:
•OFF
•SEVERE
•WARNING
•INFO
•FINE
•FINER
•FINEST
•ALL
Manually modifying the Image Construction and Composition Tool file
Manually modifying the Image Construction and Composition Tool file helps you to set the logging levels in the configuration file to troubleshoot the problems. To update the file, access the /<ICCT install directory>/config/logging-default.config file. The changes that are made there take effect when you restart the Image Construction and Composition Tool. Complete the following steps to update the file:
1. Change to the directory <ICCT install_dir> by entering # cd /opt/IBM/icct in a command window.
2. Back up the file by entering the following syntax in a command window:
# cp -p ./icn.app/config/logging-default.config ./icn.app/config/logging-default.config_currectdateandtimestamp
3. Update the following file per your requirements:
# /opt/IBM/icct//icn.app/config/logging-default.config
4. Stop the Image Construction and Composition Tool by entering the following command:
# /opt/IBM/icct/stop.sh
5. Start the Image Construction and Composition Tool by entering the following command:
# /opt/IBM/icct/start.sh
The changes are now active in the system.
Virtual machine activation troubleshooting
When you are activating a virtual machine, problems can arise during deployment and synchronization during the activation of virtual image. Complete the following steps to delete the noap file and the contents of the AR directory:
1. Log in as root to the virtual machine by using the VMWare vSphere Client console.
2. Review the log files under the /opt/ibm/ae/AR directory for any errors.
3. Check whether a noap file exists in the /opt/ibm/ae/AP directory. If there is a noap file, complete the following steps:
a. Delete the noap file.
b. Remove all of the contents of the AR directory by entering the following syntax in a command window:
# cd /opt/ibm/ae/AR/
# rm -rf *.*
c. Reboot the system.
d. Check that the VM now activates successfully.
If the problem persists for virtual machine activation, complete the following steps:
1. In the user interface, press the ESC key.
2. The script that runs during activation is /opt/ibm/ae/AL/master.al. The scripts are in the /opt/ibm/ae/AS directory. Investigate the activation of each script and class to determine which line in each script is failing. After the failure is found, you must determine why the line in the script failed. For example, if ConfigLocale causes problems, run the following command once:
# AE.sh -s ConfigLocale
3. Enter df -m to make sure that the file activation.iso is mounted. The file usually is in the /tmp directory.
8.6 Virtual image synchronization problems
Virtual images sometimes fail during synchronization. This section describes how to determine the cause. The following information consider the problem and the possible solutions that are related to the process of virtual image synchronization.
8.6.1 ESX VMWare Server and Microsoft Windows related troubleshooting
This section describes several possible issues and resolutions. To help you determine the cause of failing virtual images during synchronization, review the following list of issues that are related to VMware ESX:
Virtual image synchronization failed when a trial version of VMware ESX was used
If you attempt to synchronize an image by using a trial version of VMware ESX, the synchronization fails when you attempt to copy the disk images to the VMware data store. When the image synchronization fails, the log contains messages that are similar to the syntax in Example 8-23 and Example 8-24. These logs can be found in the Image Construction and Composition Tool directory.
Example 8-23 Possible log message from a failed image synchronization
java.util.concurrent.ExecutionException: java.util.concurrent.ExecutionException:
com.ibm.venture.vm.VirtualizationShimException: Remote exception. No details available.
shim=https://localhost/sdk_copy26 endpoint=https://localhost/sdk_copy26
localizedMessage="Remote exception. No details available.”
causeType=org.apache.axis.AxisFault cause=(0)nullCauses
Example 8-24 Possible log message from a failed image synchronization
Caused by: (0)null
at org.apache.axis.transport.http.HTTPSender.readFromSocket(HTTPSender.java:744)
at org.apache.axis.transport.http.HTTPSender.invoke(HTTPSender.java:144)
To resolve this issue, use a licensed version of VMware ESX for your VMware ESX cloud provider.
Cannot synchronize Windows 2008 R2 image
If an image is extended from another image that is imported from a Windows 2008 R2 virtual machine that is running, the image synchronization might fail.
When the synchronization fails, the image status is virtual machine failed to start. If you open the VMware vCenter console, a window is shown that includes the following error:
autochk program not found - skipping AUTOCHECK
The Image Construction and Composition Tool then rolls back the changes. The deployed virtual machine becomes Orphaned as a part of the rollback. The error pane then closes.
This problem is resolved by updating the VMware ESX 4.1 Update 2, and VMware ESX 5.0 Update 1. For more information, see the following article in the VMware Knowledge Base: Cloned Windows 2008 R2 virtual machine fails to boot with the error: autochk program not found - skipping AUTOCHECK, which is available at this website:
http://kb.vmware.com/selfservice/microsites/search.do?cmd=displayKC&docType=kc&externalId=2004505&sliceId=1&docTypeID=DT_KB_1_1&dialogID=675956945&stateId=1%200%20675986017
Timeout with Linux bundle in Windows image on VMware cloud provider
When a VMWare cloud provider is used, the provider might timeout with no error when a Linux bundle is synchronized inside a Windows image. This issue occurs because the installation script that is used in a software bundle is not recognized by Windows as a known executable file. However, the installation process that is run during synchronization runs without stopping. The synchronization task fails after the timeout.
The issue can be resolved when the timeout expires after six hours and the synchronization fails. You now can remove the incorrect Linux bundle and add the correct bundle.
Windows image synchronization failed
Windows image synchronization to the virtual machine can fail in relation to the /etc/hosts file. This file is required by the RXA protocol. If the /etc/hosts file is incorrectly configured in the Image Construction and Composition Tool server configuration, a failure occurs.
To resolve this issue, the machine where the Image Construction and Composition Tool is installed must contain an entry with the Image Construction and Composition Tool server IP, the related host name, and fully qualified host name. For example, the entry should look similar to the following /etc/hosts file entry:
9.10.10.235 ipas101 ipas101.in.ibm.com
8.6.2 Common problem troubleshooting
This section describes several possible issues and resolutions to help you determine the cause for virtual images failing during synchronization. The focus of this section is not on a specific piece of equipment but on issues that are more generic. To help you determine the cause of your issue, review the following common problems:
Virtual image synchronization fails because the wrong key is specified
The virtual image synchronization process fails if it is configured with an incorrect private key file. When you are specifying your private key file and configuring IBM SmartCloud Enterprise as your cloud provider, you must specify a private key file with the .rsa extension. A common mistake is to specify a key file with the .ppk extension. If the wrong private key file is specified, the trace log file includes an error message similar to the following syntax:
Failed to connect to <IP_address>
To resolve this problem, ensure that you specify the private key file with the .rsa extension instead of .ppk and any other extension.
Virtual image synchronization fails because of the return code value
Virtual image synchronization fails if you use a script for the bundle installation that produces a return code value that is greater than 0 (zero). The Image Construction and Composition Tool checks the return value of the installation scripts used in bundles. A 0 return code indicates success and the synchronization process can proceed.
To resolve this issue, verify that the scripts that you are using to install the software return a 0 value to indicate successful installation. A value greater than 0 indicates a failure and your virtual image cannot be synchronized. The installation script checks for error conditions that are relevant to the installation of the bundle. For errors that might compromise the bundle installation, an exit code greater than 0 is returned, indicating failure. If a script returns no exit code explicitly, the exit code of the last command of the script is implicitly returned. Ensure that the bundle installation script can handle parameters that are passed in the following format:
scriptname -parameter1 <parameter1 value> -parameter2 <parameter2 value>
Example 8-25 Sample script for installing software in a bundle with return code 0
#!/bin/sh
## Licensed Materials - Property of IBM
# (C) Copyright IBM Corp. 2011
# All Rights Reserved
# US Government Users Restricted Rights -Use, duplication or
# disclosure restricted by GSA ADP Schedule Contract with IBM Corp.
## ----------------------------------------------------------------
## Description: Sample install script for an ICON bundle
function usage ()
{
echo ""
echo " Usage :"
echo " installBundleSample.sh -parm1 "parm1value" -parm2 "parm2value""
echo ""
exit 1
}
echo "$0: === Starting Install of Bundle Sample === "
echo
echo "$0: Arguments are: $* "
echo
#Init
MY_PARM1="Default parm1 value"
MY_PARM2="Default parm2 value"
echo "$0: Parsing Arguments "
echo
#Read arguments
while [ $# -ne 0 ]
do
case $1 in
-parm1*)
MY_PARM1=$2
;;
-parm2*)
MY_PARM2=$2
;;
*)
;;
esac
shift 1
done
# Now perform the work and actually do the install stuff - check the return code
echo "$0: About to do the real work..."
echo parm1 is "$MY_PARM1" parm2 is "$MY_PARM2"
if [ $? -gt 0 ]; then
echo "$0: echo $MY_PARM1 $MY_PARM2 failed" >&2
exit 1
fi
# finish up and return zero to indicate everything went ok (non-zero return code signifies an error)
echo " "
echo "$0: Done."
exit 0
Virtual image synchronization failed and bundles that were used for synchronization are removed
Sometimes when the synchronization fails, the bundles are removed. It is difficult to perform problem determination when the deployed image and the compressed package are removed. The difficulty is that you do not have access to the bundle installation scripts for troubleshooting.
To work around this issue, use the ICCT_DEBUG variable to troubleshoot the problem. Complete the following steps to enable the ICCT_DEBUG variable:
1. If the Image Construction and Composition Tool is started, use the following commands to stop the tool:
cd <install_dir>
./stop.sh
2. Define the ICCT_DEBUG variable by using the following command:
export ICCT_DEBUG=true
3. Restart the Image Construction and Composition Tool by using the following command:
./start.sh
Synchronization of the virtual image takes a long time
In this situation, you notice that the virtual image synchronization process takes a long time to complete, then it times out and fails. This condition occurs when cloud performance is poor. Cloud performance is not always consistent and can vary depending on usage and your connection. Depending on the cloud performance at any particular time, your virtual image synchronization can take longer to complete. The Image Construction and Composition Tool continues the synchronization process in case there are performance issues. If the synchronization process is slow and the performance is poor, the synchronization eventually times out. Then, you are notified that the synchronization failed because of performance issues.
To resolve this issue, after the virtual image synchronization process times out, you can retry the synchronization. If you retry and are still having synchronization issues, check the log files to determine the particular cloud provider issue that is affecting synchronization.
Virtual image synchronization fails after five hours for images
At times, the virtual image synchronization fails after five hours for images on the IBM PureApplication System and IBM SmartCloud Provisioning cloud provider. The synchronization can fail after five hours even if the image deployment is still running on IBM PureApplication System. This event happens because, by default, the Image Construction and Composition Tool waits up to five hours for the deployment of an image on IBM PureApplication System or IBM SmartCloud Provisioning. If the deployment does not complete within that time, the Image Construction and Composition Tool returns a failure.
To resolve this issue, make changes in the Image Construction and Composition Tool configuration file regarding the wait time. Complete the following steps to make these changes:
1. Open the <ICCT_INST_DIR>/icn.app/config/configuration.config file.
2. Edit the maxIWDDeployWaitTime parameter to increase the wait time. The default value is 300 minutes (5 hours).
3. If Image Construction and Composition Tool is started, stop it by using the following commands:
cd <install_dir>
./stop.sh
4. Start the Image Construction and Composition Tool to apply the changes by using the following command:
./start.sh
Synchronization failed for a virtual image that was imported from a running virtual machine
When you are importing a virtual image from a running virtual machine, the virtual image does not synchronize if Network Manager is running on the virtual machine. Network Manager must be disabled on the virtual machine.
To resolve this issue, you must disable Network Manager on the virtual machine and import the virtual image again. Complete the following steps to disable the Network Manager:
1. From the CLI, run the following command:
# service NetworkManager stop
2. Run the following command:
# chkconfig NetworkManager off
3. Open the /etc/sysconfig/network-scripts/ifcfg-eth0 file and verify that the interfaces are not controlled by Network Manager. Check the following parameter for this setting:
NM_controlled = no
Synchronization fails after a new password is added
When you extend and synchronize an image by using a PowerVM Express cloud provider, the synchronization fails after you add a new password in the synchronization dialog.
To resolve this issue, when you extend and synchronize the image, you must enter the root user password of the original image. Do not enter a new password during the synchronization.
By using the CLI, image synchronization does not work
If you attempt to use the CLI to synchronize an image with an IBM PureApplication System or IBM SmartCloud Provisioning cloud provider, the operation fails.
Complete the following steps to resolve this issue:
1. To get a list of all parameters, run the following command:
allCloudSyncParams = image.getSynchronizeParametersFromCloudProvider()
2. You receive an output from running the command in Step 1. The output is a list of parameters. Based on the retrieved list, build a new JSON object with a structure similar to the structure that is shown in Example 8-26.
Example 8-26 JSON object structure
myCloudSyncParams =
[
{'name':'profileList', 'type':'string', 'value':''},
{'name':'envprofile', 'type':'string', 'value':'10'},
{'name':'cloudgroup', 'type':'string', 'value':'12'},
{'name':'ipgroup', 'type':'string', 'value':'1013'},
{'name':'username', 'type':'string', 'value':'root'},
{'name':'password', 'type':'string', 'value':'passw0rd'}
]
This JSON object includes the following features:
– The profileList element has an empty value.
– You must add the user name and password elements to the JSON object. They are not returned by the getSynchronizeParametersFromCloudProvider() method.
3. To get a list of all parameters, run the following command:
myImgSyncParams = getSynchronizeParametersFromImage()
4. To synchronize the image, run the following command:
image.synchronize(myImgSyncParams, myCloudSyncParams, True)
..................Content has been hidden....................
You can't read the all page of ebook, please click here login for view all page.