Chapter 5. The Data Analytics Stack
By this point in the book, you are well versed in the key principles and methods of analytics, having learned them in Excel. This chapter serves as an interlude to the following parts of the book, where you’ll pivot that existing knowledge into using R and Python.
This chapter will further delineate the disciplines of statistics, data analytics, and data science, and we’ll take a deep dive into how Excel, R, and Python all play into what I call the data analytics stack.
Statistics Versus Data Analytics Versus Data Science
The focus of this book is helping you master principles of data analytics. But as you’ve seen, statistics is so core to analytics that it’s often hard to delineate where one field ends and the other begins. To compound the confusion, you may also be interested in how data science fits into the mix. Let’s take a moment to tighten these distinctions.
Statistics
Statistics is foremost concerned with the methods for collecting, analyzing, and presenting data. We’ve borrowed a lot from the field: for example, we made inferences about a population given a sample, and we depicted distributions and relationships in the data using charts like histograms and scatterplots.
Most of the tests and techniques we’ve used so far come from statistics, such as linear regression and the independent samples t-test. What distinguishes data analytics from statistics is not necessarily the means, but the ends.
Data Analytics
With data analytics, we are less concerned about the methods of analyzing data, and more about using the outcomes to meet some external objective. These can be different: for example, you’ve seen that while some relationships can be statistically significant, they might not be substantively meaningful for the business.
Data analytics is also concerned with the technology needed to implement these insights. For example, we may need to clean datasets, design dashboards, and disseminate these assets quickly and efficiently. While the focus of this book has been on the statistical foundations of analytics, there are other computational and technological foundations to be aware of, which will be discussed later in this chapter.
Business Analytics
In particular, data analytics is used to guide and meet business objectives and assist business stakeholders; analytics professionals often have one foot in the business operations world and another in the information technology one. The term business analytics is often used to describe this combination of duties.
An example of a data or business analytics project might be to analyze movie rental data. Based on exploratory data analysis, the analyst may hypothesize that comedies sell particularly well on holiday weekends. Working with product managers or other business stakeholders, they may run small experiments to collect and further test this hypothesis. Elements of this workflow should sound familiar from earlier chapters of this book.
Data Science
Finally, there is data science: another field that has inseparable ties to statistics, but that is focused on unique outcomes.
Data scientists also commonly approach their work with business objectives in mind, but its scope is quite different from data analytics. Going back to our movie rental example, a data scientist might build an algorithmically powered system to recommend movies to individuals based on what customers similar to them rented. Building and deploying such a system requires considerable engineering skills. While it’s unfair to say that data scientists don’t have real ties to the business, they are often more aligned with engineering or information technology than their data analytics counterparts.
Machine Learning
To summarize this distinction, we can say that while data analytics is concerned with describing and explaining data relationships, data science is concerned with building predictive systems and products, often using machine learning techniques.
Machine learning is the practice of building algorithms that improve with more data without being explicitly programmed to do so. For example, a bank might deploy machine learning to detect whether a customer will default on a loan. As more data is fed in, the algorithm may find patterns and relationships in the data and use them to better predict the likelihood of a default. Machine learning models can offer incredible predictive accuracy and can be used in a variety of scenarios. That said, it’s tempting to build a complex machine learning algorithm when a simple one will suffice, and this can lead to difficulty with interpreting and relying on the model.
Machine learning is beyond the scope of this book; for a fantastic overview, check out Aurélien Géron’s Hands-On Machine Learning with Scikit-Learn, Keras, and TensorFlow, 2nd edition (O’Reilly). That book is conducted heavily in Python, so it’s best to have completed Part III of this one first.
Distinct, but Not Exclusive
While distinctions among statistics, data analytics, and data science are meaningful, we shouldn’t let them create unnecessary borders. In any of these disciplines, the difference between a categorical and continuous dependent variable is meaningful. All use hypothesis testing to frame problems. We have statistics to thank for this common parlance of working with data.
Data analytics and data science roles are often intermingled as well. In fact, you’ve learned the basics of a core data science technique in this book: linear regression. In short, there is more that unites these fields than divides them. Though this book is focused on data analytics, you are prepared to explore them all; this will be especially so once you’ve learned R and Python.
Now that we’ve contextualized data analytics with statistics and data science, let’s do the same for Excel, R, Python, and other tools you may learn in analytics.
The Importance of the Data Analytics Stack
Before technical know-how of any single tool, an analytics professional should have the ability to choose and pair different tools given the strengths and weaknesses of each.
It’s common for web developers or database administrators to refer to their “stack” of tools used to do the job. We can use the same idea to helpful effect in data analytics. When one tool or “slice” of the stack comes up short, the focus ought not to be on blaming it for shortcomings, but on choosing a different slice or slices. That is, we ought to think of these different slices as complements rather than substitutes.
Figure 5-1 is my conceptualization of the four slices of the analytics stack. This is a vast oversimplification of what data tools are used in organizations; mapping out end-to-end analytics pipelines can get complicated. The slices are arranged in order from where data is stored and maintained by information technology departments (databases) to where it is used and explored by business end users (spreadsheets). Any of these slices can be used together to craft solutions.
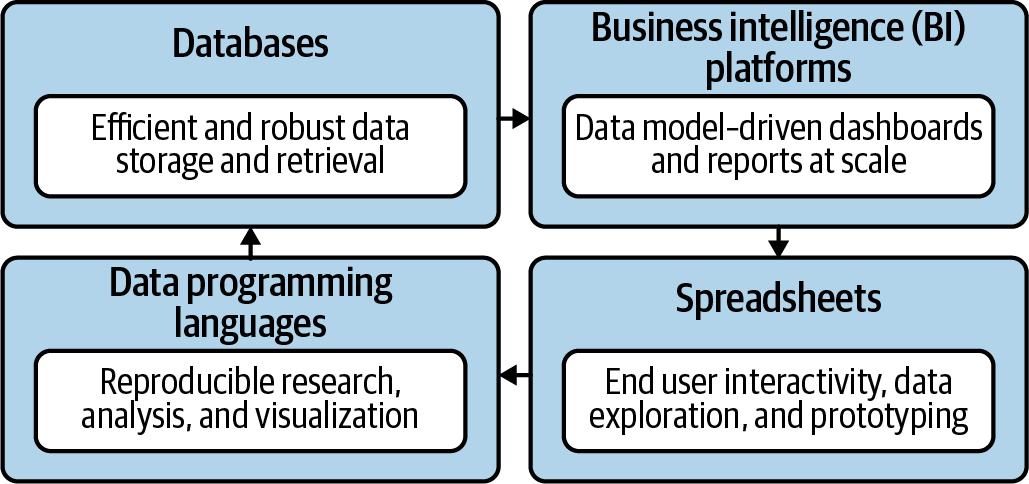
Figure 5-1. The data analytics stack
Let’s take some time to explore each slice of the stack. I’ll cover these slices from what I assume is the most familiar to the least familiar for the typical reader.
Spreadsheets
I won’t spend too much time on what spreadsheets are and how they work; you’re pretty accustomed to them by now. These principles apply to other spreadsheet applications like Google Sheets, LibreOffice, and more; we’ve been focused on Excel in this book, so I’ll emphasize it here. You’ve seen that the spreadsheet can bring analytics to life and is a great tool for EDA. This ease of use and flexibility makes spreadsheets ideal for distributing data to end users.
But this flexibility can be both a virtue and a vice. Have you ever built a spreadsheet model where you landed at some number, only to reopen the file a few hours later and inexplicably get a different number? Sometimes it can feel like playing whack-a-mole with spreadsheets; it’s very hard to isolate one layer of the analysis without affecting the others.
A well-designed data product looks something like what’s shown in Figure 5-2:
-
The raw data is distinct and untouched by the analysis.
-
The data is then processed for any relevant cleanup and analysis.
-
Any resulting charts or tables are isolated output.
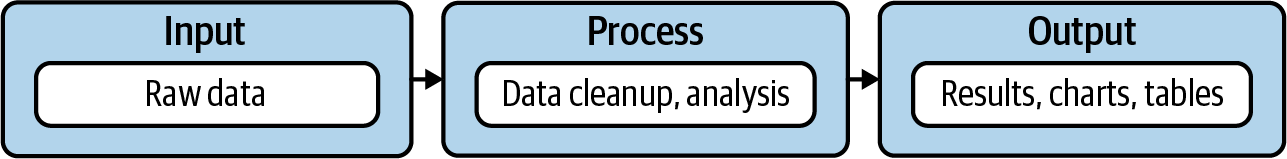
Figure 5-2. Input, process, output
Although there are principles to follow with this approach in spreadsheets, these layers tend to become a messy soup: users may write directly over raw data, or build calculations atop calculations to the point where it becomes very difficult to track all the references pointing to a given cell. Even with a solid workbook design in place, it can still be hard to achieve the ultimate goal of an input-process-output model, which is reproducibility. The idea here is that, given the same input and processes, the same output will be achieved time and again. Clearly, a workbook isn’t reproducible when, due to error-prone steps, clunky calculations, or more, it’s not guaranteed you’ll arrive at the same outcome each time you open the file.
Messy or nonreproducible workbooks have spawned horror stories in every field from food service to finance regulation: for a frightening overview, check out this article from the European Spreadsheet Risks Interest Group. Maybe the analysis you do isn’t as high-stakes as trading bonds or publishing groundbreaking academic research. But nobody likes slow, error-prone processes that produce unreliable results. But enough doom-mongering; as I hope to continuously emphasize, Excel and other spreadsheets have their rightful place in analytics. Let’s take a look at some tools that help build clean, reproducible workflows in Excel.
VBA
You will see that in general, reproducibility is achieved in computing by recording each step of the analysis as code, which can be saved and quickly re-executed later. Excel does indeed have an in-house programming language in Visual Basic for Applications (VBA).
Although VBA does allow for a process to be recorded as code, it lacks many of the features of a full-on statistical programming language: in particular, the abundance of free packages for specialized analysis. Moreover, Microsoft has all but sunset VBA, moving resources to its new Office Scripts language as a built-in Excel automation tool, as well as JavaScript and, if rumors are to be believed, Python.
Modern Excel
I’ll use this term for the series of tools centered on business intelligence (BI) that Microsoft began releasing to Excel in Excel 2010. These tools are incredibly powerful and fun to use, and they bust many of the myths about what Excel can and can’t do. Let’s take a look at the three applications that make up Modern Excel:
-
Power Query is a tool for extracting data from various sources, transforming it, and then loading it into Excel. These data sources can range from .csv files to relational databases and can contain many millions of records: while it still may be true that an Excel workbook itself can only contain about a million rows, it can contain several times that limit if read via Power Query.
What’s even better, Power Query is fully reproducible on account of Microsoft’s M programming language. Users can add and edit steps via a menu, which generates the M code, or write it themselves. Power Query is a showstopping force for Excel; not only does it blow away previous constraints on how much data can flow through a workbook, it makes the retrieval and manipulation of this data fully reproducible.
-
Power Pivot is a relational data modeling tool for Excel. We’ll discuss relational data models in more depth later in this chapter when we review databases.
-
Finally, Power View is a tool for creating interactive charts and visualizations in Excel. This is especially helpful for building dashboards.
I highly suggest you take some time to learn about Modern Excel, particularly if you are in a role that relies highly on it for analysis and reporting. Many of the naysaying claims about Excel, such as that it can’t handle more than a million rows, or work with diverse data sources, are no longer true with these releases.
That said, these tools aren’t necessarily built to conduct statistical analysis, but to aid in other analytics roles, such as building reports and disseminating data. Fortunately, there is ample room to mix Power Query and Power Pivot with tools like R and Python to build exceptional data products.
Despite this evolution and its many benefits, Excel is frowned upon by many in the analytics world because of the misfortunes its overuse can lead to. This leads us to ask: why is Excel overused in the first place? It’s because business users, for lack of better alternatives and resources, see it as an intuitive, flexible place for storing and analyzing data.
I say, if you can’t beat ‘em, join ‘em: Excel is a great tool for exploring and interacting with data. It’s even, with its latest features, become a great tool for building reproducible data-cleaning workflows and relational data models. But there are some analytics functions that Excel is not so great for, such as storing mission-critical data, distributing dashboards and reports across multiple platforms, and performing advanced statistical analysis. For those, let’s look at the alternatives.
Databases
Databases, specifically relational databases, are a relatively ancient technology in the world of analytics, with their origins tracing to the early 1970s. The building block of relational databases is something you’ve seen before: the table. Figure 5-3 is such an example: we’ve been referring to columns and rows of such a table with the statistical terms of variables and observations. Their counterparts in the language of databases are fields and records.
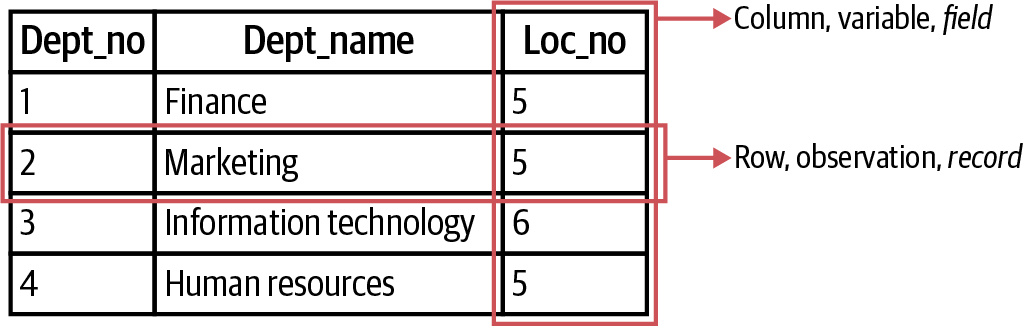
Figure 5-3. A labeled database table
If you were asked to connect data from Figure 5-4 together, you may use Excel’s VLOOKUP() function, using shared columns as “lookup fields” to transfer data from one table to another. There’s a lot more to it, but this is the crux of relational data models: to use relations between data across tables to store and manage data efficiently. I like to call VLOOKUP() the duct tape of Excel because of its ability to connect datasets together. If VLOOKUP() is duct tape, then relational data models are welders.
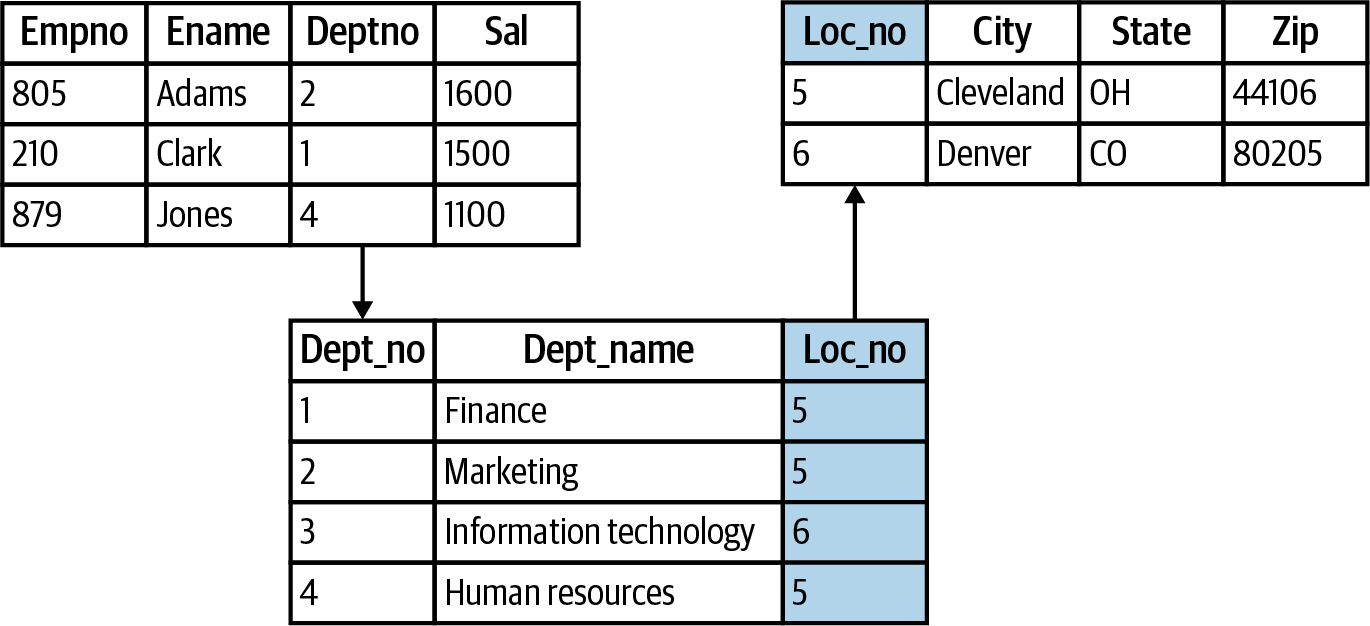
Figure 5-4. Relationships among fields and tables in a relational database
A relational database management system (RDBMS) is designed to exploit this basic concept for large-scale data storage and retrieval. When you place an order at a store or sign up for a mailing list, that data likely passes through an RDBMS. While built on the same concepts, Power Pivot’s use case is more for BI analysis and reporting and is not a full-service RDMBS.
Structured Query Language, or SQL, is traditionally used to interact with databases. This is another crucial topic in analytics that is outside our book’s scope; for a great introduction, check out Alan Beaulieu’s Learning SQL, 3rd edition (O’Reilly). Keep in mind that while “SQL” (or “sequel”) as a language name is often used generically, several “dialects” exist depending on the RDBMS of interest. Some of these systems, like Microsoft or Oracle, are proprietary; others, like PostgreSQL or SQLite, are open source.
A classic acronym for the operations SQL can perform is CRUD, or Create, Read, Update, Delete. As a data analyst, you’ll most typically be involved with reading data from a database rather than changing it. For these operations, the difference in SQL dialects will be negligible across various platforms.
Business Intelligence Platforms
This is an admittedly broad swath of tools and likely the most ambiguous slice of the stack. Here I mean enterprise tools that allow users to gather, model, and display data. Data warehousing tools like MicroStrategy and SAP BusinessObjects straddle the line here, since they are tools designed for self-service data gathering and analysis. But these often have limited visualization and interactive dashboard-building included.
That’s where tools like Power BI, Tableau, and Looker come in. These platforms, nearly all proprietary, allow users to build data models, dashboards, and reports with minimal coding. Importantly, they make it easy to disseminate and update information across an organization; these assets are often even deployed to tablets and smartphones in a variety of formats. Many organizations have moved their routine reporting and dashboard creation from spreadsheets into these BI tools.
For all their benefits, BI platforms tend to be inflexible in the way they handle and visualize data. With the objective to be straightforward for business users and difficult to break, they often lack the features that seasoned data analysts need to do the necessary “hacking” for the task at hand. They can also be expensive, with single-user annual licenses running several hundred or even thousands of dollars.
Given what you’ve learned about Excel, it’s worth pointing out that the elements of Modern Excel (Power Query, Power Pivot, Power View) are also available for Power BI. What’s more, it’s possible to build visualizations in Power BI using R and Python code. Other BI systems have similar capabilities; I’ve been focusing on Power BI here due to our earlier focus on Excel.
Data Programming Languages
That brings us to our final slice: data programming languages. By this I mean wholly scripted software applications used specifically for data analytics. Many analytics professionals do phenomenal work without this slice in their stack. Moreover, many vendor tools are moving toward low- or no-code solutions for sophisticated analytics.
All that said, I strongly encourage you to learn how to code. It will sharpen your understanding of how data processing works, and give you fuller control of your workflow than relying on a graphical user interface (GUI), or point-and-click software.
For data analytics, two open source programming languages are good fits: R and Python, hence the focus of the rest of this book. Each includes a dizzying universe of free packages made to help with everything from social media automation to geospatial analysis. Learning these languages opens the door to advanced analytics and data science. If you thought Excel was a powerful way to explore and analyze data, wait until you get the hang of R and Python.
On top of that, these tools are ideal for reproducible research. Think back to Figure 5-2 and the difficulties we spotted in separating these steps in Excel. As programming languages, R and Python record all steps taken in an analysis. This workflow leaves the raw data intact by first reading from external sources, then operating on a copy of that data. The workflow also makes it easier to track changes and contributions to files by a process known as version control, which will be discussed in Chapter 14.
R and Python are open source software applications, which means that their source code is freely available for anyone to build on, distribute, or contribute to. This is quite different from Excel, which is a proprietary offering. Both open source and proprietary systems have their advantages and disadvantages. In the case of R and Python, allowing anyone to develop freely on the source code has led to a rich ecosystem of packages and applications. It’s also lowered the barrier to entry for newcomers to get involved.
All that said, it’s common to find that critical parts of open source infrastructure are maintained by developers in their spare time without any compensation. It may not be ideal to rely on continued development and maintenance of an infrastructure that is not commercially guaranteed. There are ways to mitigate this risk; in fact, many companies exist solely to support, maintain, and augment open source systems. You will see this relationship at work in our later discussions on R and Python; it may surprise you that it’s entirely possible to make money by providing services based on freely available code.
The “data programming language” slice of the stack likely has the steepest learning curve of them all: after all, it’s literally learning a new language. Learning one such language may sound like a stretch, so how and why on earth will you be learning two?
First of all, as we mentioned at the beginning of the book, you’re not starting at zero. You have strong knowledge of how to program and how to work with data. So take it in stride that you have learned how to code…sort of.
Tip
There’s a benefit to being multilingual with data programming languages, just as there is with spoken languages. At a pragmatic level, employers may use either of them, so it’s smart to cover your bases. But you’re not just ticking a box by learning both: each language has its own unique features, and you may find it easier to use one for a given use case. Just as it’s smart to think about different slices of the stack as complements and not subsitutes, the same attitude holds for tools in the same slice.
Conclusion
Data analysts often wonder which tools they should focus on learning or becoming the expert in. I would suggest not becoming the expert in any single tool, but in learning different tools from each slice of the stack well enough to contextualize and choose between them. Seen from this perspective, it makes little sense to claim one slice of the stack as inferior to another. They are meant to be complementary, not substitutes.
In fact, many of the most powerful analytics products come from combining slices of the stack. For example, you might use Python to automate the production of Excel-based reports, or pull data from an RDBMS into a BI platform’s dashboard. Although these use cases are beyond the scope of this book, the upshot for our discussion is: don’t ignore Excel. It’s a valued slice of the stack that is only complemented by your skills in R and Python.
In this book, we focus on spreadsheets (Excel) and data programming languages (R and Python). These tools are particularly suited for the statistically based roles of data analytics, which as we’ve discussed have some overlap with traditional statistics and with data science. But as we’ve also discussed, analytics involves more than pure statistical analysis, and relational databases and BI tools can be helpful for these duties. Once you’ve familiarized yourself with the topics in this book, consider rounding out your knowledge of the data analytics stack with the titles I suggested earlier in this chapter.
What’s Next
With this big-picture overview of data analytics and data analytics applications in mind, let’s dive into exploring new tools.
We’ll start with R because I consider it a more natural jumping-off point into data programming for Excel users. You’ll learn how to conduct much of the same EDA and hypothesis testing with R that you did with Excel, which will put you in a great position for more advanced analytics. Then you’ll do the same with Python. At each point along the way, I’ll help relate what you’re learning to what you already know, so that you see how familiar so many of the concepts actually are. See you in Chapter 6.
Exercises
This chapter is more conceptual than applied, so there are no exercises. I encourage you to come back to it as you branch out into other areas of analytics and relate them to each other. When you encounter a new data tool at work or while perusing social media or industry publications, ask yourself which slices of the stack it covers, whether it’s open source, and so forth.