
Chapter 2
Aerosol Dynamics
2.1 Introduction
Airborne particulate matter (PM) contains various chemical components and ranges in size from few nanometres to several hundred micrometres (Hinds, 1999). It is apparent that PM is not a single pollutant, and its mass includes a mixture of numerous pollutants distributed differently at different sizes. Particle size is an essential parameter that determines the chemical composition, optical properties, deposition of particles and inhalation in the human respiratory tract (RT) (Hinds, 1999; Friedlander, 2000; Seinfeld and Pandis, 2006; Lazaridis, 2011). Particle size is specified by the particle diameter, ![]() , which is most commonly expressed in micrometres. Particles represent a very small fraction, less than 0.0001%, of the total aerosol mass or volume (Drossinos and Housiadas, 2006). The gas phase mainly influences the particle flow through hydrodynamic forces.
, which is most commonly expressed in micrometres. Particles represent a very small fraction, less than 0.0001%, of the total aerosol mass or volume (Drossinos and Housiadas, 2006). The gas phase mainly influences the particle flow through hydrodynamic forces.
Particles may be classified into a number of categories; based on their size, they can be categorized according to (i) their observed modal distribution, (ii) the 50% cut-off diameter of the measurement instrument or (iii) dosimetric variables that are related to human exposure to atmospheric concentrations. However, these categories are not rigorously defined and they are usually application-specific.
In category (i), several subcategories can be identified:
- Nucleation mode: Particles with diameter < 0.1 µm, which are formed by nucleation processes. The lower size limit of this category is not very well defined, but it is close to 3 nm.
- Aitken mode: Particles with diameter 0.01 µm <
 < 100 nm. They originate from vapour nucleation or the growth of preexisting particles as a result of condensation.
 - Accumulation mode: Particles with diameter 0.1 µm <
 < 1 up to 3 µm. The upper limit coincides with a relative minimum of the total particle volume distribution. Particles in this mode are formed either by coagulation of smaller particles or by condensation of vapour constituents. The number of particles in this category does not increase with condensational growth. Furthermore, the removal mechanisms of particles in this category are very slow and as a result there is an accumulation of particles.
 - Ultrafine particles: Particles in the Aitken and nucleation modes.
- Fine fraction:
 .
. - Coarse fraction:
 .
.
Particles in the atmosphere have a distribution of sizes; lognormal distributions are commonly used to describe these distributions (Hinds, 1999; Lazaridis, 2011). Figure 2.1 presents typical atmospheric aerosol distributions by number, surface area and volume (for spherical particles).
Figure 2.1 Typical ambient aerosol distributions by (a) number (b) surface area (c) volume. Reproduced with permission from Colbeck and Lazaridis (2010). Copyright © 2010, Springer Science and Business Media.
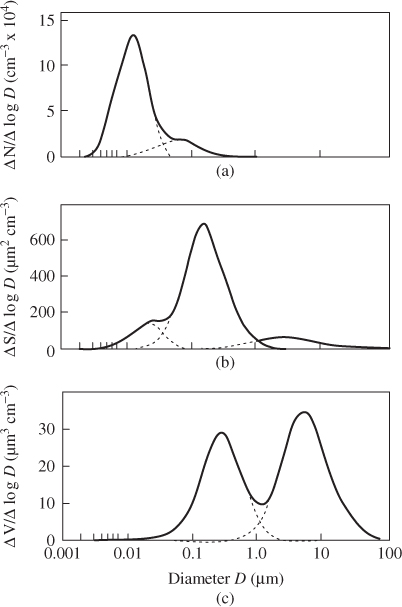
A logarithmic normal distribution is used to represent the distribution of particle mass/number/surface area (Hinds, 1999).
The frequency function of a unimodal logarithmic normal distribution can be expressed as:
2.1 
and that of a bimodal as:
2.2 
where α is the fraction of fine particles, (1 − α) the fraction of coarse particles and dg the mean geometric diameter. The coefficients F and C refer to fine and coarse particles, respectively. The geometric standard deviation ![]() of the distribution given by:
of the distribution given by:
2.3 
where N is the total number of particles and dg the geometric mean diameter is given by:
2.4 ![]()
There are different distributions that characterize specific particle properties, such as their number, surface area, volume and mass. The number distribution describes the particle number at different sizes, whereas the mass distribution describes the particle mass at different particle sizes. The distributions, if taken to unimodal lognormals, are characterised by a geometric mean diameter and geometric standard deviation.
This chapter presents a general overview of the dynamics of atmospheric aerosols, including the aerosol general dynamic equation (GDE), and of relevant physical processes such as agglomeration, coagulation, gas-to-particle conversion, deposition and resuspension.
2.2 General Dynamic Equation
The variation in space and time of the particle size distribution is described by the GDE, a population-balance equation. The particle size distribution within a fixed-volume element is influenced by processes within the volume (internal processes) and processes that transport particles across the volume boundaries (external processes) (Friedlander, 2000). Internal processes include coagulation, agglomeration, fragmentation and gas-to-particle conversion. External processes include transport across boundaries due to gas flow, particle diffusion, particle motion induced by concentration or temperature gradients and sedimentation (Drossinos and Housiadas, 2006). The GDE is a nonlinear, integrodifferential equation subject to different initial and boundary conditions.
2.2.1 Discrete Particle Size Distribution
Smoluchowski (1916) derived the first equation describing the effect of particle coagulation on the discrete particle size distribution resulting from Brownian motion and motion induced by a laminar shear. The equation refers to internal processes. For a discrete particle size distribution, as a result of coagulation between particles, particles are both removed from and added to size bins. If two particles of masses ![]() and
and ![]() collide and subsequently coagulate, the mass of the particle formed is
collide and subsequently coagulate, the mass of the particle formed is ![]() . If
. If ![]() is the coagulation rate between particles of masses
is the coagulation rate between particles of masses ![]() and
and ![]() then
then ![]() ,
, ![]() and
and ![]() . There is a net loss of one particle per coagulation event, but the total mass is conserved. Generalising these equations we obtain:
. There is a net loss of one particle per coagulation event, but the total mass is conserved. Generalising these equations we obtain:
where i + j = k means that the summation is taken over those size grid points for which ![]() . The factor ½ avoids over-counting. Here mk includes all particles in size bin k. The first term on the right-hand side (RHS) of Equation 2.5 represents the gain in bin k due to coagulation between smaller particles, whereas the second term represents the loss of particles from size bin k due to coagulation with particles in all size bins (including coagulation events between two particles both of which are in bin k). The theory of particle coagulation is reviewed extensively in Fuchs (1964), Friedlander (2000), Williams and Loyalka (1991) and Seinfeld and Pandis (2006).
. The factor ½ avoids over-counting. Here mk includes all particles in size bin k. The first term on the right-hand side (RHS) of Equation 2.5 represents the gain in bin k due to coagulation between smaller particles, whereas the second term represents the loss of particles from size bin k due to coagulation with particles in all size bins (including coagulation events between two particles both of which are in bin k). The theory of particle coagulation is reviewed extensively in Fuchs (1964), Friedlander (2000), Williams and Loyalka (1991) and Seinfeld and Pandis (2006).
If the collision frequency function K(mi, mj) is constant and independent of particle size, and denoted by K, the equation for the discrete size distribution can be solved analytically to get (Drossinos and Housiadas, 2006):
where ![]() is the initial total number of particles per unit volume and τ is the characteristic agglomeration time scale (
is the initial total number of particles per unit volume and τ is the characteristic agglomeration time scale (![]() ). For Brownian coagulation of identical particles of diameter
). For Brownian coagulation of identical particles of diameter ![]() and diffusion coefficient
and diffusion coefficient ![]() , in a fluid of dynamic viscosity
, in a fluid of dynamic viscosity ![]() at absolute temperature T, the (constant) collision frequency evaluates to:
at absolute temperature T, the (constant) collision frequency evaluates to:
![]()
A generalisation of the Smoluchowski equation includes other internal processes. Accounting for condensation and evaporation, the time-dependent equation for the discrete size distribution becomes (Friedlander, 2000):
The last two terms on the RHS model condensation and evaporation. The term ακ is the evaporative flux and sk is the effective surface area of evaporation of a k-mer. It is assumed that evaporation occurs via the loss of single molecules.
2.2.2 Continuous Particle Size Distribution
The continuous distribution is introduced for particle volumes much larger than the molecular volume. In this case, the discrete distribution nk(t) can be replaced by the continuous distribution n(υ; r,t). The variable r refers to the location of the distribution in space and υ to the particle volume. The variation of n(υ; r,t) with time can be expressed as (Friedlander, 2000):
where vp is the average particle velocity. The first term on the RHS corresponds to gas-to-particle conversion and the second to particle coagulation. For transport mechanisms that can be considered to act independently (a reasonable assumption for aerosol particles) and for particles of negligible inertia, the average particle velocity becomes:
![]()
where u is the fluid velocity and ![]() the sum of all other transport velocities; for example, thermophoretic, electrostatic, gravitational and so on.
the sum of all other transport velocities; for example, thermophoretic, electrostatic, gravitational and so on.
Two main methods have been elaborated to model aerosol dynamics using a detailed aerosol size distribution: the sectional method and the moment method. The numerical techniques usually do not take into account spatial inhomogeneities and assume that the aerosol is spatially well mixed. Therefore, the numerical methods apply equally well to Equation 2.7 and to its continuous generalisation Equation 2.8. The main objective is to solve the aerosol GDE using a comprehensive method to treat the complexity of the aerosol size distribution dynamics (Seinfeld and Pandis, 2006). However, since the inclusion of detailed aerosol dynamic models in mesoscale or regional modelling is a difficult and computationally intensive task, various simplifications have been introduced through the omission of specific terms of the GDE.
In the sectional method, the size distribution is divided into several size bins (sections), logarithmically spaced. A common assumption is that all the particles in each section have the same chemical composition (internally mixed assumption).
In the moment method, the moments of the aerosol size distribution are expressed in terms of the distribution parameters. The most important moments of the aerosol size distribution refer to the determination of the total number concentration, the geometric mean diameter and the average surface area and volume per particle (Friedlander, 2000).
2.3 Nucleation: New Particle Formation
Nucleation is the initial stage of a first-order phase transition that takes place in various energetically metastable or unstable systems (Debenedetti, 1996). Homogeneous nucleation refers to new particle formation in the absence of preexisting particles. It has several applications in fields ranging from atmospheric science to nanoparticle formation in engine emissions, or combustion processes in general.
In the atmosphere, where various condensable vapours exist in low concentrations, binary (two-component) or multicomponent nucleation is the predominant particle formation mechanism (Seinfeld and Pandis, 2006; Lazaridis, 2011). Even though homogeneous nucleation is not an important mechanism for the determination of the aerosol mass size distribution, it provides a source of numerous newly formed particles that shape the number size distribution.
2.3.1 Classical Nucleation Theory
The classical nucleation theory (CNT) was developed by Becker and Döring (1935) and Zeldovich (1942) for isothermal nucleation. It is based on the phenomenological concept of a droplet that is viewed as a group of molecules which interact strongly among themselves and weakly with the rest of the system. According to the classical theory, the nucleating cluster is treated with equilibrium thermodynamics as a macroscopic droplet whose free energy of formation depends crucially on the bulk surface tension. The nucleation rate depends exponentially on the reversible work of cluster formation, since nucleation is an activated process.
The kinetics by which small clusters of the new phase gain or lose molecules is based on ideas developed in chemical kinetics. It is assumed that clusters grow or shrink via the gain or loss of single molecules, an approximation that is reasonable for the condensation at low pressures of nonassociated vapours. However, the classical theory, being a phenomenological approach, lacks a sound microscopic foundation.
Homogeneous unary (single-component) nucleation occurs in a supersaturated vapour. The saturation ratio of a chemical species A in air at temperature T is defined as:
2.9 ![]()
where pA is the partial pressure of the condensable gaseous species A and ![]() is the saturation pressure of A, which is in equilibrium with the liquid phase at temperature T (over a planar vapour–liquid interface).
is the saturation pressure of A, which is in equilibrium with the liquid phase at temperature T (over a planar vapour–liquid interface).
The theory of nucleation is based on the solution of a system of equations that describes the concentration variation of clusters with the addition or subtraction of molecules (Debenedetti, 1996). It is assumed that clusters impact with air molecules at a rate that is equilibrated thermally at time periods that are small compared with that necessary for the addition or subtraction of a molecule. This denotes that the clusters have the same temperature as their environment. In the atmosphere, homogeneous nucleation occurs mainly with the participation of two or more chemical compounds.
The kinetic method of the nucleation theory assumes that clusters increase or decrease in size with the addition or removal of one molecule for nonassociated vapours. Therefore, if Ni(t) is the nonequilibrium number concentration of i-molecule clusters, the following equations describe the variation of the cluster concentration:
where βi is the forward (condensation) molecular flux per unit time and area at which an i-cluster gains a molecule and ![]() is the backward (evaporation) flux at which the cluster loses a molecule. (Equation 2.10 is a specific case of the GDE for single-molecule coagulation/fragmentation in the absence of other processes (see Equation 2.7) and constant single-molecule concentration.)
is the backward (evaporation) flux at which the cluster loses a molecule. (Equation 2.10 is a specific case of the GDE for single-molecule coagulation/fragmentation in the absence of other processes (see Equation 2.7) and constant single-molecule concentration.)
It is assumed that the cluster concentration is in steady state, and therefore all fluxes equal a stable flux J:
2.11 ![]()
The expression for the nucleation flux can be derived as (Debenedetti, 1996; Lazaridis, 2011):
2.12 
The evaporation rate αi is difficult to determine theoretically and therefore the kinetic problem for the evaluation of the nucleation flux becomes a problem of thermodynamics for the evaluation of the equilibrium droplet distribution. For this calculation, it is necessary to examine the energy required for cluster formation.
The radius of a cluster radius containing i* molecules is given by:
2.13 ![]()
where υ′ is the molecular volume in the liquid phase, σ the surface tension and ![]() the difference in the chemical potentials between the liquid phase (cluster) and the gaseous phase. Under the assumption that the liquid is incompressible and the vapour an ideal gas, the chemical potential difference may be expressed via the saturation ratio
the difference in the chemical potentials between the liquid phase (cluster) and the gaseous phase. Under the assumption that the liquid is incompressible and the vapour an ideal gas, the chemical potential difference may be expressed via the saturation ratio ![]() .
.
The free energy of formation of an i-cluster is calculated using the capillarity approximation. In this approximation, the cluster free energy is determined by treating the cluster as an incompressible macroscopic spherical droplet with macroscopic (bulk and surface) properties. The droplet free minimum free energy, which is required for the formation of a cluster with i* molecules, can be expressed as:
2.14 ![]()
It is further assumed that there exists an equilibrium distribution of clusters. Therefore, the cluster distribution can be expressed as:
2.15 ![]()
where the free energy of an i-cluster is ![]() ,
, ![]() is the Boltzmann constant and T is the temperature. The proportionality constant is taken to be the total gas (molecular) number density of the bulk metastable state
is the Boltzmann constant and T is the temperature. The proportionality constant is taken to be the total gas (molecular) number density of the bulk metastable state ![]() .
.
The nucleation rate according to the classical theory can be expressed as:
2.16 ![]()
where ![]() is a kinetic prefactor and
is a kinetic prefactor and ![]() is the free energy of formation of the critical droplet. The expression of the kinetic prefactor for unary nucleation may be written as (Lazaridis and Drossinos, 1997):
is the free energy of formation of the critical droplet. The expression of the kinetic prefactor for unary nucleation may be written as (Lazaridis and Drossinos, 1997):
2.17 ![]()
where A is the surface area of the droplet, β the average growth rate, Z the Zeldovich nonequilibrium factor and ρυ the number density of the condensable vapour. The growth rate, also known as the impingement rate per unit area, is calculated from the kinetic theory of gases (with a unity accommodation coefficient).
The Zeldovich nonequilibrium factor arises from the number fluctuations in the critical cluster:
2.18 ![]()
The critical droplet free energy expressed in terms of the critical radius is:
2.19 ![]()
For spherical clusters, the number i* of molecules in the critical cluster becomes:
2.20 
where Δμ, which is less than 1, is the difference between the chemical potentials in the stable and metastable states (liquid and gaseous phase).
The final expression that gives the nucleation rate per unit volume according to the CNT becomes:
2.21 
where the number density in the vapour phase is used: ![]() .
.
Note that the CNT expression is occasionally divided by the saturation ratio (Seinfeld and Pandis, 2006), a correction that arises from a different treatment of nucleation kinetics.
Detailed descriptions of the CNT and of other approaches to the study of nucleation are given by Debenedetti (1996) and Drossinos and Housiadas (2006).
2.3.2 Multicomponent Nucleation
‘Multicomponent nucleation’ refers to the nucleation process where mixtures of gaseous species are involved even under unsaturated conditions. This is contrary to unary nucleation, where supersaturation is required. Multicomponent nucleation has many applications in atmospheric conditions where several gaseous condensable species exist at low concentrations.
In a recent work, Kevrekidis et al. (1999) used the method introduced by Langer (1969) to derive the nucleation rate in binary systems. Their result is formally identical to Stauffer's (1976) result for binary nucleation, but much easier to evaluate. Accordingly, the binary nucleation rate for nonassociated vapours is (see also Drossinos and Housiadas, 2006):
2.22 
where ![]() is the total number density of condensable vapours and Rij is the droplet growth tensor. The variable Dij is the matrix of second-order derivatives of the droplet free energy with respect to the number of molecules
is the total number density of condensable vapours and Rij is the droplet growth tensor. The variable Dij is the matrix of second-order derivatives of the droplet free energy with respect to the number of molecules ![]() of each species evaluated at the saddle point. As in unary nucleation, the growth matrix is expressed as the product of the droplet surface area times the impingement rate of a molecule of species
of each species evaluated at the saddle point. As in unary nucleation, the growth matrix is expressed as the product of the droplet surface area times the impingement rate of a molecule of species ![]() ,
, ![]() , where
, where ![]() is the Kronecker symbol (Drossinos and Housiadas, 2006).
is the Kronecker symbol (Drossinos and Housiadas, 2006).
2.3.3 Heterogeneous Nucleation
In the majority of cases, suspended particles exist in the atmosphere and phase transitions (nucleation) from the gaseous to the liquid phase occur on their surfaces. Suppose that a liquid embryo is formed on a particle surface. Heterogeneous nucleation upon insoluble particles takes place at lower saturation ratios than homogeneous nucleation. The minimum work required is given by Lazaridis, Kulmala and Laaksonen (1991):
2.23 ![]()
where σ refers to the interfacial tensions between different phases, the indexes g, s and l to the phase being considered (g refers to the gaseous, s to the solid and l to the liquid phase) and n to the number of molecules in the cluster.
According to the classical theory, the free energy of formation of the critical cluster on a flat surface is modified as follows (Lazaridis, Kulmala and Laaksonen, 1991; Drossinos and Housiadas, 2006):
2.24 ![]()
where the angle ![]() , which can vary from 0 to 180°, is the contact angle between the nucleating cluster and the solid substrate. For water nucleation, the solid is considered hydrophobic or hydrophilic according to whether the contact angle is greater or less than 90°.
, which can vary from 0 to 180°, is the contact angle between the nucleating cluster and the solid substrate. For water nucleation, the solid is considered hydrophobic or hydrophilic according to whether the contact angle is greater or less than 90°.
As in the case of homogeneous nucleation, the heterogeneous nucleation rate Jhet can be expressed as a product of a kinetic prefactor ![]() times an Arrhenius factor:
times an Arrhenius factor:
2.25 ![]()
The kinetic prefactor can be expressed as:
2.26 ![]()
where Rgrowth is the cluster growth rate, Z the Zeldovich nonequilibrium factor and N the product of the total number of molecules adsorbed per unit seed particle surface area (Nads) and the available surface area (Aads) for adsorption per seed particle (Lazaridis, Kulmala and Laaksonen, 1991). A useful approximation is to consider Aads the surface area that yields the maximum nucleation rate (![]() ), where dp is the seed particle diameter, an approximation that allows multiple clusters per seed particle. Therefore, the heterogeneous nucleation rate can be written as:
), where dp is the seed particle diameter, an approximation that allows multiple clusters per seed particle. Therefore, the heterogeneous nucleation rate can be written as:
2.27 ![]()
The adsorbed molecules (Nads) have a concentration equal to ![]() , where βads is the collision rate of vapour molecules per unit surface area and τ the average time an adsorbed vapour molecule remains on the particle surface. The latter may be written as
, where βads is the collision rate of vapour molecules per unit surface area and τ the average time an adsorbed vapour molecule remains on the particle surface. The latter may be written as ![]() , where L is the heat of adsorption and Rg the gas constant. The characteristic time scale τo is the inverse vibrational frequency of two harmonically bound molecules
, where L is the heat of adsorption and Rg the gas constant. The characteristic time scale τo is the inverse vibrational frequency of two harmonically bound molecules ![]() , where U is the intermolecular interaction potential and mμ is the reduced mass.
, where U is the intermolecular interaction potential and mμ is the reduced mass.
The particle activation probability Pd(t) is the ratio of the concentration of activated particles Nd(t) to the initial (inactivated particle) concentration Nd,in:
2.28 ![]()
where k is the activation rate per preexisting particle. If particle activation occurs via heterogeneous nucleation, the activation rate constant is taken to be the heterogeneous nucleation rate. Particles are considered to be activated once their activation probability is greater than or equal to 0.5. A detailed presentation of classical heterogeneous nucleation and its application to particle activation in condensation particle counters can be found in Giechaskiel et al. (2011).
2.3.4 Atmospheric Nucleation
New particle formation in the atmosphere has been observed in the vicinity of polluted sources and in clean, remote regions (Kulmala et al., 2004). Nucleation bursts (homogeneous nucleation) may be responsible for the occurrence of new particle formation in clean environments where the background aerosol concentration is low (Seinfeld and Pandis, 2006).
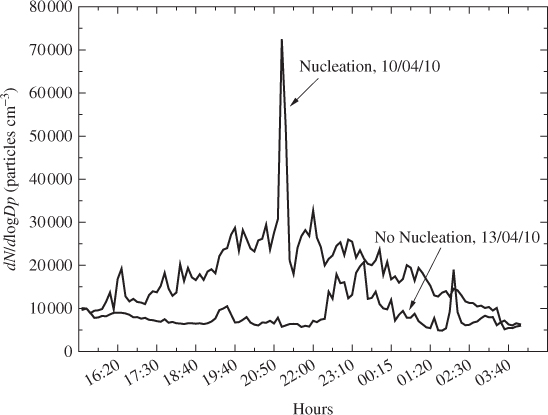
A main characteristic of a nucleation event is the increase in the aerosol number concentration at the ambient atmosphere. Figure 2.2 shows a comparison of the number size distribution versus time for two days (with and without a nucleation event) as measured at the Acrotiri research station (Chania, Greece). It may be noted that during the nucleation burst, the total number of airborne atmospheric particles increased significantly and rapidly. More precisely, the particle concentration increased on average by 46%, with a maximum value of 72 427 cm−3 (92% increase) after 6 hours. This nucleation event was observed on 10 April 2010 (Lazaridis et al., 2008).
Figure 2.2 Comparison of a nucleation event and a non-event day observed at the Akrotiri research station, Crete, Greece.
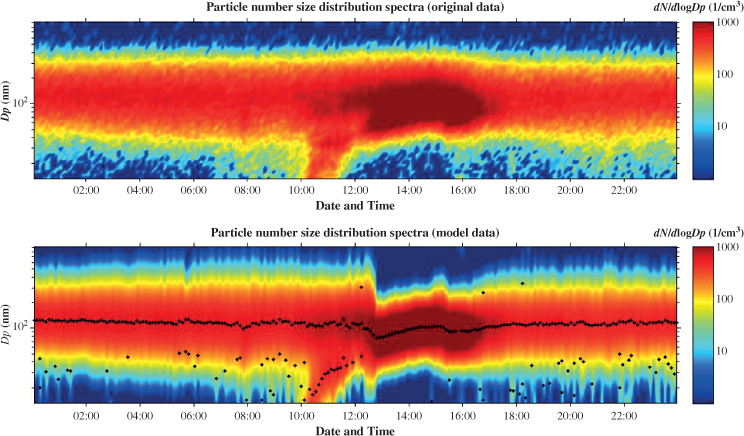
Another characteristic case of a nucleation event is presented in Figure 2.3. On 7 July 2009, a nucleation event was registered starting at about 10.00 am and lasting until 17.30 pm (local time). It was calculated that the maximum number concentrations of particles with aerodynamic diameter lower than 51.3 nm and lower than 101.1 nm corresponded to 37 and 71% of the total particle number concentration, respectively. Moreover, during the event the number concentration was 793 ± 281 particles cm−3, whereas for over 3 hours the concentration was higher than the threshold of 1000 particles cm−3, with the maximum value exceeding 1200 particles cm−3.
Figure 2.3 New particle formation event observed during the summer of 2009 (7 July) at the Akrotiri research station (observations and modelled data), Crete, Greece. See plate section for colour version.
2.4 Growth by Condensation
The particle size in the atmosphere changes primarily through water vapour condensation and evaporation processes. The rate of particle size increase depends on the relative humidity, the particle size and the relative sizes of particles compared to the gas mean free path.1 Other supersaturated vapour species in the atmosphere may participate in particle growth.
Condensation or evaporation is driven by the pressure difference between the ambient vapour pressure and the vapour pressure at the surface of the particle. The direction of net vapour flux (evaporation or condensation) depends on their relative magnitudes. At the beginning of the particle growth process the nucleated particle diameter is smaller than the gas mean free path. Under these conditions, the particle growth rate depends on the rate of the random molecular impacts between the particles and the water vapour molecules. The rate of particle diameter increase is given by Lazaridis (2011):
2.29 
where ![]() is the partial water vapour pressure around the particle, but at a large distance from its surface, pd is the partial water vapour at the particle surface, ac is the condensation coefficient that specifies the percentage of molecules which adhere at the particle surface after impingement, M is the molecular liquid weight, ρp is the liquid density and Na is the Avogadro number.
is the partial water vapour pressure around the particle, but at a large distance from its surface, pd is the partial water vapour at the particle surface, ac is the condensation coefficient that specifies the percentage of molecules which adhere at the particle surface after impingement, M is the molecular liquid weight, ρp is the liquid density and Na is the Avogadro number.
When the particle size becomes considerably larger than the gas mean free path, the rate of particle growth is related to the rate of diffusion of molecules to the particle surface. The rate of increase of the particle diameter (dp) can be written as:
where R is the gas constant and ϕ is the Fuchs correction factor. Equation 2.30 is based on molecular diffusion theory at the droplet surface. The diffusion equation, as well as the concept of pressure difference, is not valid for distances less than one gas mean free path from the droplet's surface. A number of approximations based on the so-called ‘flux-matching techniques’ have been introduced, among them the Fuchs correction factor, also known as the Knudsen correction factor. The Fuchs correction factor is given by:
2.31 ![]()
A quick increase in the droplet size also leads to a temperature increase, due to latent heat release during condensation.
The atmosphere mainly consists of soluble particles. We will look at a common atmospheric soluble particle, sodium chloride, in order to discuss how its size changes. When salt dissolves in water, the boiling point of the solution increases and its freezing point decreases, due to the decrease in the water vapour pressure. The affinity of the dissolved salt for the water molecules allows the formation of stable droplets in saturated or undersaturated environments.
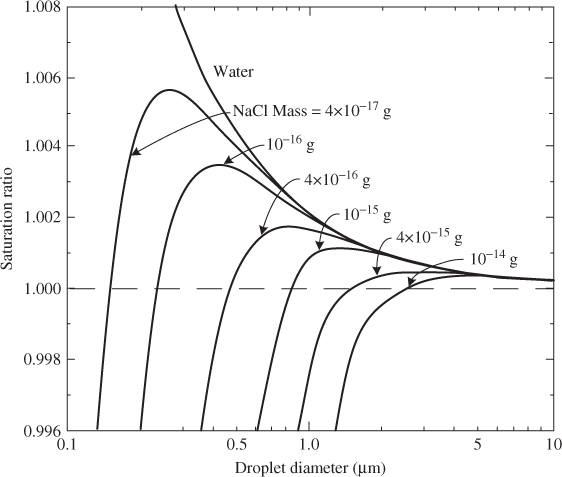
Two competitive mechanisms occur during the changes in size of a soluble particle. The salt concentration inside the droplet increases with a decrease in its size. Concurrently, the Kelvin effect should be taken into account; this leads to an increase in the vapour pressure at the droplet surface with a decrease in its size. The relation between the Kelvin ratio KR and the size of a droplet that contains dissolved chemical components is written as:
2.32 
where m is the mass of the dissolved chemical constituent of mass Ms, Mw the molecular weight of the solvent (usually water), ρ the density of the solvent and i the number of ions into which a salt molecule dissociates. Figure 2.4 shows that the presence of dissolved salt dramatically changes the curve of pure water (solid line).
Figure 2.4 Saturation ratio versus droplet size for pure water and for water droplets containing dissolved sodium chloride at temperature 293 K (20 °C). The region above each curve is the condensation region and the region below it the evaporation region.
2.5 Coagulation and Agglomeration
Aerosols in the atmosphere can collide as a result of their Brownian motion or of hydrodynamic, electrical or gravitational forces. These collisions result in either particle coagulation, where the colliding primary particles fuse together and lose their identity, or agglomeration, where they retain their identity and shape. Both mechanisms are crucial to the development of the particle size distribution in the atmosphere (Friedlander, 2000; Drossinos and Housiadas, 2006). The effect of particle collisions in the atmosphere is well described by the Smoluchowski equation, which is usually expressed in terms of particle volume coordinates (Williams and Loyalka, 1991). The Smoluchowski coagulation equation may be written in terms of continuous or discrete distributions; for example, see Equation 2.5 (Williams and Loyalka, 1991; Seinfeld and Pandis, 2006). Particle coagulation leads to a decrease in the number of particles and an increase in their size (diameter).
2.5.1 Brownian Coagulation
Here we will look at Brownian motion resulting from the relative movement of the particles, also called thermal coagulation. A simple case will be examined for spherical particles of diameter larger than 0.1 µm. We assume that particles coagulate after each collision and that the initial change in particle size is small. Furthermore, we focus on a single particle (which does not undergo Brownian motion) and consider the diffusive flux of the other particles to its surface.
The particle number N(t) at time t is given by:
where No is the initial particle number and Ko is the coagulation coefficient, which is given by the relation ![]() (m3/s) (dp is the particle diameter and D is the diffusion coefficient). Equation 2.33 can be easily obtained from Equation 2.6 by noting that
(m3/s) (dp is the particle diameter and D is the diffusion coefficient). Equation 2.33 can be easily obtained from Equation 2.6 by noting that ![]() and that in Equation 2.6 the central particle is also in Brownian motion (in which case the diffusion coefficient in the expression for
and that in Equation 2.6 the central particle is also in Brownian motion (in which case the diffusion coefficient in the expression for ![]() describes the relative motions of two particles
describes the relative motions of two particles ![]() where
where ![]() is the single-particle diffusion coefficient).
is the single-particle diffusion coefficient).
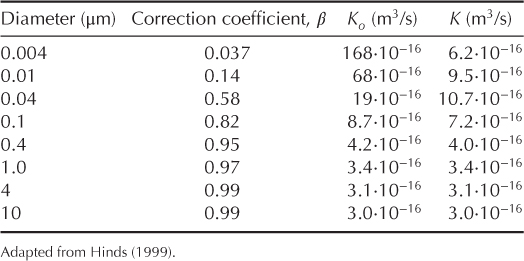
The coagulation rate, as obtained by differentiating Equation 2.33, is proportional to N2, which denotes high rates for increased particle concentrations (Lazaridis, 2011). Equation 2.33 is not applicable for concentration variations at distances of approximately one gas mean free path from the particle's surface; therefore, its region of validity is restricted to particles larger than 0.1 µm. The importance of noncontinuum effects increases as the diameter decreases; they become significant for diameters smaller than 0.4 µm. A correction for the coagulation coefficient was proposed by Fuchs:
2.34 ![]()
At standard conditions (temperature of 298.15 K and pressure of 100 kPa), numerical values for the functions β, Ko and K are given in Table 2.1.
Table 2.1 Coagulation coefficients at standard conditions
2.5.2 Agglomeration
Particles that retain their identity upon collision agglomerate to form complex structures. Such aggregates are generated in emissions from, for example, combustion in diesel engines, coal combustion in power plants and commercial production of fine particles. Aggregate morphology and hydrodynamic properties influence their size distribution, their precipitation and deposition behaviour and their agglomeration.
In general, the primary particles that compose an aggregate are polydisperse. However, for simplicity, and in the absence of appropriate theoretical models, we will analyse only aggregates composed of identical spherical monomers. Forrest and Witten (1979), by analysing the agglomeration of ultrafine smoke particle, were the first to suggest that the resulting agglomerates form fractal-like (quasifractal) structures obeying the following scaling law (over a finite size range):
where ![]() is the number of primary particles that form the aggregate,
is the number of primary particles that form the aggregate, ![]() the fractal (or Hausdorff) dimension,
the fractal (or Hausdorff) dimension, ![]() the fractal prefactor,
the fractal prefactor, ![]() the radius of gyration and
the radius of gyration and ![]() the radius of the primary particles. The fractal dimension provides a quantitative measure of the degree to which a structure fills physical space: a compact three-dimensional object has
the radius of the primary particles. The fractal dimension provides a quantitative measure of the degree to which a structure fills physical space: a compact three-dimensional object has ![]() , whereas a line has
, whereas a line has ![]() . The fractal prefactor, whose importance was first appreciated by Wu and Friedlander (1993), is an indicator of the aggregate's local structure. For equal-mass identical monomers, the radius of gyration, a geometric measure of the mass distribution about the aggregate centre of mass, becomes the root-mean-square distance of the monomers from the cluster centre of mass:
. The fractal prefactor, whose importance was first appreciated by Wu and Friedlander (1993), is an indicator of the aggregate's local structure. For equal-mass identical monomers, the radius of gyration, a geometric measure of the mass distribution about the aggregate centre of mass, becomes the root-mean-square distance of the monomers from the cluster centre of mass:
2.36 
where ![]() is the position of the ith monomer and the cluster centre of mass is
is the position of the ith monomer and the cluster centre of mass is  . The additional term
 ![]() is frequently added to ensure that the scaling law remains valid even as the number of monomers tends to unity. It can be chosen to be either the monomer radius or, preferably, the monomer radius of gyration
is frequently added to ensure that the scaling law remains valid even as the number of monomers tends to unity. It can be chosen to be either the monomer radius or, preferably, the monomer radius of gyration ![]() .
.
The fractal dimension depends on the agglomeration mechanism: computer simulations have been used extensively to study the fractal dimension of aggregates formed via particle–cluster or cluster–cluster aggregation in two and three dimensions, the agglomeration mechanism being diffusive, reaction-limited or ballistic. For example, three-dimensional simulations of diffusion-limited cluster–cluster growth predict ![]() and particle–cluster growth gives
and particle–cluster growth gives ![]() (see for example Table 1.6 in Colbeck, 1998). The most studied aggregates are those generated via diffusion-limited cluster-cluster aggregation (DLCA) or reaction-limited cluster-cluster aggregation (RLCA). For both groups, the agglomeration mechanism is diffusion, the difference arising from the cluster–monomer sticking probability, which is unity for DLCA clusters and approximately 0.001 for RLCA clusters. The most frequently used scaling law parameters are (
(see for example Table 1.6 in Colbeck, 1998). The most studied aggregates are those generated via diffusion-limited cluster-cluster aggregation (DLCA) or reaction-limited cluster-cluster aggregation (RLCA). For both groups, the agglomeration mechanism is diffusion, the difference arising from the cluster–monomer sticking probability, which is unity for DLCA clusters and approximately 0.001 for RLCA clusters. The most frequently used scaling law parameters are (![]() ,
, ![]() ) for DLCA aggregates and (
) for DLCA aggregates and (![]() ) for RLCA clusters.
) for RLCA clusters.
It should be noted that the fractal-like scaling law is valid in a statistical sense, in that the aggregate properties become self-similar after an ensemble average over many aggregates. In that sense, aggregates resemble random isotropic fractals exhibiting inherent randomness that becomes self-similar only in a statistical sense. Moreover, since the aggregates have a finite extent, they are never exactly self-similar. They exhibit self-similarity over a finite range of scales; for that reason, they are referred to as ‘fractal-like aggregates’. These observations become more precise when we consider the orientationally averaged monomer–monomer correlation function ![]() . Its physical interpretation is that it gives the probability (per unit volume) of finding a monomer at distance r from another, arbitrarily chosen monomer. An analytic expression for
. Its physical interpretation is that it gives the probability (per unit volume) of finding a monomer at distance r from another, arbitrarily chosen monomer. An analytic expression for ![]() is highly desirable, as structural and dynamical aggregate properties depend on it. A frequently used expression is:
is highly desirable, as structural and dynamical aggregate properties depend on it. A frequently used expression is:
where A is a constant (to be determined from the normalisation condition that the spatial integral of ![]() over the system volume equal the number of monomers). The algebraic decay arises from the scaling behaviour and the stretched exponential—the cut-off function—models finite-size effects. The correlation length
over the system volume equal the number of monomers). The algebraic decay arises from the scaling behaviour and the stretched exponential—the cut-off function—models finite-size effects. The correlation length ![]() is a measure of the fractal's diffuse interface and
is a measure of the fractal's diffuse interface and ![]() is the stretching exponent. The most accurate expression for
is the stretching exponent. The most accurate expression for ![]() to date was proposed by Lattuada, Wu and Morbidelli (2003a), who appreciated the importance of small-scale structure (absent in Equation 2.37, which becomes more accurate as the number of monomers increases). The stretching exponent has been determined to be 2.02 (Heinson, Sorensen and Chakrabarti, 2012) or 2.20 (Lattuada, Wu and Morbidelli, 2003b) for DLCA clusters and 2.16 for RLCA clusters (Lattuada, Wu and Morbidelli, 2003b). The limit
to date was proposed by Lattuada, Wu and Morbidelli (2003a), who appreciated the importance of small-scale structure (absent in Equation 2.37, which becomes more accurate as the number of monomers increases). The stretching exponent has been determined to be 2.02 (Heinson, Sorensen and Chakrabarti, 2012) or 2.20 (Lattuada, Wu and Morbidelli, 2003b) for DLCA clusters and 2.16 for RLCA clusters (Lattuada, Wu and Morbidelli, 2003b). The limit ![]() corresponds to a sharp aggregate interface, where the scaling law, Equation 2.35, is satisfied exactly up to the sharp interface.
corresponds to a sharp aggregate interface, where the scaling law, Equation 2.35, is satisfied exactly up to the sharp interface.
The mobility of N-monomer fractal-like aggregates is usually expressed in terms of the mobility radius ![]() , defined via the Stokes friction coefficient:
, defined via the Stokes friction coefficient:
where ![]() is the aggregate mechanical mobility,
is the aggregate mechanical mobility, ![]() the Stokes–Einstein diffusion coefficient,
the Stokes–Einstein diffusion coefficient, ![]() the Boltzmann constant,
the Boltzmann constant, ![]() the fluid viscosity,
the fluid viscosity, ![]() the Cunningham slip correction factor (see Equation 2.44) and
the Cunningham slip correction factor (see Equation 2.44) and ![]() the absolute temperature. In the continuum momentum and mass-transfer regimes (unity slip correction factor), the mobility radius equals the hydrodynamic radius
the absolute temperature. In the continuum momentum and mass-transfer regimes (unity slip correction factor), the mobility radius equals the hydrodynamic radius ![]() . Herein, we shall concentrate on empirical expressions for the mobility radius in the continuum regime.
. Herein, we shall concentrate on empirical expressions for the mobility radius in the continuum regime.
Recently, Melas et al. (2013), using a methodology proposed by Isella and Drossinos (2011), determined the hydrodynamic radius of orientationally averaged aggregates via the calculation of molecule–aggregate collision rates. The latter were obtained from the solution of a diffusion equation (a Laplace equation instead of the creeping-flow Stokes equations) with appropriate boundary conditions. An analysis of their results suggested the following empirical relationship:
The particularity, and usefulness, of Equation 2.39 is that neither the fractal dimension nor the fractal prefactor are separately required to estimate the hydrodynamic radius. This contrasts with most empirical fits available in the literature (see, for example, the review of the mobility of fractal aggregates in Sorensen, 2011), where the hydrodynamic radius is expressed in terms of cluster statistical properties like ![]() and
and ![]() . According to Equation 2.39, the hydrodynamic radius may be calculated for a single cluster if the monomer positions are known (from simulations or experimental measurements), since the independent variables do not depend on ensemble-averaged properties.
. According to Equation 2.39, the hydrodynamic radius may be calculated for a single cluster if the monomer positions are known (from simulations or experimental measurements), since the independent variables do not depend on ensemble-averaged properties.
Predictions of Equation 2.39 were compared to predictions of an expression proposed by Kirkwood and Riseman (1948) in their pioneering analysis of the translational diffusion coefficient of flexible macromolecules. The Kirkwood–Riesman expression for the hydrodynamic radius is a geometric expression as well, in that it depends on monomer positions only; it is:
Predictions of Equation 2.40 were found to be slightly lower than numerical simulations and empirical-fit predictions (Equation 2.39) for small aggregates, approaching the same limit as the number of monomers increases.
Given an analytical expression for the hydrodynamic radius of fractal-like aggregates, be it Equation 2.39 or 2.40, the Smoluchowski collision kernel between fractal-like aggregates in the continuum regime can be determined. The Smoluchowski kernel for agglomerating spheres (i,j) resulting from their thermal motion (Brownian agglomeration) is:
2.41 ![]()
where the first factor is the sum of the collision radii ![]() (for spherical particles equal to their geometric radii) and the second factor is the sum of the corresponding Stokes–Einstein diffusion coefficients
(for spherical particles equal to their geometric radii) and the second factor is the sum of the corresponding Stokes–Einstein diffusion coefficients ![]() . For fractal-like aggregates, the collision radii may be taken to be the radii of gyration and calculated from the scaling law (Equation 2.35), and the diffusion coefficients may be expressed in terms of the hydrodynamic radii (according to Equation 2.38) and, for example, Equation 2.39, to obtain:
. For fractal-like aggregates, the collision radii may be taken to be the radii of gyration and calculated from the scaling law (Equation 2.35), and the diffusion coefficients may be expressed in terms of the hydrodynamic radii (according to Equation 2.38) and, for example, Equation 2.39, to obtain:
2.42 
We have assumed that the two agglomerating aggregates have identical morphology, namely identical fractal dimensions and prefactors. More complicated expressions have been proposed for the modifications of the Smoluchowski kernel in the transition regime for colliding fractal-like structures; see, for example, Thajudeen, Gopalakrishnan and Hogan (2012).
2.6 Deposition Mechanisms
Deposition mechanisms are responsible for the migration of aerosol particles suspended in a fluid and their consequent transfer and deposition to a surface or transfer across boundaries within the flow (Drossinos and Housiadas, 2006). Deposition is an external process in the GDE. Extensive presentations of single-particle deposition have appeared in the literature (Friedlander, 2000; Drossinos and Housiadas, 2006). A study of single-particle deposition in a fluid is presented here without reference to aspects related to convective transport and deposition.
2.6.1 Stokes Law
A particle moving in a fluid feels a drag force, referred to as Stokes drag, that acts in the direction opposite to its own. The flow around a moving aerosol particle is usually in the Stokes regime (![]() ). The particle Reynolds number (Rep) can be expressed as
). The particle Reynolds number (Rep) can be expressed as ![]() , where V is the mean velocity of the particle relative to the fluid and
, where V is the mean velocity of the particle relative to the fluid and ![]() is the kinematic viscosity (Drossinos and Housiadas, 2006).
is the kinematic viscosity (Drossinos and Housiadas, 2006).
The net force exerted by the fluid on the moving particle may be derived from the solution of the Navier–Stokes equations, which describe fluid motion; the exerted force is obtained by integrating the normal and tangential forces over the particle surface. In addition, for small particles, momentum transfer (from the fluid to the particle) does not occur in the continuum momentum transfer regime, leading to a decrease of the Stokes drag force. The total resisting force acting on a small spherical particle of velocity V in the fluid is expressed as (Hinds, 1999):
2.43 ![]()
where ![]() is a correction factor, referred to as the Cunningham slip correction factor, given by:
is a correction factor, referred to as the Cunningham slip correction factor, given by:
where ![]() is the mean free path.
is the mean free path.
2.6.2 Gravitational Settling
The gravitational settling velocity for a spherical particle in still air is obtained from Stokes drag force to give:
where g is the acceleration due to gravity and η is the fluid viscosity. The terminal settling velocity in Equation 2.45 increases rapidly with particle size. The slip correction factor has been incorporated to render this expression valid for any particle size.
A quantity that is often used in aerosol science is the mechanical mobility B (in m N−1 s−1), which is the ratio of the terminal velocity of a particle to the steady force producing that velocity (Hinds, 1999):
2.46 ![]()
A correction factor is applied to Stokes law for nonspherical particles, called the dynamic shape factor ![]() . Accordingly, Equation 2.45 becomes:
. Accordingly, Equation 2.45 becomes:
2.47 ![]()
where the equivalent volume diameter de replaces the particle diameter. The volume equivalent diameter de is the diameter of a sphere having the volume of the particle. In most cases, the dynamic shape factor ![]() has values greater than one, which means that nonspherical particles settle with smaller settling velocity than their equivalent spherical particles.
has values greater than one, which means that nonspherical particles settle with smaller settling velocity than their equivalent spherical particles. ![]() usually varies between 1 (sphere) and 2. Dynamic shape factor values for various particle shapes can be found in Hinds (1999).
usually varies between 1 (sphere) and 2. Dynamic shape factor values for various particle shapes can be found in Hinds (1999).
A characteristic particle diameter that is used extensively in aerosol science and technology is the equivalent aerodynamic diameter, which expresses particle size in a homogeneous manner. It is defined as the diameter of a sphere of density 1 g/cm3 and the same settling velocity as the particle under study. The aerodynamic diameter ![]() is useful because it can be correlated to the residence time of particles in the atmosphere and their deposition in the human RT. It is related to the volume equivalent diameter via:
is useful because it can be correlated to the residence time of particles in the atmosphere and their deposition in the human RT. It is related to the volume equivalent diameter via:
2.48 
where ρ is the particle density, whereas ρo = 1 g/m3.
Particles of diameter smaller than 0.5 µm are better described by the thermodynamic equivalent diameter, also known as the mobility equivalent diameter, see Equation 2.38, which is the diameter of a spherical particle that has the same diffusion coefficient as the particle under study. The equivalent thermodynamic diameter can be calculated with the help of parameters that control the diffusion of particles through:
2.49 ![]()
where T is the absolute temperature (310.15 K), kB is the Boltzmann constant (0.014 × 10⁻²³ J/grad) and μ is the dynamic viscosity of air (1.90 × 10⁻⁴ Poise).
Furthermore, the thermodynamic diameter is connected to the equivalent aerodynamic diameter of the particle via:
2.50 
2.6.3 Deposition by Diffusion
Particle diffusion results from its Brownian motion, which is the random motion of the particle in the fluid as a result of its continuous bombardment by gaseous molecules. Diffusion of particles is the net transport under the influence of a concentration gradient. The particles move from regions of high concentration to regions of low concentration. Fick's first law of diffusion describes Brownian motion; it can be written as:
2.51 ![]()
where J is the number flux vector (particles/m2 s), n the number particle concentration (particles/m3) and D a diffusion coefficient (m2/s) (Drossinos and Housiadas, 2006).
The particle diffusion coefficient can be expressed as (Hinds, 1999):
where kB = 1.381 × 10⁻²³ J K−1 is the Boltzmann constant. Equation 2.52 is called the Stokes-Einstein equation. Another way of expressing the diffusion coefficient in terms of particle mobility is
2.53 ![]()
2.6.4 Deposition by Impaction
Impaction occurs when particles do not follow the fluid streamlines, due to their inertia, and consequently collide on a surface. This happens in a curvilinear motion inside the human RT or inside a size classifier (e.g. cascade impactors). The parameter that describes the deviation of a particle trajectory from the fluid streamlines is the dimensionless Stokes number (Stk), defined as the characteristic velocity times the relaxation time (τv) divided by a characteristic length of the flow (L). A detailed description of the Stokes number is presented in Drossinos and Housiadas (2006).
The Stokes number can be expressed as:
2.54 ![]()
For a cascade impactor, the characteristic length is defined with respect to the nozzle radius. When Stk ![]() 1, particles follow the fluid streamlines perfectly, whereas when Stk
1, particles follow the fluid streamlines perfectly, whereas when Stk ![]() 1, particles move along straight lines, deviating from the fluid streamlines if they curve.
1, particles move along straight lines, deviating from the fluid streamlines if they curve.
2.6.5 Phoretic Effects
The motion of aerosol particles depends on the external forces that act upon them. The most commonly encountered external forces that influence a particle's mobility, and thus lead to particle transport, are related to thermophoresis and diffusiophoresis.
A thermal gradient in a fluid induces a thermophoretic force on aerosol particles, since gaseous molecules exert different impulses to particles on the colder and warmer sides. The thermal gradient results in a net force that moves the particles from the high- to the low-temperature region. The thermophoretically induced particle flux is expressed as:
2.55 ![]()
where n is the particle concentration and υth the thermophoretic velocity. The thermophoretic velocity can be expressed as:
2.56 ![]()
where Kth is a dimensionless parameter, called the thermophoretic coefficient, that depends on properties of both the gas and the particle (Drossinos and Housiadas, 2006).
The dynamics of aerosols, and more specifically their deposition as they are transported in a flowing fluid, is of great importance in technological applications such as aerosol filtration and instrumentation. A thorough discussion of these processes is examined in the scientific literature (Hinds, 1999; Friedlander, 2000; Drossinos and Housiadas, 2006). A brief discussion of aerosol deposition in the atmosphere and in the human RT is presented in this chapter.
2.6.6 Atmospheric Aerosol Deposition
Aerosol deposition in the atmosphere is a complex process; consequently, it is common practise to parameterise it using the concept of deposition velocity. Aerosols are removed from the atmosphere through the mechanisms of dry and wet deposition. The deposition velocity is defined as the ratio of the deposition flux of the specified pollutant (Seinfeld and Pandis, 2006) to the pollutant concentration (hence, the deposition velocity is nothing other than an appropriately defined mass-transfer coefficient). Two general approaches can be used to determine the dry deposition velocity. The first method uses available experimental data for different aerosol species. The second method is based on a calculation of the transfer of materials from the atmosphere to the earth's surface through different resistance mechanisms; such resistance mechanisms are the aerodynamic resistance, the surface resistance and the transfer resistance.
Particle deposition varies with particle size and can be expressed as:
2.57 ![]()
where the term on the left-hand side (LHS) is the deposition velocity (m/s) of particles in size bin i and the variable r on the RHS is an appropriately chosen resistance; the subscript a identifies the aerodynamic resistance (s/m), the subscript d the deposition layer resistance (s/m) of particles in size bin i. The variable v with subscript g is the gravitational settling velocity (m/s) of particles in size bin i.
A review of field measurements aimed at determining the deposition velocity of various species is presented in Seinfeld and Pandis (2006). However, measurements of dry deposition have not yet provided a complete understanding of the dry deposition process, since the problem is quite complex, involving many factors that cannot be accounted for in the various field studies. These uncertainties include meteorological conditions (and specifically temporal and spatial characteristics of atmospheric turbulence), surface characteristics and aerosol properties.
Wet scavenging is also an efficient mechanism for the removal of aerosols from the atmosphere. Below-cloud scavenging rate has an approximate value of 3 × 10⁻⁵ s−1 and in-cloud scavenging is about 10 times larger. The wet deposition velocity can be expressed as the product of an average scavenging rate (Λ) and the vertical height h, where a uniform distribution of pollutant is assumed between the earth surface and height h. A detailed discussion of wet deposition characteristics is presented in Finlayson Pitts and Pitts (2000).
2.6.7 Deposition in the Human Respiratory Tract
Besides a definition of a detailed morphometric model for the respiratory system, understanding of particle deposition in the human RT requires information on the particle size distribution characteristics. The most widely used inhalation model, in which the main aspects of the respiratory system are introduced, is the ICRP model (International Commission on Radiological Protection, 1994).
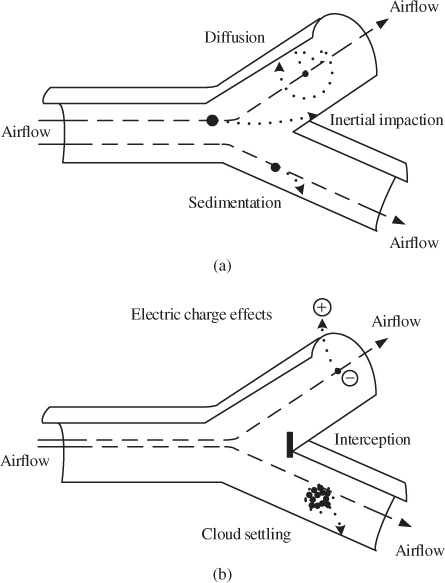
Particle deposition in the RT depends on the size and physicochemical properties of the particles and the physiology of the person. Inertial impaction, settling and Brownian diffusion are the most important deposition mechanisms in the RT (Housiadas and Lazaridis, 2010; Lazaridis, 2011) (see also Figure 2.5). In addition, interception and electrostatic deposition are important in a number of cases (Hinds, 1999). Total particle deposition efficiency is calculated as a superposition of independent deposition efficiencies arising from different deposition mechanisms.
Figure 2.5 Schematic description of deposition mechanisms ((a) diffusion, sedimentation and impaction; (b) interception and electrostatics) of particles in the RT. (Adapted from Ruzer and Harley, 2005.)
The dose of particles in each part of the RT is calculated using the following expression:
2.58 
where H is the dose rate (µg/h), n0 the inhalability ratio, cA the aerosol concentration in air, B the ventilation rate, α the fine mode mass fraction, nfine, i the fine-particle retention in lung region i and ncoarse, i the coarse-particle retention in lung region i (International Commission on Radiological Protection, 1994).
An important factor that determines the intake efficiency at which ambient aerosols enter the mouth and nose is the inhalability (I). The entrance of particles inside the RT depends on the flow characteristics close to the mouth and nose and on the particle size. ‘Inhalability’ is defined as the ratio of the particle mass concentration inspired through the nose or the mouth (Mo) for a specific size to the ambient mass concentration (Mo,amb) (Hinds, 1999; Lazaridis, 2011):
2.59 ![]()
Regional deposition profiles in the lung are usually given in terms of deposition fractions (DF) in specific functional compartments: the nasopharyngeal region (the extrathoracic compartment, ET), the tracheobronchial region (TB) and the alveolar region (AL) (Housiadas and Lazaridis, 2010). For an average person performing an average activity (average parameter values), the deposition of particles can be described by the following empirical equations (Hinds, 1999):
2.60 
2.61 ![]()
2.62 ![]()
The total deposition fraction can be expressed as the sum of the fractions:
2.63 
Equations are applicable for particles of diameters between 0.001 and 100 µm, and the results agree with the predictions of the ICRP model, with a deviation of ±0.03%.
2.7 Resuspension
Particle resuspension resulting from turbulent fluid flow is important in the interaction of the atmosphere with various surfaces and in numerous industrial processes. Current models of particle resuspension are based either on force- or energy-balance models. In force-balance models, resuspension occurs when aerodynamic lift forces become greater than the adhesive forces. Force-balance models underestimate the resuspension rate as they neglect energy transfer from the turbulent fluid to a bound particle (Ziskind, Fichman and Gutfinger, 1995; Lazaridis, Drossinos and Georgopoulos, 1998). In energy-balance approaches, the deposited particle is considered to be bound to the surface by an anharmonic potential (Reeks, Reed and Hall, 1988). In the presence of turbulent flow, the fluid transfers energy to the particle through turbulent eddies, and when the particle has accumulated enough energy to escape from the potential well, it resuspends. This section examines the energy-balance approach in the study of monolayer and multilayer resuspension, based on the works of Reeks, Reed and Hall (1988), Lazaridis and Drossinos (1998) and Lazaridis, Drossinos and Georgopoulos (1998).
2.7.1 Monolayer Resuspension
The resuspension rate J, the rate at which a particle can cross the barrier of the adhesive potential well, can be expressed in terms of the height of the potential barrier Q and the average potential energy of particles (<U>) in the potential well (Lazaridis et al., 1998):
2.64 ![]()
where ωo is a linear function of the natural frequency of vibration of the bound particle.
The fraction of particles fR that remain on the surface can be calculated from a first-order kinetic equation (Lazaridis et al., 2008):
2.65 ![]()
which shows that fR decays exponentially with the time exposure to flow.
Since both the surface and the particle surfaces are rough, surface roughness results in a distribution of adhesive forces that can be incorporated through a renormalisation of the particle radius. Defining the normalised particle radius as ![]() , the probability distribution of the effective particle radius becomes a probability distribution for
, the probability distribution of the effective particle radius becomes a probability distribution for ![]() . It has been argued (Reeks, Reed and Hall, 1988) that the probability density function of the adhesive forces may be approximated by a lognormal distribution:
. It has been argued (Reeks, Reed and Hall, 1988) that the probability density function of the adhesive forces may be approximated by a lognormal distribution:
2.66 ![]()
where ![]() is the geometric mean of
is the geometric mean of ![]() and σ is the standard deviation of the lognormal distribution.
and σ is the standard deviation of the lognormal distribution.
Using the fraction of particle remaining fR, the fractional resuspension rate Λ(t) may be derived as (Lazaridis, Drossinos and Georgopoulos, 1998):
2.67 ![]()
Different expressions can be used for the mean lift force responsible for particle resuspension. Among other expressions for the mean lift force, that derived by Leighton and Acrivos (1985) for a sphere resting on a flat surface in wall-bounded shear is:
The energy-balance resuspension model has been applied to calculate the resuspension rate of alumina particles from stainless-steel surfaces. The energy spectrum of the turbulent flow—the one-dimensional Fourier transform of the velocity autocorrelation tensor—used in the calculations was taken from Hall (1994). A comparison with experimental data is shown in Figure 2.6; it can be seen that the model under-predicts the resuspension rate. Additional research is required to determine the effect of surface roughness and drag force on the resuspension of single particles, in order to more accurately model experimental data.
Figure 2.6 Comparison of model predictions and experimental data for 10 µm alumina spheres on a stainless-steel surface, using the mean lift force of Leighton and Acrivos, Equation 2.68 (![]() = 100 or 1000, σ = 10.4, t = 1 s). Adapted with permission from Lazaridis, Drossinos and Georgopoulos (1998). Copyright © 1998, Elsevier Ltd.
= 100 or 1000, σ = 10.4, t = 1 s). Adapted with permission from Lazaridis, Drossinos and Georgopoulos (1998). Copyright © 1998, Elsevier Ltd.
2.7.2 Multilayer Resuspension
Particle resuspension from a multilayer deposit induced by turbulent flow is also an important process; the resuspension rate can be derived by solving a set of coupled, first-order kinetic equations (Lazaridis and Drossinos, 1998).
Currently, two multilayer resuspension models exist: one proposed by Lazaridis and Drossinos (LD; Lazaridis and Drossinos, 1998) and one proposed by Friess and Yadigaroglou (FY; Friess and Yadigaroglu, 2001). Both models assume an idealised description of the deposit. The multilayer deposit is considered to consist of n layers, each of which has Ni(t) noninteracting particles (the index i denotes the particle layer; i = 1 refers to the first, top, layer). The particles are assumed to be identical, nondeformable spherical particles. Only interlayer interactions are considered; intralayer interactions are neglected. Particles are stacked one on top of another. Initially, all lattice sites are occupied such that the number of particles per layer is constant and equal to N0. The difference between the two models is best appreciated by taking the single-particle resuspension rate J independent of the layer number. Accordingly, the two models describe the rate of change of Ni by:
2.69 
2.70 ![]()
Both models express the rate of change of the number of particles in the ith layer as the product of the number of particles in that layer, Ni(t), times the resuspension rate per particle J times the fraction of particles exposed (to the turbulent flow). The models differ in how the fraction of exposed particles is calculated. LD argue that the rate of change of Ni(t) is determined solely from the fraction of particles resuspended (missing or holes) from the (i − 1)th layer; this is, whenever a particle is removed from the layer above, the particle below immediately resuspends (the superscript 0 refers to the initial number of particles in a given layer). Hence, the model is valid for large resuspension rates or, equivalently, gives the maximum multilayer resuspension rate. FY, on the other hand, argue that the resuspension rate depends on the relative difference between the number of particles in the (i − 1)th layer and the ith layer. As such, the FY model is more general and provides the appropriate description of generic resuspension from a multilayer deposit.
An interesting, and distinguishing, feature of the LD model is that the single-particle resuspension rate is allowed to vary with particle position in the deposit: it is taken to be layer-dependent. The system of coupled, first-order kinetic equations that describes the rate of change of the number of particles in the ith layer can thus be expressed as:
2.71 
where the superscript 0 denotes the initial number of particles in a given layer.
The kinetic equation for the first layer can be written as:
2.72 ![]()
The solution of this set of equations gives the resuspension rate at different layers. It is shown by Lazaridis and Drossinos (1998) that for a geometrical arrangement of deposited particles with a coordination number of 2 (particles stacked on top of each other), particles from the top layers resuspend at lower friction velocities than particles adjacent to the surface.
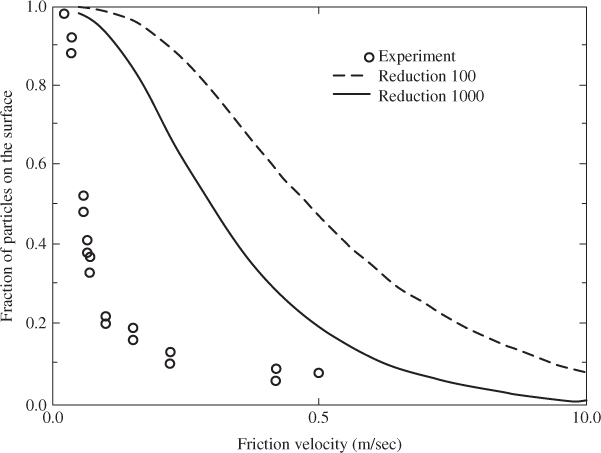
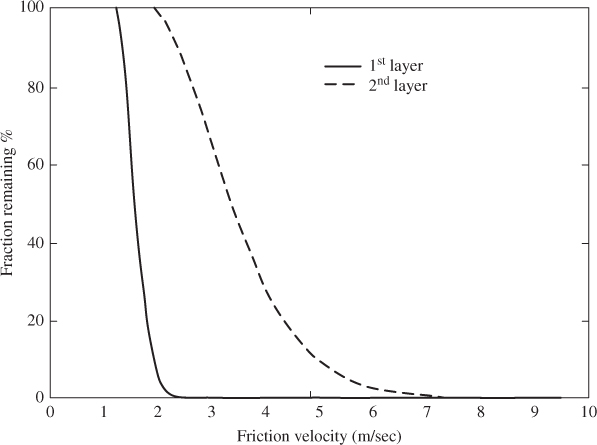
Simulation results for a two-layer deposit of SnO2 particles of radius 10 µm are shown in Figure 2.7 as function of friction velocity. Top-layer particles detach faster than particles in layers below (and, in particular, in the second layer). Results from Lazaridis and Drossinos (1998) suggest that the fraction of particles remaining in a given layer decays algebraically with time due to resuspension induced by the turbulent flow.
Figure 2.7 Percentage of SnO2 particles that remain on a stainless-steel surface versus friction velocity for a two-layer deposit (rp = 10 µm, t = 1 s). Adapted with permission from Lazaridis and Drossinos (1998). Copyright © 1998, Taylor and Francis.
References
Becker, R. and Döring, W. (1935) Kinetische behandlung der keimbildung übersättigten dampfen. Annalen der Physik (Leipzig), 24, 719.
Colbeck, I. (1998) Introduction to aerosol science, in Physical and Chemical Properties of Aerosols (ed. I. Colbeck), Blackie Academic & Professional and Chapman & Hall, London.
Colbeck, I. and Lazaridis, M. (2010) Aerosols and environmental pollution. Naturwissenschaften, 97, 117–131.
Debenedetti, P.G. (1996) Metastable Liquids: Concepts and Principles, Princeton University Press, Princeton, NJ.
Drossinos, Y. and Housiadas, C. (2006). Aerosol flows. In Multiphase Flow Handbook, (ed. C.T. Crowne), CRC Press, Boca Raton, FL, pp. 6-1–6-58.
Finlayson Pitts, B.J. and Pitts, J.N. (2000) Chemistry of the Upper and Lower Atmosphere, Academic Press, San Diego, CA.
Forrest, S.R. and Witten, T.A. (1979) Long-range correlations in smoke-particle aggregation. Journal of Physics A: Mathematical and General, 12, L109–L117.
Friedlander, S.K. (2000) Smoke, Dust, and Haze: Fundamentals of Aerosol Dynamics, 2nd edn, Oxford University Press, New York.
Friess, H. and Yadigaroglu, G. (2001) A generic model for the resuspension of multilayer aerosol deposits by turbulent flow. Nuclear Science and Engineering, 138, 161–176.
Fuchs, N.A. (1964) The Mechanics of Aerosols, Dover Publication, New York.
Giechaskiel, B., Wang, X., Gilliland, D. and Drossinos, Y. (2011) The effect of particle chemical composition on the activation probability in n-butanol condensation particle counters. Journal of Aerosol Science, 42, 20–37.
Hall, D. (1994) Nuclear Electric Report RPTG/P(93) 11.
Heinson, W.R., Sorensen, C.M. and Chakrabarti, A. (2012) A three parameter description of the structure of diffusion limited cluster fractal aggregates. Journal of Colloid and Interface Science, 375, 65–69.
Hinds, W.C. (1999) Aerosol Technology, Wiley-Inter Science, New York.
Housiadas, C. and Lazaridis, M. (2010) Inhalation dosimetry modeling, in The Book Human Exposure to Pollutants via Dermal Absorption and Inhalation (eds M. Lazaridis and I. Colbeck), Springer.
International Commission on Radiological Protection (1994) Human Respiratory Tract Model for Radiological Protection, Annals of the ICRP, Vol. 24 (4), ICRP Publication 66, Pergamon, Oxford, p. 482 p.
Isella, L. and Drossinos, Y. (2011) On the friction coefficient of straight-chain aggregates. Journal of Colloid and Interface Science, 356, 505–512.
Kevrekidis, P.G., Lazaridis, M., Drossinos, Y. and Georgopoulos, P.G. (1999) A unified kinetic approach to binary nucleation. Journal of Chemical Physics, 111, 8010–8012.
Kirkwood, J.G. and Riseman, J. (1948) The intrinsic viscosities and diffusion constants of flexible macromolecules in solution. Journal of Chemical Physics, 16, 565–573.
Kulmala, M., Vehkamaki, H., Petajä, T. et al. (2004) Formation and growth rates of ultrafine atmospheric particles: a review of observations. Journal of Aerosol Science, 35, 143–176.
Langer, J.S. (1969) Statistical theory of the decay of metastable states. Annals of Physics, 54, 258–275.
Lattuada, M., Wu, H. and Morbidelli, M. (2003a) Hydrodynamic radius of fractal clusters. Journal of Colloid and Interface Science, 368, 96–105.
Lattuada, M., Wu, H. and Morbidelli, M. (2003b) A simple model for the structure of fractal aggregates. Journal of Colloid and Interface Science, 368, 106–120.
Lazaridis, M. (2011) First Principles of Meteorology and Air Pollution, Springer, Dordrecht.
Lazaridis, M. and Drossinos, Y. (1997) Energy fluctuations in steady-state binary nucleation. Journal of Physics A: Mathematical and General, 30, 3847.
Lazaridis, M. and Drossinos, Y. (1998) Multilayer resuspension of small particles by turbulent flow. Aerosol Science and Technology, 28, 548–560.
Lazaridis, M., Drossinos, Y. and Georgopoulos, P.G. (1998) Turbulent resuspension of small non-deformable particles. Journal of Colloid and Interface Science, 204, 24–32.
Lazaridis, M., Dzumbova, L., Kopanakis, I. et al. (2008) PM10 and PM2.5 levels in the Eastern Mediterranean (Akrotiri research station, Crete, Greece). Water, Air, and Soil Pollution, 189, 85–101.
Lazaridis, M., Kulmala, M. and Laaksonen, A. (1991) Binary heterogeneous nucleation of a water-sulphuric acid system: the effect of hydrate interaction. Journal of Aerosol Science, 22, 823–830.
Leighton, D. and Acrivos, A. (1985) The lift on a small sphere touching a plane in the presence of a simple shear flow. Zeitschrift fur Angewandte Mathematik und Physik, 36, 174–178.
Melas, A.D., Isella, L., Konstandopoulos, A.G. and Drossinos, Y. (2013) Morphology and mobility of synthetic colloidal aggregates, Journal of Colloid and Interface Science (in press).
Reeks, M.W., Reed, J. and Hall, D. (1988) On the resuspension of small particles by a turbulent flow. Journal of Physics D: Applied Physics, 21, 574.
Ruzer, L.S. and Harley, N.H. (2005) Aerosol Handbook: Measurement, Dosimetry, and Health effects (eds.), CRC Press, Boca Raton, FL.
Seinfeld, J.H. and Pandis, S.N. (2006) Atmospheric Chemistry and Physics: From Air Pollution to Climate Change, 2nd edn, John Wiley & Sons, Inc., Hoboken, NJ.
Smoluchowski, M. (1916) Drei vortrage uber diffusion, Brownsche molekularbewegung und koagulation von kolloidteilchen. Physik Zeits, 17, 557.
Sorensen, C.M. (2011) The mobility of fractal aggregates: a review. Aerosol Science and Technology, 45, 755–769.
Stauffer, D. (1976) Kinetic theory of two-component (“hetero-molecular”) nucleation and condensation. Journal of Aerosol Science, 7(4), 319–333.
Thajudeen, T., Gopalakrishnan, R. and Hogan, C.J. Jr. (2012) The collision rate of nonspherical particles and aggregates for all diffusive Knudsen numbers. Aerosol Science and Technology, 46, 1174–1186.
Williams, M.M.R. and Loyalka, S.K. (1991) Aerosol Science: Theory and Practice: With Special Applications to the Nuclear Industry, Pergamon, Oxford.
Wu, M.K. and Friedlander, S.K. (1993) Note on the power law equation for fractal-like aerosol agglomerates. Journal of Aerosol Science, 159, 246–248.
Zeldovich, Y.B. (1942) On the theory of new phase formation: cavitation. Journal of Experimental and Theoretical Physics, 12, 525.(Translated in Ostriker, J.P., Barenblatt, G.I. and Sunayev, R.A. (eds) (1992) Selected works of Yakov Borisovich Zeldovich, Chemical Physics and Hydrodynamics,Vol. 1, Princeton University Press, Princeton, p. 120.)
Ziskind, G., Fichman, M. and Gutfinger, C. (1995) Resuspension of particulates from surfaces to turbulent flows-review and analysis. Journal of Aerosol Science, 26, 613.
1 The mean free gaseous path λ is defined as the mean distance of a molecule transport between two sequential impacts. Under standard ambient temperature and pressure conditions, the air mean free path is approximately 66 nm.