
Chapter 5
ASSET AND LIABILITY MANAGEMENT I
Asset–liability management (ALM) is a generic term that is used to refer to a number of things by different market participants. For bankers, the term is used to denote high-level management of a bank’s assets and liabilities; as such it is a strategy level discipline but at the business line level it is also a tactical one. ALM policy may be set within a bank’s Treasury division or more usually by its asset–liability committee (ALCO). The principle function of the ALM desk is to manage interest rate risk and liquidity risk. It will also set overall policy for credit risk and credit risk management, although tactical level credit policy is set at a lower level within credit committees. Although the basic tenets of ALM would seem to apply more to commercial banking than investment banking, in reality it is important that it is applied to both functions. A trading desk still deals in assets and liabilities, and these must be managed for interest rate risk and liquidity risk. In a properly integrated banking function the ALM desk will have a remit covering all aspects of a bank’s operations.
We describe the ALM function in this chapter and Chapters 6 and 7. In this chapter we introduce the key ALM concepts of liquidity and ALM policy.
Basic concepts
In financial markets the two main strands of risk management are interest rate risk and liquidity risk. ALM practice is concerned with managing this risk. Interest rate risk exists in two strands. The first strand is the more obvious one: the risk of changes in asset–liability value due to changes in interest rates. Such a change impacts the cashflows of assets and liabilities as well as their present value, because financial instruments are valued with reference to market interest rates. The second strand is that associated with optionality, which arises with products such as early-redeemable loans. The other main type of risk that ALM seeks to manage is liquidity risk, which refers to both the liquidity of markets and the ease with which assets can be translated to cash.
ALM is conducted primarily at an overview, balance sheet level. The risk that is managed is an aggregate, group level risk. This makes sense because one could not manage a viable banking business by leaving interest rate and liquidity risk management at individual operating levels. We illustrate this at Figure 5.1, which illustrates the cornerstones of ALM. Essentially, interest rate risk exposure is managed at the group level by the Treasury desk. The drivers are the different currency interest rates, with each exposure being made up of the net present value (NPV) of cashflow as it changes with changes in interest rates. The discount rate used to calculate NPV is the prevailing market rate for each time bucket in the term structure.
Figure 5.1 Cornerstone of ALM philosophy.
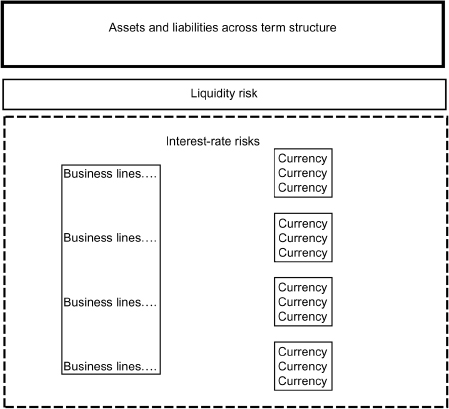
Interest rate exposure arises because rates fluctuate from day to day, and continuously over time. The primary risk is that of interest rate reset for floating rate assets and liabilities. The secondary risk is liquidity risk: unless assets and liabilities are matched by amount and term, assets must be funded on a continuous rolling basis. Equally, the receipt of funds must be placed on a continuous basis. Whether an asset carries a fixed or floating rate reset will determine its exposure to interest rate fluctuations. Where an asset is marked at a fixed rate, a rise in rates will reduce its NPV and so reduce its value to the bank. This is intuitively easy to grasp, even without recourse to financial arithmetic, because we can see that the asset is now paying a below-market rate of interest. Or we can think of it as a loss due to opportunity cost foregone, since the assets are earning below what they could earn if they were employed elsewhere in the market. The opposite applies if there is a fall in rates: this causes the NPV of the asset to rise. For assets marked at a floating rate of interest, the exposure to fluctuating rates is much less, because the rate receivable on the asset will reset at periodic intervals, which will allow for changes in market rates.
We speak of risk exposure as being for the group as a whole. This exposure must therefore aggregate the net risk of all the bank’s operating business. Even for the simplest banking operation, we can see that this will produce a net mismatch between assets and liabilities, because different business lines will have differing objectives for their individual books. This mismatch will manifest itself in two ways:
- the mismatch between the different terms of assets and liabilities across the term structure;
- the mismatch between the different interest rates that each asset or liability contract has been struck at.
This mismatch is known as the ALM gap. The first type is referred to as the liquidity gap, while the second is known as the interest rate gap. We value assets and liabilities at their NPV; hence, we can measure the overall sensitivity of balance sheet NPV to changes in interest rates. As such, then, ALM is an art that encompasses aggregate balance sheet risk management at the group level.
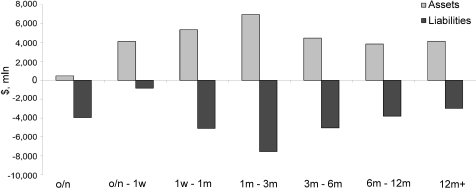
Figure 5.2 shows the aggregate group level ALM profile for a derivatives trading house based in London. There is a slight term mismatch as no assets are deemed to have ‘overnight’ maturity whereas a significant portion of funding (liabilities) is in the overnight term. One thing we do not know from looking at Figure 5.2 is how this particular institution defines the maturity of its assets. To place them in the relevant maturity buckets, one can adopt one of two approaches, namely:
Figure 5.2 A derivatives trading houses ALM profile.
- actual duration of the assets;
- ‘liquidity duration’, which is the estimated time it would take the firm to dispose of its assets in an enforced or ‘firesale’ situation, such as a withdrawal from business.
Each approach has its adherents; there is no single ‘right’ way. It is up to the individual institution to adopt one method and then consistently adhere to it. The second approach has the disadvantage, however, of being inherently subjective – estimating the time taken to dispose of an asset book is not an exact science and is little more than educated guesswork. Nevertheless, for long-dated and/or illiquid assets, it is at least a workable method that enables practitioners to work around a specified ALM framework with regard to structuring the liability profile.
Liquidity gap
There is clearly risk exposure as a result of liquidity mismatches between assets and liabilities. Maturity terms will not match, thereby creating a liquidity gap. The amount of assets and liabilities maturing at any one time will also not match (although overall, by definition, assets must equal liabilities). Liquidity risk is the risk that a bank will not be able to refinance assets as liabilities become due, for any reason.1 To manage this, the bank will hold a large portion of assets in very liquid form.2 A surplus of assets over liabilities creates a funding requirement. If there is a surplus of liabilities, the bank will need to find efficient uses for these funds. In either case, the bank has a liquidity gap. This liquidity can be projected over time, so that one knows what the situation is each morning, based on net expiring assets and liabilities. The projection will change daily, of course, due to the new business undertaken each day.
We could eliminate liquidity gap risk by matching assets and liabilities across each time bucket. Actually, at the individual loan level this is a popular strategy: if we can invest in an asset paying 5.50% for 3 months and fund this with a 3-month loan costing 5.00%, we have locked in a 50bp gain that is interest rate risk free. However, while such an approach can be undertaken at the individual asset level, it would not be possible at the aggregate level, or at least not possible without imposing severe restrictions on the business. Hence, liquidity risk is a key consideration in ALM. A bank with a surplus of long-term assets over short-term liabilities will have an ongoing requirement to fund the assets continuously, and there is the ever-present risk that funds may not be available as and when they are required. The concept of a future funding requirement is itself a driver of interest rate risk, because the bank will not know the future interest rates at which it will deal.3 So a key part of ALM involves managing and hedging this forward liquidity risk.
Definition and illustration
To reiterate then, the liquidity gap is the difference in maturity between assets and liabilities at each point along the term structure. Because ALM in many banks concerns itself with medium-term management of risk, this will not be beyond a 5-year horizon – in many cases considerably less than this. Note from Figure 5.2 how the longest dated time bucket in the ALM profile extended out to only ‘12 months’, hence all liabilities longer than 1 year were grouped in one time bucket. This recognizes the fact that most liabilities are shorter than 1 year, although a proportion of funding will be longer term – an average of 5 years or so.
For each point along the term structure at which a gap exists, there is (liquidity) gap risk exposure. This is the risk that funds cannot be raised as required, or that the rate payable on these funds is prohibitive.4 To manage this risk, a bank must
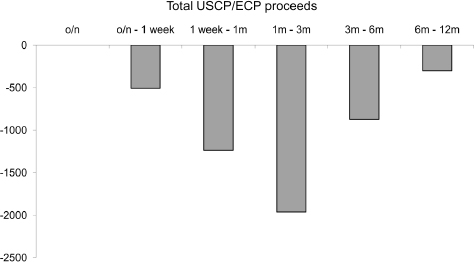
- disperse the funding profile (the liability profile) over more than just a short period of time. For example, it would be excessively risky to concentrate funding in just the overnight to 1-week time bucket, so a bank will spread the profile across a number of time buckets. Figure 5.3 shows the liability profile for a European multi-currency asset-backed commercial paper programme, with liabilities extending from 1 month to 1 year;
- manage expectations such that large-size funding requirements are diarized well in advance – not planned for times of low liquidity such as the Christmas and New Year period;
- hold a significant proportion of assets in the form of very liquid instruments such as very-short-term cash loans, Treasury bills and high-quality short-term bank certificates of deposit (CDs).
Figure 5.3 Commercial paper programme liability profile.
Following these guidelines leads to a reserve of liquidity that can be turned into cash at very short notice in the event of a funding crisis.
The size of the liquidity gap at any one instant is never more than a snapshot in time, because it is constantly changing as new commitments are entered into on both the asset and liability size. For this reason some writers speak of a ‘static’ gap and a ‘dynamic’ gap, but in practice one recognizes that there is only ever a dynamic gap, because the position changes daily. Hence, we will refer only to a liquidity gap.
A further definition is the ‘marginal’ gap, which is the difference between the change in assets and liabilities during a specified time period. This is also known as the ‘incremental’ gap. If the change in assets is greater than the change in liabilities, this is a positive marginal gap, while if the opposite applies it is a negative marginal gap.5
We illustrate these values in Table 5.1. This is a simplified asset–liability profile from a regional European bank, showing gap and marginal gap at each time period. Note that liabilities have been structured to produce an ‘ALM smile’, which is recognized as following prudent business practice. Generally, no more than 20% of total funding should be in the overnight to 1-week time bucket – similarly for the 9-to-12-month bucket. The marginal gap is measured as the difference between the change in assets and liabilities from one period to the next.
Table 5.1 Simplified ALM profile for regional European bank.

Figure 5.4 shows the graphical profile of the numbers in Table 5.1.
Figure 5.4 ALM time profile.

Liquidity risk
Liquidity risk exposure arises from normal banking operations. That is, it exists irrespective of the type of funding gap, be it excess assets over liabilities for any particular time bucket or an excess of liabilities over assets. In other words, there is a funding risk in any case: either funds must be obtained or surplus assets laid off. The liquidity risk in itself generates interest rate risk as a result of uncertainty about future interest rates. This can be managed through interest rate hedging, which was discussed in Chapter 4.
If assets are floating rate, there is less concern over interest rate risk because of the nature of interest rate reset. This also applies to floating rate liabilities, but only in so far as they match floating rate assets. Floating rate liabilities issued to fund fixed rate assets create forward risk exposure to rising interest rates. Note that even if both assets and liabilities are floating rate, they can still generate interest rate risk. For example, if assets pay 6-month Libor and liabilities pay 3-month Libor, there is an interest rate spread risk between the two terms. Such an arrangement has eliminated liquidity risk, but not interest rate spread risk.
Liquidity risk can be managed by matching assets and liabilities, or by setting a series of rolling term loans to fund a long-dated asset. Generally, however, banks have a particular view of future market conditions and manage the ALM book in line with this view. This would leave in place a certain level of liquidity risk.
Matched book
The simplest way to manage liquidity and interest rate risk is the matched book approach, also known as cashflow matching. This is actually very rare to observe in practice, even among conservative institutions such as the smaller UK building societies. In the matched book approach, assets and liabilities as well as their time profiles are matched as closely as possible. This includes allowing for amortization of assets.6 As well as matching maturities and time profiles, the interest rate basis for both assets and liabilities will be matched. That is, fixed loans to fund fixed rate assets and the same for floating rate assets and liabilities. Floating rate instruments will further need to match the period of each interest rate reset to eliminate spread risk.
Under a matched book, there is theoretically no liquidity gap. Locking in terms and interest rate bases will also lock in profit. For instance, a 6-month fixed rate loan is funded by a 6-month fixed rate deposit. This would eliminate both liquidity and interest rate risk. In a customer-focused business it will not be possible to precisely match assets and liabilities, but from a macro-level it should be possible to match the profiles fairly closely, by netting total exposure on both sides and matching this. Of course, it may not be desirable to run a matched book, as this would mean the ALM book was not taking any view at all on the path of future interest rates. Hence, a part of the book is usually left unmatched, and this is the part that will benefit (or lose out) if rates go the way they are expected (or not!).
Managing the gap with undated assets and liabilities
We have described a scenario of liquidity management where the maturity date of both assets and liabilities is known with certainty. However, a large part of retail and commercial banking operations revolves around assets that do not have an explicit maturity date. These include current account overdrafts and credit card balances. They also include drawn and undrawn lines of credit. The volume of these is a function of general economic conditions, and can be difficult to predict. Banks will need to be familiar with their clients’ behaviour and their requirements over time to be able to assess when and for how long these assets will be utilized.
Undated assets are balanced on the other side by undated liabilities, such as non-interest-bearing liabilities (NIBLs) which include cheque accounts and instant access deposit accounts. The latter frequently attract very low rates of interest – hence, they can be included in the NIBL total. Undated liabilities are treated in different ways by banks; the most common treatment places these funds in the shortest time bucket, the overnight to 1-week bucket. However, this means a bank’s gap and liquidity profile can be highly volatile and unpredictable, which places greater strain on ALM management. For this reason some banks take the opposite approach and place these funds in the longest dated bucket, the 12-month bucket. A third approach is to split total undated liabilities into a ‘core’ balance and an ‘unstable’ balance, and place the first in the long-date bucket and the second in the shortest dated bucket. The amount recognized as the core balance will need to be analysed over time to make sure it is accurate.
Managing liquidity
Managing liquidity gaps and the liquidity process is both continuous and dynamic because the ALM profile of a bank changes on a daily basis. Liquidity management is the term used to describe this continuous process of raising and laying off funds, depending on whether one is long or short cash that day.
The basis premise is a simple one: the bank must be ‘squared off’ by the end of each day, which means ensuring the net cash position is zero. Thus, liquidity management is both very short term as well as projected over the long term, because every position put on today creates a funding requirement in the future on its maturity date. The ALM desk must be aware of its future funding or excess cash positions and act accordingly, whether this means raising funds now or hedging forward interest rate risk.
The basic case: the funding gap
A funding requirement is dealt with on the day it occurs. The decision on how it will be treated will factor the term that is put on – it has also to allow for any new assets put on that day. As funding is arranged, the gap on that day will be zero. The next day there will be a new funding requirement or a surplus depending on the net position of the book.
This is illustrated in Figure 5.5. Starting from a flat position on the first day (t0) we observe a gap (the dotted line) on which is closed by putting on funding to match the asset maturity. The amount of funding to raise and the term for it to run will take into account the future gap as well as that day’s banking activities. So, at we observe a funding excess, which is then laid off. We see at that invested assets run beyond the maturity of the liabilities at, so we have a funding requirement again at. The decision on the term and amount will be based on the market view of the ALM desk. A matched book approach may well be taken where the desk does not have a strong view or if its view is at odds with market consensus.
Figure 5.5 Funding position on a daily basis.

There are also external factors to take into account. For instance, the availability of funds in the market may be limited, due to both macro-level issues and to the bank’s own ability to raise funds. The former might be during times of market correction or recession (a ‘credit crunch’), while the latter might include the bank’s credit lines with market counterparties. Moreover, some funds will have been raised in the capital markets and this cash will cover part of the funding requirement. In addition, the ALM desk must consider the cost of the funds it is borrowing – for example, if it thought that interest rates in the short term, or for short-term periods, was going to fall, it might cover the gap with only short-term funds so that it can then refinance at expected lower rates. The opposite might be done if the desk thought rates would rise in the near future.
Running a liquidity gap over time, beyond customer requirements, would reflect a particular view of the ALM desk. So, maintaining a consistently underfunded position suggests that interest rates are expected to decline, and so longer term funds can be taken at cost. Maintaining an overfunded gap would imply that the bank thinks rates will be rising, and so longer term funds are locked in now at lower interest rates. Even if the net position is dictated by customer requirements – for example, customers placing more on deposit than they take out in loans – the bank can still manage the resultant gap in the wholesale market.
Generally, excess liabilities at a bank are a rare occurrence and, under most circumstances, such a position is clearly undesirable. This is because the bank will have to achieve target return on capital ratios, and this requires funds to be put to work, so to speak, by acquiring assets. In the case of equity capital it is imperative that these funds are properly employed.7 The exact structure of the asset book will depend on the bank’s view on interest rates and the yield curve generally. The shape of the yield curve and expectations on this will also influence the structure and tenor of the asset book. The common practice is to spread assets across the term structure, with varying maturities. There will also be investments made with a forward start date, to lock in rates in the forward curve now. Equally, some investments will be made for very short periods so that if interest rates rise, when the funds are reinvested they will benefit from the higher rates.
The basic case: illustration
The basic case is illustrated in Table 5.2 in two scenarios. In the first scenario, the longest dated gap is 130, so the bank puts on funding for 130 to match this tenor of three periods. The gap at period is 410, so this is matched with a two-period tenor-funding position of 280. This leaves a gap of 180 at period which is then funded with a single-period loan. The net position is zero at each period (‘squared off’), and the book has been funded by three bullet fixed-term loans. The position is not a matched book as such although there is now no liquidity risk exposure.
Table 5.2 Funding the liquidity gap: two examples.

In the second case, the gap increases from Period 1 to Period 2. The first period is funded by a three-period and a two-period borrow of 50 and 200, respectively. The gap at needs to be funded by a position that is not needed now. The bank can cover this with a forward start loan of 390 at or can wait and act at. If it does the latter it may still wish to hedge the interest rate exposure.8
The liquidity ratio
The liquidity ratio is the ratio of assets to liabilities. It is a short-term ratio that is up to 1 year, usually calculated for the money market term only. Under most circumstances, and certainly under a positive yield curve environment, it would be expected to be above 1.00; however, this is less common at the very short end because the average tenor of assets is often greater than the average tenor of liabilities. So, in the 1-month to 3-month tenor period – and perhaps out to the 6-month tenor – the ratio may well be less than 1. This reflects the fact that short-term borrowing is used to fund longer term assets.
A ratio significantly below 1 is inefficient from an ROE point of view. It represents an opportunity cost of return foregone. To manage it, banks may invest more funds in the very short term, but this also presents its own problems because return on these assets may not be sufficient. This is especially true in a positive yield curve environment. This is one scenario where a matched book approach will be prudent, because the bank should be able to lock in a bid–offer spread at the very short end of the yield curve.9 A more risky approach would be to lend in the short term and fund them in the long term, but this would create problems because the term premium in the yield curve will make borrowing in the long term expensive relative to the return on short-dated assets (unless we have an inverted yield curve). There is also the liquidity risk associated with the more frequent rolling over of assets than liabilities. We see then, that maintaining the liquidity ratio carries something of a cost for banks.
The liquidity portfolio
The basic business of banking is maturity transformation; this is the practice of lending long-dated assets that are funded by shorter dated liabilities. This is to be expected: a bank that lends 25-year money to a customer in the form of a retail mortgage would not expect and, indeed would not aim, to fund the asset with a borrowing of 25-year money. The business of banking assumes therefore the availability of continuous funding capability, or liquidity. To provide risk mitigation for the times when liquidity conditions deteriorate – the time period after the bankruptcy of Lehman Brothers in September 2008 is the best example – banks maintain a portfolio of liquid assets. This is sometimes known as the ‘liquid asset buffer’ and is typically made up of AAA-rated government bonds.
Prior to the Lehman collapse, some banks had stopped following market best practice and had ceased to maintain a liquid portfolio of government bonds (which, being credit-risk-free assets, pay the lowest RoC), or had constructed the liquid portfolio out of bank-issued certificates of deposit (CDs) and floating rate notes (FRNs). However, these assets were shown to suffer from poor liquidity under the market crisis conditions that prevailed between October and December 2008, so business best practice philosophy has since changed and banks now maintain a government bond liquidity portfolio.
Example 5.1 Hypothetical bank (XYZ Securities) sovereign bond portfolio for repo and interest rate hedging
The Treasury desk maintains a liquidity book of US Treasury, German bund and UK gilts. This is also used to facilitate a repo business and reduce the quantity of interest rate futures needed as part of the interest rate exposure hedge.
Description of the product/business activity
XYZ’s Treasury desk is required to fund a large part of the firm-wide funding requirement in term loans, as part of prudent asset–liability management. The resulting DV01 (dollar-value of loss for a 1bp rise in yields) exposure is managed using Eurodollar futures. It has also established a US government bond portfolio as a lower cost means of managing DV01 risk. The objective is to manage the DV01 exposure of the Treasury book by buying very short-dated Treasury notes and strips, which sets up an income stream that is diversified from other sources and that represents zero credit risk. This is achieved by
- Establishing a portfolio of very-short-dated US Treasuries and Treasury strips on the balance sheet (maximum maturity recommended 1–1.5 years, the majority in 3 to 6 months). The composition of the book at May 2005 is
 200 million 3 month
- 300 million 6 month
- 50 million 1 year.
- the average maturity of the portfolio in the first year is to be around 6 months.
- Funding these in Treasury repo under the standard GMRA.10
- Holding Treasury securities and Treasury strips to maturity to generate a steady income stream. With ultra-short-dated strips, this also benefits from the pull-to-par effect on mark to market.
All funding is locked in to maturity, thus there is no gap risk.
Objectives of the business
The sovereign bond book is business that
- allows XYZ to undertake cheaper hedging of its interest rate risk (DV01), complementing the current arrangement using Eurodollar and 90-day money futures;
- establishes a risk-free portfolio that generates a funding gain for XYZ;
- enables XYZ to use a AAA risk-free portfolio for use in setting up total return swap (TRS) and repo lines with market counterparties.
The benefits to XYZ of holding such a portfolio include
- earning the spread between yield and funding cost; a bonus that is not available when using Eurodollar futures for DV01 hedging, which do not earn any income. XYZ also saves on the commission and margin costs associated with maintaining Eurodollar futures positions;
- using the business to set up dealing relationships with bank counterparties that could then be used as sources of additional funding if required, adding to the diversity of funding (required as part of the Treasury desk’s remit);
- assisting the Treasury desk in undertaking ALM objectives through lower cost hedging of DV01 risk, compared with futures which impose a cost on the book.
Expected return
The fundamental gain is removal of the requirement to hold Eurodollar futures. In a rising interest rate environment, this will significantly reduce hedging costs.
Net profit in the first full year is upwards of a $250,000–$280,000 funding gain on a 350 million average position (10–12bp on average per trade). This does not take into account the mark-to-market profit that is realized on Treasury bonds and strips.
Capital and taxation issues
Treasury securities are 0% risk-weighted under Basel I (and II), except where they create DV01 risk when the charge is 0.7%. However, if held for interest-rate-risk-hedging purposes (as is the case here), they may actually reduce overall capital requirements.
Example 5.2 XYZ Securities’ sovereign bond portfolio for interest rate hedging: no lending business
This illustration mirrors that of Example 5.1, except we assume that the firm (XYZ Securities) has no lending operation. That is, its Treasury desk is not a true money market desk because it is only a borrower of funds; there is no lending of funds. In this case, the firm sets up a sovereign bond portfolio to reduce its risk-hedging costs. The following are real-world examples of two such portfolios of US Treasuries and UK gilts, used to hedge their USD and GBP term-funding books.
Background
As part of its key business function, XYZ Securities’ Treasury function maintains a large short cash position. It is not able to take the other side in the market, which would give it added flexibility in its dealing arrangements and ALM management, as well as more efficient mechanisms for interest rate risk hedging. This also means the Treasury desk is restricted in building counterparty relationships and funding source diversity.
In looking to diversify its business mix – to achieve cheaper interest rate risk management and a more active ALM approach – it maintains a portfolio of very short-dated US Treasury securities and Treasury strip (zero-coupon) bonds, funded in repo. This would be held to
- establish a risk-free portfolio that generates funding gain;
- allow cheaper hedging of interest rate risk (DV01) than an arrangement that uses Eurodollar futures;
- enables XYZ to use a AAA risk-free portfolio for use in setting up TRS and repo lines with market counterparties.
The benefits to XYZ of holding such a portfolio include
- earning the spread between yield and funding cost; a bonus that is not available when using Eurodollar futures for DV01 hedging, which do not earn any income;
- using the business to set up dealing relationships with bank counterparties which could then be used as sources of additional funding if required, adding to the diversity of funding (required as part of the Treasury desk’s remit);
- assisting the Treasury desk to undertake ALM objectives through lower cost hedging of DV01 risk, compared with futures which impose a cost on the book.
All funding will be locked in to maturity, thus there is no gaprisk.
Profitable risk-free trade example undertaken on 1 July 2004
Below are examples of funding trades that were put on in July 2004 that generated a risk-free funding gain – rates as at 1 July 2004 (data source: Lehman Brothers and Bloomberg LP). This shows where value was obtained from holding a book of Treasuries in the first instance. The following positions all yielded funding profit:
- Buy the 2% November 2004 Treasury at a yield of 1.597% and hold to maturity, and repo to maturity at a rate of 1.56%. This gives a locked-in gain of 3.97bp for the term to maturity on a position of USD150 million at a profit of USD24,800.
- Buy the 31 July 2004 strip at a yield of 1.568% and repo to maturity at 1.28%. This gives a spread of 28.8bp of risk-free locked-in funding. On a position of USD200 million this represents a positive P&L of USD48,000 – this is risk-free income.
- Take advantage of special rates for stocks we are long in. On 1 July, a position in 1% May 2005 Treasury could be funded cheaper than normal repo (general collateral or GC) by 7–8bp as a result of its special status. So the gain on holding that stock would be around this amount for the term of the trade, as our funding cost in repo would be lower by this amount. It would be an objective of the Treasury desk to be aware of stocks expected to go special and act accordingly.
Despite their infrequency these opportunities do occur as shown above. As the book will be primarily designed to hedge, trading is infrequent and only undertaken as opportunities arise.
Risks
There is no gap (funding) risk and no credit risk.
Just like the positions on a trading book – rather than a banking book – they will be marked-to-market. The desk expects volatility in short-dated government bonds to be lower than for the term loans they are hedging, but volatility is a risk exposure and there may be periods when the desk will experience mark-to-market losses.
Example 5.3 UK gilt portfolio
Commercial banks and building societies are natural holders of government bonds such as gilts. They do so for the following reasons:
- because gilts are the most liquid instruments in the UK market;
- as an instrument in which to invest the firm’s capital reserves;
- for income generation purposes, given the favourable funding costs of gilt repo as well as zero credit and liquidity risk;
- to intermediate between gilt, stock loans and interbank markets in CDs;
- to benefit from being long in gilts that go special and can be funded at anything from 25bp to 2% to 3% cheaper than GC repo;
- to establish an asset pool that receives favourable capital treatment (0% risk-weighted under Basel I and Basel II);
The benefits to XYZ of holding such a portfolio include some of the above, as well as the following:
- earning the spread between yield and funding cost;
- using the business to set up dealing relationships with bank counterparties that could then be used as sources of additional funding if required, adding to the diversity of funding (required as part of the Treasury desk’s remit);
- assisting the Treasury desk in undertaking ALM objectives.
Business line
A UK government bond portfolio at XYZ’s Treasury desk has the objective of maintaining an income stream that is diversified from current sources and that is also relatively low risk, but stable. This is achieved by
- Establishing a portfolio of very short-dated gilts and gilt strips on the balance sheet (maximum maturity recommended 1 year, the majority in 3 to 6 months). The expected makeup of the book might be
 125 million 3 months
- 200 million 6 months
- 25 million1 year
- the average maturity of the portfolio in the first year would be around 6 months.
- Funding these in gilt repo – under the GMRA agreement – and funding using TRS – under ISDA – if required. The repo-funding margin for gilts in the wholesale market is often 0%. With a zero or very low margin – that is, a haircut – all positions will be virtually fully funded.
- Holding gilts and gilt strips to maturity to generate a steady income stream. With ultra-short-dated strips, we also benefit from the pull-to-par effect.
Market rates
Table 5.3 shows income yields and funding rates as at 2 June 2004. This shows where value was obtained from holding a book of gilts in the first instance. For example, all the following positions yielded funding profit:
- Hold gilts and fund in GC; depending on the specific stock and the term of funding arranged, a gain ranging from 15bp to 50–60bp.
- Hold strips to maturity. For example, a gain of approximately 35bp for a Dec 04 principal strip at 1-week or 2-week funding; and a locked-in funding gain of 9bp for a Dec 04 strip (buy a 6-month strip and fund in 6 months) – this is risk-free income.
Table 5.3 Market rates as at 2 June 2004.
- Hold strips at 3-month, 6-month and 9-month maturities as longer dated bills and hold to maturity. Funding will be locked in if available or rolled.
- For example, as at 2 June 2004, XYZ purchased a Sep 04 coupon strip at 4.34% and funded in the 1-week term at 4.15% (and ran the resultant funding gap risk – but this gilt had a strong pull-to-par effect. If funding is no longer profitable in short dates, XYZ would have sold the gilt for a probable realized mark-to-market profit).
- Coupon strips are bid for in repo by the main market-makers, thereby reducing liquidity risk in these products.
- Take advantage of special rates for the stocks XYZ is long in. On 2 June 2004, a position in 9.5% 2005 gilt was funded cheaper as a result of its special status, from 35bp (down from 50bp the week before). The 6.75% 2004 gilt was being funded at 100bp cheaper than GC. So, the gain on holding that stock would be significant, as our funding cost in repo would be very low. It would be an objective of the Treasury desk to be aware of stocks expected to go special and act accordingly.
Risks
The principle risk is funding rollover (gap risk). Where possible we will lock in funding to match expected holding period of positions, but will also look to take advantage of market rates as appropriate and roll over funding. Gap risk will be managed in the normal way as part of overall Treasury operations. Gaps will be put on to reflect the interest rate and yield curve view of the desk.
There is no credit risk.
Interest rate risk and gap risk are managed as a standard banking ALM or cash book. The objective is to set up an income stream position at low risk, but if necessary DV01 risk would be managed where deemed necessary using 90-day sterling futures, OIS or short-dated swaps. XYZ can also sell out of positions where it expects significant market movement – for example, a central bank base rate hike. The main objective, however, is to establish an income stream, in line with a view on short-term interest rates. Hedging would only be carried out when necessary for short-term periods (say, ahead of a data release or anticipated high volatility).
As the positions would be on the trading book – not the banking book – they will be marked-to-market. The desk expects volatility in short-dated gilts to be considerably lower than for medium-dated and long-dated gilts, but volatility is a risk exposure and there may be periods when the desk will experience mark-to-market losses.
The interest rate risk for longer dated stocks is shown in Table 5.3, measured as DV01. Longer dated stocks expose the bank to a greater interest rate risk position when marking-to-market.
1 The reasons could be macro-level ones, affecting most or all market participants, or more firm specific or sector specific. The former might be a general market correction that causes the supply of funds to dry up, and would be a near-catastrophic situation. The latter is best illustrated with the example of Barings plc in 1995: when it went bust overnight due to large, hitherto concealed losses on the Simex exchange, the supply of credit to similar institutions was reduced or charged at much higher rates – albeit only temporarily – as a result.
2 Such assets would be very short-term, risk-free assets such as Treasury bills.
3 It can of course lock in future funding rates with forward-starting loans, which is one way to manage liquidity risk.
4 Of course, the opposite applies when the gap risk refers to an excess of liabilities over assets.
5 Note that this terminology is not universally held.
6 Many bank assets, such as residential mortgages and credit card loans, are repaid before their legal maturity date. Thus, the size of the asset book is constantly amortizing.
7 The bank’s capital will be invested in risk-free assets such as government T-bills or, in some cases, bank CDs. It will not be lent out in normal banking operations because the ALM desk will not want to put capital in a credit-risky investment.
8 We look at the mechanics of this, using different derivative instruments, in Chapter 4.
9 In addition, the bank should be able to raise funds at Libor, while it should be able to lend at Libor plus a spread in short-dated interbank credit quality assets.
10 See Chapter 2.