
5
Battery State-of-Charge Modeling for Solar PV Array Using Polynomial Regression
Siddhi Vinayak Pandey*, Jeet Patel and Harsh S. Dhiman
Dept. of Electrical Engineering, Adani Institute of Infrastructure Engineering, Ahmedabad, India
Abstract
Due to the increased demand of solar photovoltaic (PV) arrays, its integration with a battery and modeling of precise State of Charge (SoC) is a consequential parameter to understand the available battery capacity in real time domain. In this paper, the integration of solar PV array with the first-order RC circuit has been implemented utilizing the MATLAB (Simulink Library). For experimentation, the open-circuit voltage (Voc) and the short-circuit current (Isc) of the solar panel is considered as 36.3 volts and 7.84 amperes, respectively. The continuous fluctuating irradiance from 110,580 W/m2 leads in the variation of output voltage of the solar PV arrays. Also, the variations of battery charging current, voltage across battery, and battery SOC due to variations in irradiance are examined in detail. The proposed methodology of this manuscript explains the authentic time modeling of SoC utilizing the second, third, fourth, and fifth order of a polynomial regression technique. The comparative relationship between the OCV and SoC during the charging of the model with solar PV array has been also obtained for different orders of polynomials. Quantitatively, fifth-order model outperforms second, third, and fourth by 27.5%, 26.7%, and 21.3%, respectively.
Keywords: Battery, SoC, modeling, solar PV, kalman filter, regression, forecasting, capacity
5.1 Introduction
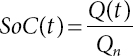
Sustainable energy sources lead to reduction in carbon footprint and thus increase the reliability of a system [1–4]. The State of Charge (SoC) is a parameter by which users can get details about the availability of battery capacity. The precise calculation and estimation of the available energy within a battery has always been a challenging task. Mathematically, SoC is a ratio of current capacity Q(t) to nominal capacity Qn given as
The precise calculation and modeling of the SoC will not only increases the system performance but also impacts cycle life in a longer run. Measurement and estimation of SoC remains one of the challenging tasks. SoC estimation is based on various sensor-based, filter-based, and data-driven techniques out of which Coulomb counting is the fundamental one. In [5], authors use Coulomb counting where current is integrated with respect to time. However, this method is inefficient due to the effect of temperature, discharge current, and cycle life of the battery. In order to overcome this, filter-based and data-driven estimation algorithms are utilized to estimate the SoC of the battery. In [6], authors use a Kalman Filter technique for SoC estimation. The Kalman filter is an estimator used to estimate the linear and nonlinear systems. Based on the present data of voltage, current, and temperature, it estimates the SoC with good accuracy and precision. While the estimation error of fully and partially charged battery is found to be around 0.5%. Apart from the Kalman filter, machine learning–based algorithms are also used to estimate the SoC of a battery. In [7], authors use a Support Vector Machine (SVM) approach, which is a statistical learning method used for estimating the SoC of a battery. The SoC of a Lithium Iron Manganese Phosphate (LiFeMnPO4) battery is estimated under the constant charging and variable load condition. The error in the proposed model is less than 4%, while the RMSE is 0.4% throughout the whole experiment. Apart from SVM, various other data-driven methods such as Neural Networks (NNs), Deep Neural Networks (DNNs), and Reinforcement Learning (RL) approach are used for the estimation of SoC.
Due to green gas emissions, the world is perpetually shifting toward renewable energy sources. Solar and wind energy being the pioneers in power portfolio. The on-field efficiency of solar panels is near about 18% to 21% [8]. However, due to the recent advancement in perovskite solar cells, reflectors, photonic crystals, and recycling photovoltaic (PV) cells, the efficiency of the solar cells is increasing drastically. Further, it is expected that, till 2030, the on-field efficiency of solar-based PV cells will be near about 30% [9].
Nowadays, the integration of solar PV arrays with batteries is gaining tremendous importance due to intermittency posed. Regarding this, many electric conveyances, grids, and space satellites are directly charging their batteries through solar PV arrays [10]. Mainly, two topologies exist for solar PV array with battery. The first one being stand-alone system, while the other being the grid-tied system. In the stand-alone system, solar PV is connected to the load via a battery. While in a grid-tied system, the load is supplied by a grid in case of failure in PV side [11].
In order to implement solar PV arrays in applications such as electric vehicles, space satellites, and drones, the weight of the module plays a very crucial role. The huge weight of solar panels can increase the overall payload capacity of the vehicles, and to overcome this, installation of thin-film crystalline–based solar panels is suggested. The thin-film crystalline–based solar cells are very light in weight. However, they are less efficient in their PV operation. Majority of the research is focused to enhance the efficiency of thin-film crystalline solar panels [12]. The selection of battery while implementing the solar PV arrays is also a consequential parameter for the efficient and vigorous performance of the system. In [13], authors discuss the case of LFP (Lithium Ion Phosphate) and LCO (Lithium Cobalt Oxide) batteries which, when tested at 45°C, observed an optimistic operation for the PV battery integrated module.
The energy generated through solar PV arrays is directly dependent on the irradiance and surface temperature of solar panels as variation in irradiance and surface temperature can impact power generation of the solar PV plant [14]. This type of change can directly affect the voltage and current level of the plant. Furthermore, this also impacts the SoC level of the interconnected battery. In [15], authors proposed a study based on the effect of variation in irradiance and surface temperature for solar PV arrays. In the proposed model, factors such as fill factor, efficiency, open-circuit voltage (OCV), and maximum power are the parameters get affected due to the variation in irradiance and surface temperature of a solar predicated PV arrays. The increment in irradiance increases the OCV and overall efficiency of the system. While increase in the surface temperature of the PV cell decreases the OCV, fill factor, efficiency, and a maximum power of a system. Apart from these factors, the construction of a battery is dependent upon the materials, modeling, and effect of the ageing mechanism during the real-time charging and discharging of a battery. Due to the escalating demand for energy storage systems, batteries play an important role in storing bulk power. As a matter of fact, an elevated research is going on in the field of eco-friendly–based battery material that gets recycled easily. Variants such as Lead acid, Nickel, Lithium, Cadmium, alkaline, Mercury, and Nickel Metal Hydride are toxic elements often used in fabrication process. A summary of the methods for estimating the SoC of a battery, dynamic battery modeling, and ageing mechanism of Li-ion battery is depicted in Table 5.1.
Table 5.1 Brief summary of current research in battery energy storage systems.
| SoC estimation [16] | Dynamic battery modeling [17] | Ageing mechanism [18] |
|---|---|---|
|
|
|
|
|
|
|
| Almost all positive electrodes are made up of carbon. An SEI (solid electrolyte interface) layer is formed and diminished during the charging and discharging process of the battery. |
In this manuscript, the first-order RC circuit is implemented under the variation of irradiance on the solar PV array. The variation of SoC during the charging of a battery has been obtained using the Kalman Filter technique, and based on the charging response of a first-order model, the second, third, fourth, and fifth degree of polynomial regression technique is used to obtain the relationship between OCV and SoC. The comparative analysis of regression between the OCV and SoC at different degrees of the polynomial is investigated in detail.
The remainder of the manuscript is organized as follows. Section 5.2 describes the simulation setup of our proposed methodology. Section 5.3 gives insights about modeling, comparisons of regression techniques and results of our proposed methodology. While the conclusions and references are presented in Section 5.4.
5.2 Dynamic Battery Modeling
In order to simulate the dynamic characteristics of a battery, the values of an input voltage source, resistor, and capacitor play an important role [19]. In this manuscript, the first-order RC model has been used to store the energy generated by the solar PV array. Given the simulation setup, the dynamic first-order model of the battery is illustrated in Figure 5.1.
In Figure 5.1, the terms Voc and Vbatt are OCV and terminal voltage, R0 is the internal resistance, while R1 and C1 are the external polarizing resistor and capacitance of the battery. During the operation, the capacitor gets energized and stores the energy which was supplied through voltage source (Vs). This dynamic model works in close approximation to the battery being used in real-time applications. Mathematically, charging of a capacitor with respect to time is given as
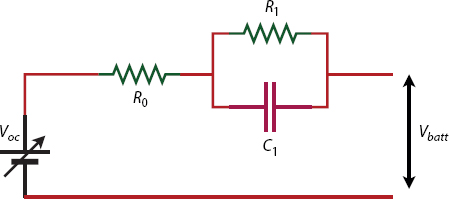
Figure 5.1 First-order battery model.
The terms Vbatt and i(t) in (5.2) and (5.3) represent voltage across and current through the capacitor. While the τ = R1C1 denotes the time constant of the model. This time constant requires five steps (five times constant) to charge the capacitor. During the charging conditions, the demeanor of the system remains exponential.
5.2.1 Proposed Methodology
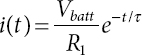
The proposed methodology of our experimental setup aims to determine the relationship between the SoC and OCV of a battery. The direct charging of a battery using the solar PV arrays under the variable irradiance and surface temperature of a PV cell is used to charge the battery. The proposed experimental setup is explained using the following block diagram.
The schematic block diagram in Figure 5.2 consists of basic blocks which are interconnected together to perform the intended task. The solar PV array is kept under the variable irradiance and temperature. The variability between irradiance and temperature affects the output voltage generation of a solar PV array. This variable voltage is directly stored in the battery.
The battery connected with solar PV array gets charged when a sophisticated amount of voltage generated across the solar PV array. The measurement block is interconnected with such sensors, which can measure the value of voltage, current, and temperature of a dynamic battery model during the charging condition. These measurements are clearly visible on the display screen, which is connected next to the measurement block. In order to estimate the SoC of a battery during the charging condition; the SoC estimator is used. In our case, the Kalman Filter is used for the SoC estimation of a battery during a direct charging condition with a solar PV array.
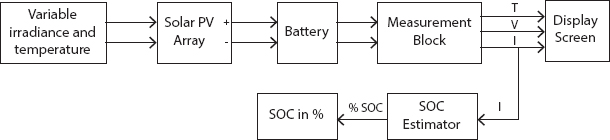
Figure 5.2 Block diagram for the simulation setup.
The Kalman Filter is a state estimator, used to estimate and track the data in the real-time domain. In our case, it takes the input current of a battery during the charging condition with a solar PV array for estimating the SoC of a battery in the real-time domain. The Kalman filter takes the state-space values and inputs current of a battery. Based on these data, it estimates the SoC of a battery. The mathematical representation of the Kalman filter [20] is as
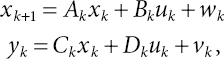
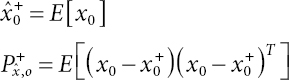
where Ak, Bk, Ck, and Dk represent state matrices of the first-order battery model. The term xk represents initial state (state vector), while yk is the set of observed data (observable at time k) in Kalman filter. During these estimations, it is required to know the noise of the initial system by which the filter received data for estimation. The term wk represents the process noise, and vk represents the measurement noise in a system. Due to modeling approximations and model integration errors, the process noise (wk) is a consequential parameter to include in a model. Initialization for, k = 0, set
State estimate time update given as
Error covariance time update
Kalman gain matrix
State estimate measurement update
Error covariance measurement update
The state space matrices for the first-order battery model are given as
5.3 Results and Discussion
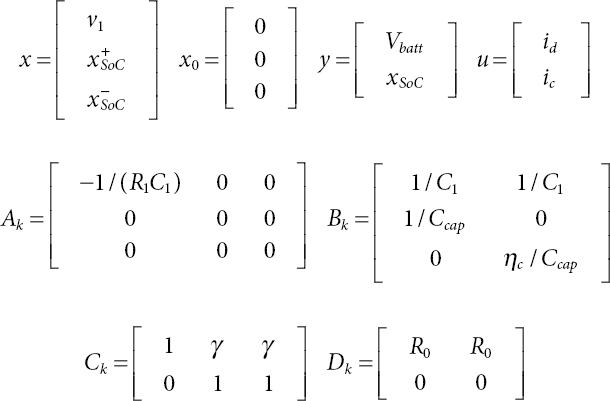
The entire simulation setup has is analyzed in MATLAB 2015b, core-i5 CPU environment. For simulation analysis, a “1Soltech 1STH-215-p Solar PV module” with the connection of 3 parallel and 1 series string has been utilized. The maximum power of the selected module is 213.15 W. The value of modeling parameters has been mentioned in Table 5.2, while the I-V and P-V characteristics of the PV array are illustrated in Figure 5.3.
Table 5.2 Model parameters for SoC estimation [20].
| Parameters | Values |
| R0 | 143 mΩ |
| R1 | 0.15 mΩ |
| C1 | 3.4kF |
| Ccap | 1,000 Ah |
| γ | 0.635V%SoC |
| ηc | 99% |
| Q | diag([5 0.1 0.1]) |
| R | diag([14 5]) |
Figure 5.3 I-V and P-V curve for solar PV array.
In order to replicate the practical scenario, the irradiance level for PV array is kept variable rather than a constant one. Figure 5.4 illustrates the solar irradiance (W/m2) for simulation environment considered in this analysis. The irradiance plot in Figure 5.4 is shown for first 6 seconds of the simulation, while Figure 5.5 depicts the curve fitting result for OCV-SoC based on second, third, fourth & fifth order polynomials.
It is evident that output voltage and current for solar PV array will vary due to the variation of irradiance. These variations directly affect the charging characteristics of our dynamic battery model. In this section, a relationship between voltage and SoC of a battery utilizing the polynomial regression approach is obtained. The curve fitting utilizing the polynomial regression technique engenders the values of the coefficient for the equations, which defines the relationship between the two curves given as an input. Polynomials of order second, third, fourth, and fifth degree are analyzed based on their R2 and RMSE values.
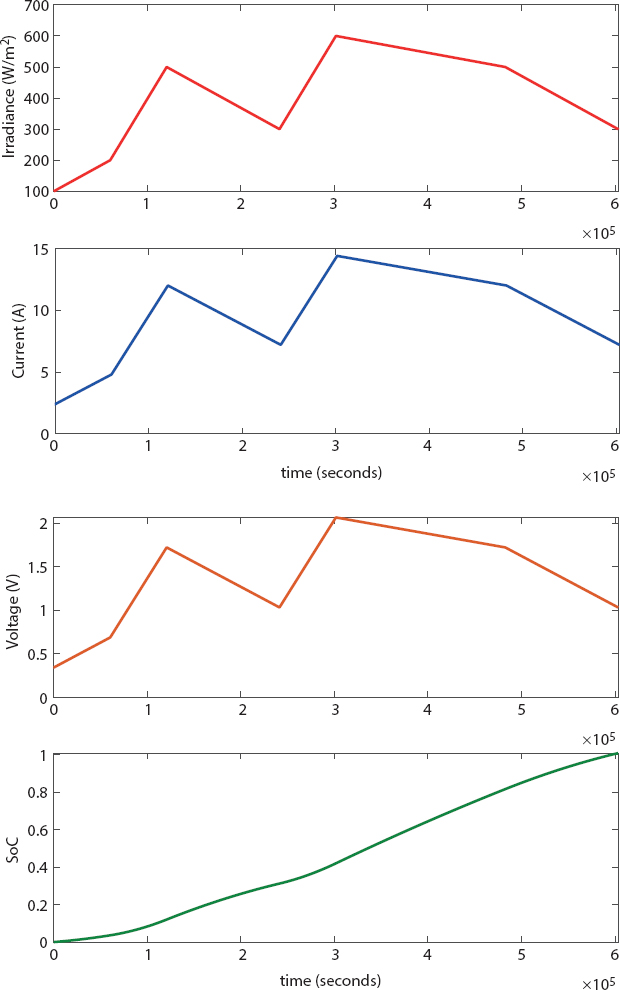
Figure 5.4 Irradiance, current, voltage, and SoC for the simulation setup.
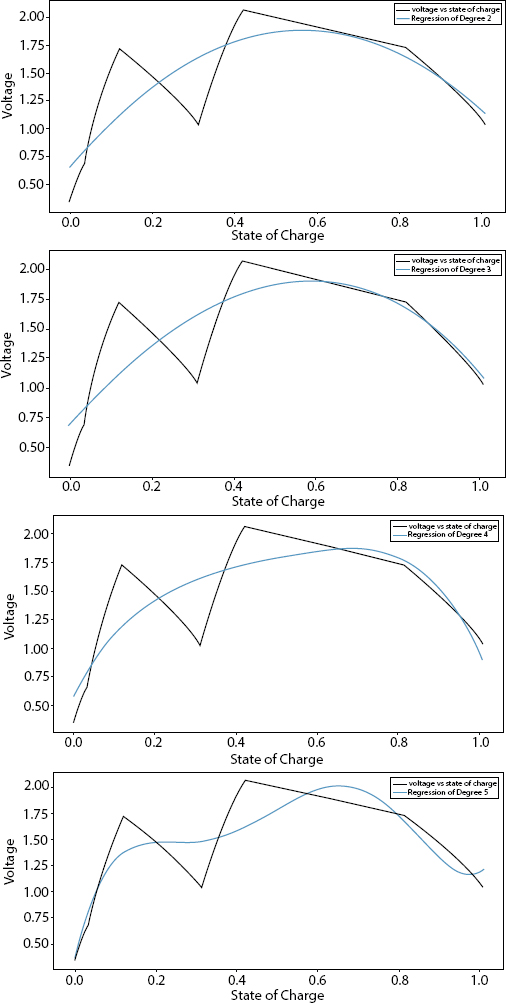
Figure 5.5 Curve fitting for OCV-SoC based on second-, third-, 4, and fifth-order polynomials.
Table 5.3 Performance metrics for regression models.
| Degree of the polynomials | R2 | RMSE |
| 2 | 0.7278 | 0.2289 |
| 3 | 0.7309 | 0.2276 |
| 4 | 0.7532 | 0.2179 |
| 5 | 0.8326 | 0.1795 |
The value of R2 for degree 2 is 0.7278 while for degree 5 it is 0.8326. Further, RMSE of 0.2289 for degree 2 and 0.1795 for degree 5 is observed. The term R2 gives an idea of how well the output of a process fits the set of input observations. It is statistics data of the closeness of the data and the fitting regression line. The quality of the fitting will increase with an increase in the value of the degree of a polynomial. From Table 5.3, it is observed that increase in the degree of polynomial the relationship between SoC and voltage increases fitting accuracy. The regression method is also used to predict the future values of voltage or SoC given that any one of them is given. A polynomial equation of degree at which the value of R-square is maximum (close to 1) can be used as a base parameter to predict variables provided that the usage of the battery is not changed. Similarly, RMSE decreases in magnitude for higher-order polynomials.
5.4 Conclusion
In this manuscript, we have investigated the response of the SoC and the OCV across the dynamic battery model under the variable voltage and current during the charging cycle of the battery. These variable input voltage and current have been obtained using the variable irradiance and surface temperature of a solar PV array which is connected as an input of the dynamic battery model to store the energy within it. In order to match the simulation result with reality, these variable irradiance and surface temperature of solar PV array with respect to time has been simulated. After forming and storing the energy within the dynamic battery model; the SoC of the battery has been estimated using the Kalman filter approach. After the successful estimation of SoC, the OCV and SoC have been plotted using the polynomial regression technique. The regression plots between the OCV and SoC have been drawn for the polynomial degree of 2, 3, 4, and 5. Results reveal that R2 keeps increasing as we increase the degrees of regression. Simultaneously, the value of RMSE keeps decreasing as we increase the degree of the polynomial regression.
References
1. Dhiman, H.S., Deb, D., Foley, A.M., Bilateral gaussian wake model formulation for wind farms: A forecasting based approach. Renewable Sustainable Energy Rev., 127, 109873, Jul. 2020.
2. Dhiman, H.S., Deb, D., Guerrero, J.M., Hybrid machine intelligent SVR variants for wind forecasting and ramp events. Renewable Sustainable Energy Rev., 108, 369–379, Jul. 2019.
3. Dhiman, H.S., Deb, D., Foley, A.M., Lidar assisted wake redirection in wind farms: A data driven approach. Renewable Energy, 152, 484–493, Jan. 2020.
4. Dhiman, H.S. and Deb, D., Decision and Control in Hybrid Wind Farms, Gateway East, Springer Singapore, 2020.
5. Chang, W.-Y., The state of charge estimating methods for battery: A review. ISRN Appl. Math., 2013, 1–7, 2013, [Online]. Available: https://doi.org/10.1155/2013/953792.
6. Yu, Z., Huai, R., Xiao, L., State-of-charge estimation for lithium-ion batteries using a kalman filter based on local linearization. Energies, 8, 8, 7854–7873, Jul. 2015, [Online]. Available: https://doi.org/10.3390/en8087854.
7. Anton, J.C.A., Nieto, P.J.G., Viejo, C.B., Vilan, J.A.V., Support vector machines used to estimate the battery state of charge. IEEE Trans. Power Electron., 28, 12, 5919–5926, Dec. 2013, [Online]. Available: https://doi.org/10.1109/tpel.2013.2243918.
8. Almasoud, A. and Gandayh, H.M., Future of solar energy in Saudi Arabia. J. King Saud Univ. – Eng. Sci., 27, 2, 153–157, Jul. 2015, [Online]. Available: https://doi.org/10.1016/j.jksues.2014.03.007.
9. Arshad, R., Tariq, S., Niaz, M.U., Jamil, M., Improvement in solar panel efficiency using solar concentration by simple mirrors and by cooling, in: 2014 International Conference on Robotics and Emerging Allied Technologies in Engineering (iCREATE), Apr. 2014, IEEE, [Online]. Available: https://doi.org/10.1109/icreate.2014.6828382.
10. Zhu, T. and Wang, L., State Energy Transition, Gateway East, Springer Singapore, 2020, [Online]. Available: https://doi.org/10.1007/978-981-32-9499-8.
11. Glavin, M. and Hurley, W., Battery management system for solar energy applications, in: Proceedings of the 41st International Universities Power Engineering Conference, Sep. 2006, IEEE, [Online]. Available: https://doi.org/10.1109/upec.2006.367719.
12. Kaundinya, D.P., Balachandra, P., Ravindranath, N., Grid-connected versus stand-alone energy systems for decentralized power—a review of literature. Renewable Sustainable Energy Rev., 13, 8, 2041–2050, Oct. 2009, [Online]. Available: https://doi.org/10.1016/j.rser.2009.02.002.
13. Powalla, M., Paetel, S., Hariskos, D., Wuerz, R., Kessler, F., Lechner, P., Wischmann, W., Friedlmeier, T.M., Advances in cost-efficient thin-film photovoltaics based on cu(in, ga)se 2. Engineering, 3, 4, 445–451, Aug. 2017, [Online]. Available: https://doi.org/10.1016/j.eng.2017.04.015.
14. Vega-Garita, V., Hanif, A., Narayan, N., Ramirez-Elizondo, L., Bauer, P., Selecting a suitable battery technology for the photovoltaic battery integrated module. J. Power Sources, 438, 227011, Oct. 2019, [Online]. Available: https://doi.org/10.1016/j.jpowsour.2019.227011.
15. Abed, K., Bahgat, A., Badr, M., El-Bayoumi, M., Ragheb, A., Experimental study of battery state of charge effect on battery charging/discharging performance and battery output power in pv energy system. ARPN J. Eng. Appl. Sci., 13, 739–745, 01 2018.
16. Musanga, L.M., Barasa, W.H., Maxwell, M., The effect of irradiance and temperature on the performance of monocrystalline silicon solar module in kakamega. Phys. Sci. Int. J., 19, 4, 1–9, Oct. 2018, [Online]. Available: https://doi.org/10.9734/psij/2018/44862.
17. L.C., Electrochemical model parameter identification of lithium-ion battery with temperature and current dependence. Int. J. Electrochem. Sci., 14, 4124–4143, Apr. 2019, [Online]. Available: https://doi.org/10.20964/2019.05.05.
18. Lyu, C., Zhao, Y., Luo, W., Wang, L., Aging mechanism analysis and its impact on capacity loss of lithium ion batteries, in: 2019 14th IEEE Conference on Industrial Electronics and Applications (ICIEA), Jun. 2019, IEEE, [Online]. Available: https://doi.org/10.1109/iciea.2019.8833827.
19. Zhang, L., Peng, H., Ning, Z., Mu, Z., Sun, C., Comparative research on RC equivalent circuit models for lithium-ion batteries of electric vehicles. Appl. Sci., 7, 10, 1002, Sep. 2017, [Online]. Available: https://doi.org/10.3390/app7101002.
20. Rosewater, D., Ferreira, S., Schoenwald, D., Hawkins, J., Santoso, S., Battery energy storage state-of-charge forecasting: Models, optimization, and accuracy. IEEE Trans. Smart Grid, 10, 3, 2453–2462, May 2018.
- *Corresponding author: [email protected]