The previous two chapters have been principally concerned with what happens to Azure Data Factory resources after you have finished developing them – how to get them into a production environment and how to run them automatically. This final chapter completes a trio of requirements for operating a production ADF instance: monitoring the behavior of deployed factory resources to ensure that individual resources and the factory as a whole continue to operate correctly.
Generate Factory Activity
- 1.
Navigate to the Triggers page in the ADF UX management hub and activate the “RunEvery2Minutes” trigger from Chapter 11. When published, this will cause two pipelines to be executed every two minutes, until the trigger is deactivated.
- 2.
In the pipeline authoring workspace, open the pipeline “ImportSTFormatFile” from Chapter 6. Add a new schedule trigger to run the pipeline automatically.
- 3.
Name the new trigger “RunEvery8Minutes” and set its Recurrence to every 8 minutes. Click OK to set the pipeline parameter values.
- 4.
Set the value of the Folder parameter to “azure-data-factory-by-example-main/SampleData/NaughtyButNice” and the File parameter value to “NBN-202006.csv”. Recall that this file contains a format error, so every triggered run of the pipeline will fail – the intention here is to simulate a mixed workload that contains occasional failures.
- 5.
Save the new trigger, then click Publish to deploy your changes into the factory’s published environment.
Remember to deactivate and republish the two triggers when you have finished exploring monitoring capabilities at the end of this chapter.
Inspect Factory Logs
The three Azure Data Factory components that “run” – triggers, pipelines, and activities – are reported in execution logs that can be inspected in the ADF UX monitoring experience.
Inspect Trigger Runs
- 1.
The triggers you published in the previous section will not run until the first time determined by their recurrence patterns after publishing, so the list of trigger runs may be empty. Use the Refresh button at the top of the page to update the list until you see new trigger runs start to appear.
- 2.
By default, trigger runs are reported from the last 24 hours. Each trigger run includes details such as the trigger name, type, actual trigger execution time, and status. Notice that runs of both triggers are reported to succeed – this indicates that each trigger was able to start the associated pipeline runs, even if those runs subsequently failed.
- 3.
Use the Trigger time column header to sort the list alternately into ascending and descending order of execution time. The pair of up/down arrows to the right of the column name indicates both the fact that the list can be sorted using that column and the column’s current sort order.
- 4.
The Properties column provides links to JSON objects containing information specific to the type of trigger. For example, in the case of a schedule trigger, this includes the run’s schedule time, while for a tumbling window trigger, you can verify the associated window start and end times. You can promote these properties into list columns by selecting them using the Edit columns button (next to the Refresh button).
The remaining controls at the top of the page enable you to filter the list in various different ways – for example, by trigger type, name, or status.
Inspect Pipeline Runs
- 1.
Select the Pipeline runs page in the monitoring experience and ensure that the Triggered tab is selected. The page includes a similar set of controls as those for trigger runs, allowing you to choose which rows or columns are displayed.
- 2.
Hover over a pipeline’s name to reveal additional controls. For pipelines still in progress – as shown in Figure 12-1 – buttons to cancel a pipeline’s execution are displayed. Cancel stops a running pipeline, while Cancel recursive also stops any executions initiated by the pipeline using the Execute Pipeline activity.
- 3.
Hover over a completed pipeline’s name to display Rerun and Consumption buttons. Rerun allows you to run a pipeline using the same parameter values supplied for its original run, whatever the outcome of its previous execution. (The Run column indicates whether a given pipeline execution was a rerun or not, with any prior runs displayed beneath the latest rerun). The Consumption button displays a popup summarizing resources used in the pipeline’s execution.

Pipeline runs in the ADF UX monitoring hub
- 4.
Use the checkboxes to the left of the Pipeline name column to select multiple runs. This enables you to cancel multiple running pipelines at once or to rerun several pipelines, using the Rerun and Cancel buttons at the top of the page. Use the List/Gantt toggle at the top of the page to switch back and forth between the list of pipeline runs and a Gantt chart view.
- 5.
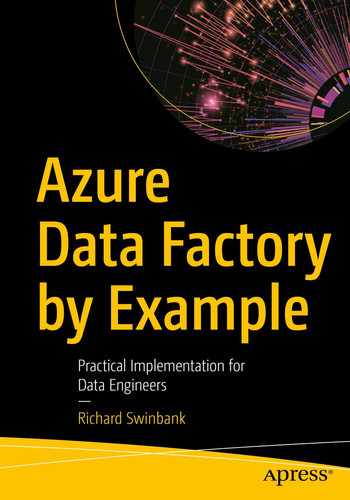
Click a pipeline name in the list view’s Pipeline name column to access the detail of each pipeline run’s activity executions, in a form familiar from debugging in the authoring workspace. You are unable to access nested activities using the pipeline diagram, but you can use it to select a specific activity from which to rerun a pipeline, as shown in Figure 12-2. The full list of activity executions appears below the pipeline diagram. Use the List/Gantt toggle to display a Gantt chart view of activity runs, then click All pipeline runs in the top left to return to the list of pipeline runs.
Unlike in a debug run output, details of activity failures are not displayed next to the activity name. Scroll the activity run list further to the right to locate error details.
Pipeline run detail
Add Metadata to the Log
The trigger, pipeline, and activity attributes reported so far are all standard elements of Azure Data Factory’s logging functionality. Sometimes, however, it is useful to be able to add additional metadata of your own – for example, to make it easier to identify particular subsets of factory activity in an otherwise noisy log. The following sections describe the use of pipeline annotations and activity user properties to achieve this.
Add a Pipeline Annotation
- 1.
In the ADF UX authoring workspace, open Chapter 5 pipeline “ImportSTFormatFolder,” one of the two pipelines triggered by “RunEvery2Minutes.”
- 2.
Open the Properties blade for the pipeline using the button (slider icon) at the top right of the authoring canvas. In the Annotations section, click the + New button to add a new annotation.
- 3.
A Name field is displayed – enter an annotation of your choice, then save the pipeline.
Add an Activity User Property
- 1.
On the authoring canvas, select the “ImportSTFormatFolder” pipeline’s Copy data activity. Select the User properties tab in the configuration pane.
- 2.
Click the + New button to add a new user property. Enter a property Name and Value of your choice.
- 3.
Click the Auto generate button. This option is specific to the Copy data activity and adds two copy-specific properties named “Source” and “Destination.” Their values are populated with expressions that will be translated at runtime into the activity’s data source and sink, then written into the pipeline run history.
- 4.
Save the pipeline and publish your changes.
Inspect Pipeline Annotations in the Log
- 1.
Open the Pipeline runs page in the ADF UX monitoring experience. When the annotated pipeline next runs, the Annotations column will contain a luggage label icon, indicating that the run has one or more annotations. Click the icon to display the run’s annotation.
- 2.
The primary purpose of pipeline annotations is to enable you to apply custom filters to the pipeline run list. Click Add filter, then select “Annotations” from the dropdown list.
- 3.
Choose your annotation value from the list, then click some empty space in the Pipeline runs page to apply the filter and exclude non-annotated runs from the list.
- 4.
Remove the annotations filter, then use the List/Gantt toggle to switch to the Gantt chart view. By default, the Gantt chart is grouped by pipeline name – tick the Group by annotations checkbox to enable an alternative presentation. Notice that only the most recent pipeline runs appear with your annotation value – runs which took place before the annotation was created appear in the “No annotations” group.
The annotation functionality described here for pipelines and pipeline runs is also available for triggers and trigger runs. The behavior of trigger annotations is very similar and is not described separately here.
Inspect User Properties in the Log
- 1.
Locate the User properties column in the activity runs pane below the pipeline diagram (you may need to toggle the view back to List to do so). For activity runs where one or more user properties were defined, the column contains a bookmark icon – click it.
- 2.
A Parameters dialog is displayed. This allows you to inspect configured user properties and their values and to promote them as columns in the activity runs list if you wish.
- 3.
Add or remove columns using the button in the column headed Edit columns, then click OK.
- 4.
Verify that the columns you selected for inclusion are now visible in the list of activity runs.
Inspect Factory Metrics
The structure of Azure Data Factory logs is naturally tightly coupled to the nature of factory resources, allowing concepts like triggers, pipelines, and activities to be represented in detail. In contrast, a metric is a simple count of a given system property over a period of time, emitted and logged automatically. Azure Monitor is a resource monitoring service used to collect data – including metrics – from all Azure resources.
- 1.
Open the Azure portal, then browse to the resource blade for your data factory.
- 2.
In the left sidebar menu, scroll down to the Monitoring section, then select Metrics.
- 3.
The Metrics page displays a metric selection tool above an empty chart. (If the metric selection tool is not visible, click Add metric in the chart header bar.) Choose “Succeeded activity runs metrics” from the selection tool’s Metric dropdown.
- 4.
Click Add metric in the chart header bar to add another metric – this time, choose “Failed activity runs metrics.”

Azure Data Factory activity runs metrics
Metrics emitted by Azure Data Factory serve the same purpose as SSIS performance counters. They do not provide information about specific system activities, but can be used in a general way to understand system health. Just as Integration Services is not the only Windows service to maintain performance counters, so many Azure resources emit resource-specific metrics that can be accessed in the same way.
Export Logs and Metrics
The log analysis capabilities offered by the ADF monitoring experience are somewhat limited, as are those for metrics in the data factory resource blade. To perform more sophisticated analysis and monitoring of the factory activity, you must export log and metric data to a service better suited to doing so. Approaches to doing this, examined in the following sections, offer the additional benefit of being able to keep diagnostic data for longer – logs generated by Azure Data Factory are purged automatically after 45 days, and metrics emitted to Azure Monitor are stored for no more than 93 days before being deleted.
Create a Log Analytics Workspace
- 1.
In the Azure portal, create a new resource of type Log Analytics Workspace.
- 2.
Select the subscription and resource group that contains your ADF instance, then under Instance details, enter a globally unique Name.
- 3.
Ensure that Region matches the Azure region containing your data factory, then select Review + Create.
- 4.
Review the details you have provided, then click Create to begin deployment.
Configure Diagnostic Settings
Although not configured by default, every Azure resource has the ability to interact with Azure Monitor, sending logs and metrics to Log Analytics and other destinations by means of diagnostic settings. A diagnostic setting specifies a set of resource logs and metrics to be sent to up to three destinations – one Azure storage account, one Log Analytics workspace, and one Azure Event Hub.
- 1.
Return to the resource blade for your data factory in the Azure portal, then in the Monitoring section of the sidebar, select Diagnostic settings.
- 2.
The Diagnostic settings page lists settings created for the factory resource (currently none). Click + Add diagnostic setting to create a new one.
- 3.
Provide a new Diagnostic setting name, then under Category details, tick checkboxes to select “ActivityRuns,” “PipelineRuns,” and “TriggerRuns” from the log section and “AllMetrics” from the metric section.
- 4.
Under Destination details, tick the “Send to Log Analytics workspace” checkbox to enable selection of your new workspace. Select your subscription and workspace from the respective dropdowns, and ensure that the Destination table toggle is set to “Resource specific.”
- 5.
Tick the “Archive to a storage account” checkbox to configure a storage account destination. This means that log and metric information will be streamed from your ADF instance to two separate destinations: your Log Analytics workspace and the storage account you specify here. Select your subscription and the storage account you have been using throughout from the respective dropdowns.
Note Your existing storage account is sufficient for the purpose of this exercise, but Microsoft recommends that production logs are sent to a dedicated storage account.
- 6.
Choosing the “Archive to a storage account” option causes the portal to offer you a choice of retention period for each of the log and metric categories. Leave each value at its default of zero and save your changes.
A nonzero retention period will cause log data to be deleted from blob storage automatically after it has been stored for the specified period, while a value of zero means “retain forever.” Retention periods are attached to log entries as they are written and cannot be changed – if you modify a diagnostic setting’s retention period later, retention settings for log data already in storage will not change.
Inspect Logs in Blob Storage
- 1.
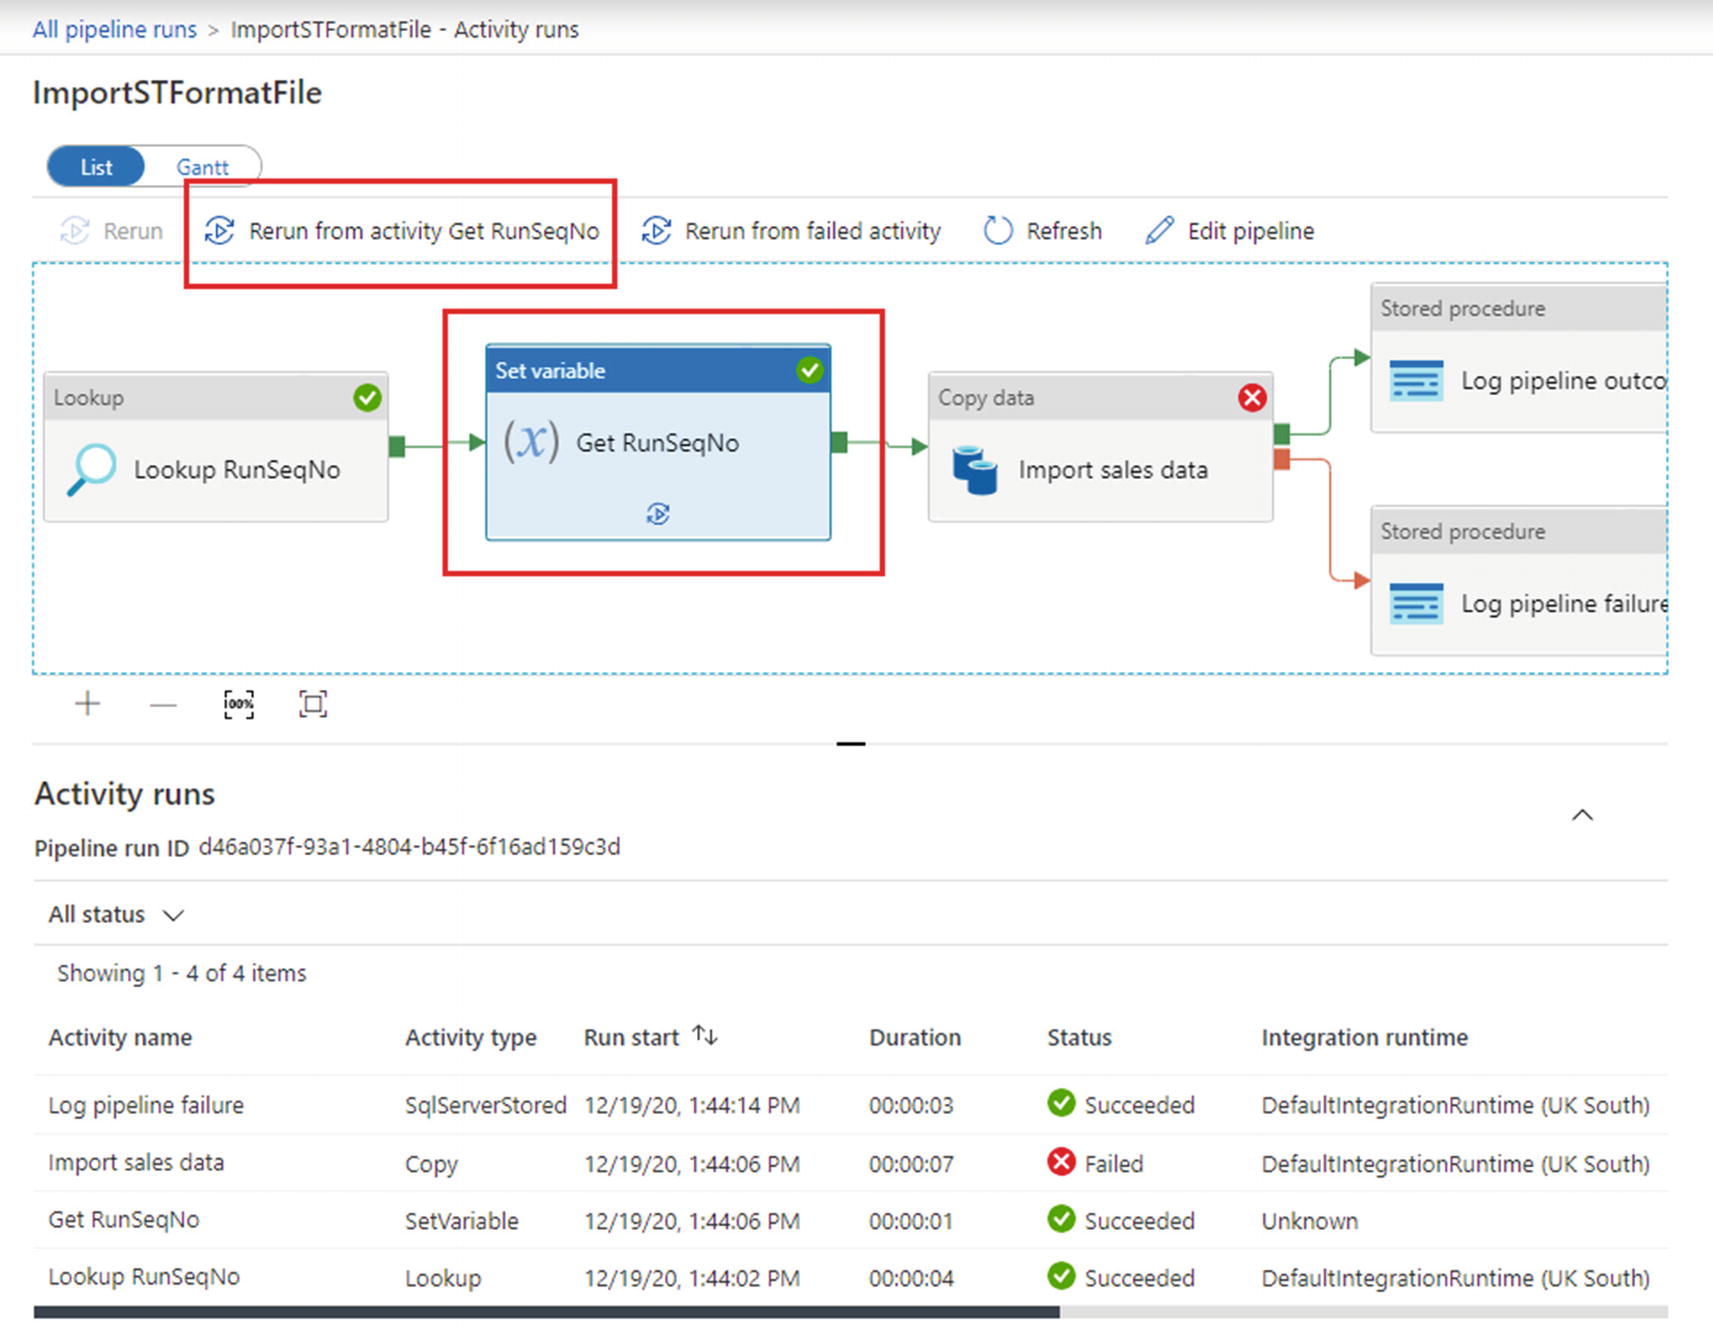
Open the online Storage Explorer app for your storage account. As logs start to be written to your storage account – this may take a few minutes – new blob storage containers are created automatically to contain them. A separate container is created for metrics and another for logs from each of trigger runs, pipeline runs, and activity runs. Figure 12-4 shows the four storage account containers created by my ADF instance’s diagnostic settings.
- 2.
Explore the activity runs container – it holds a single root folder called “resourceId=”. The folder subtree corresponds to the path segments of the fully qualified Azure resource ID of the data factory, broken down further into year, month, day, hour, and minute. Keep drilling down into folders until you reach the minute folder, named something like “m=00”.
- 3.
Logs are written by appending JSON objects to text files – the log file in Figure 12-4 is named “PT1H.json”. Use the Download button to copy a log file to your computer.
- 4.
Open the downloaded log file in a text editor to view its contents – you will be able to see pipeline and activity names familiar from the pipelines being triggered, along with a variety of other log information.
Diagnostic settings containers in online Storage Explorer
Use the Log Analytics Workspace
As you discovered in the previous section, using a diagnostic setting to copy logs to Azure blob storage solves only the problem of retention – further work would be required to be able to query and analyze the collected log data. As the name suggests, an Azure Monitor Log Analytics workspace can support both requirements. By default, data sent to a Log Analytics workspace is retained for 31 days, but you can increase this to up to 2 years. In the following sections, you will explore two approaches for interacting with log data sent to a Log Analytics workspace.
Query Logs
- 1.
In the Azure portal, browse to the Log Analytics workspace you created earlier in the chapter. Select Logs from the General section of the sidebar to open a new query tab.
- 2.
If the Queries dialog is displayed, close it. The new query tab contains a tabbed sidebar, a query pane, and a history of recent queries.
- 3.
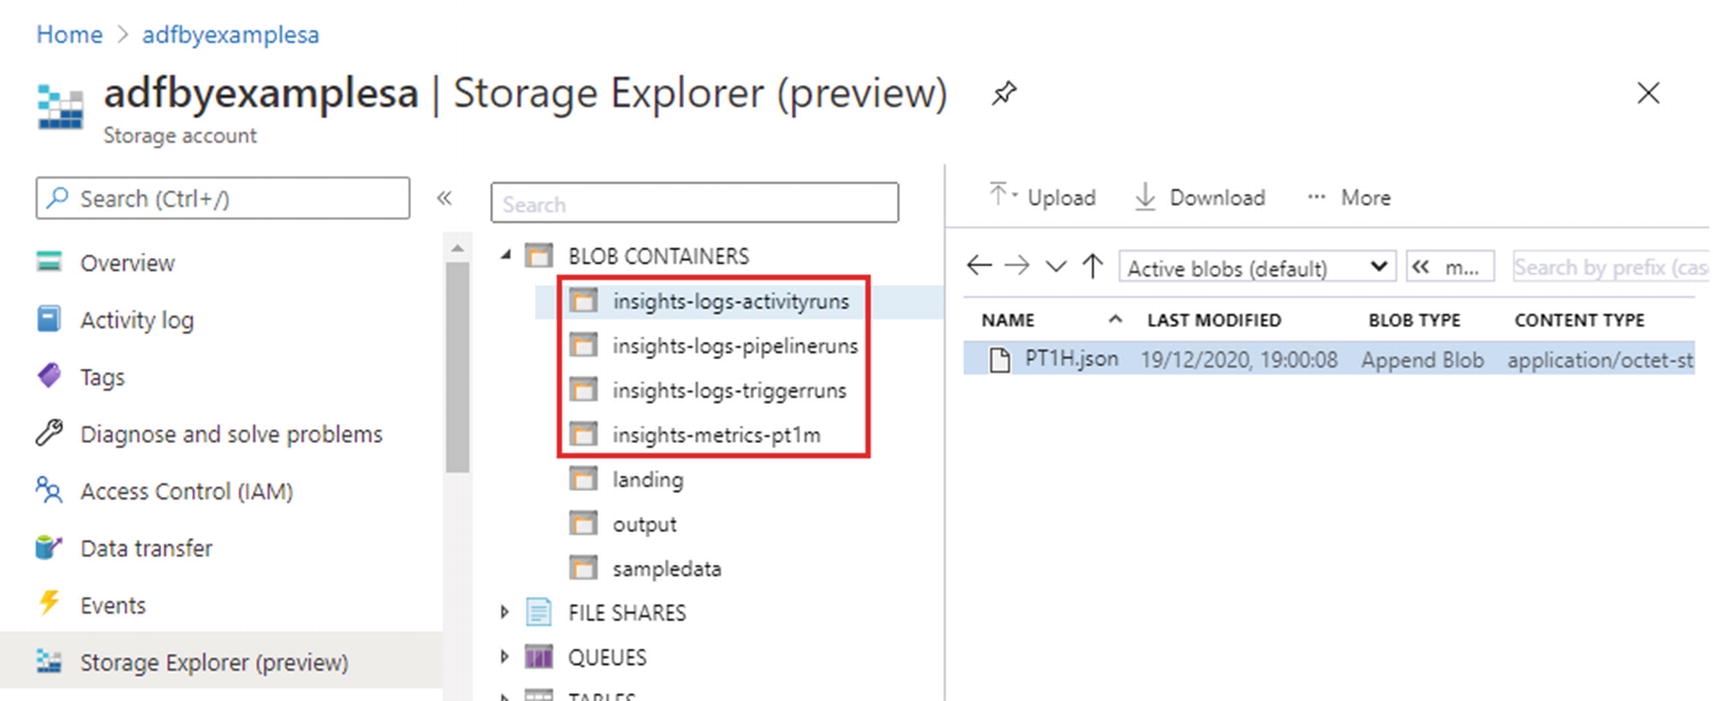
Make sure that Tables is selected in the tabbed sidebar. The LogManagement section lists log tables being maintained in this workspace – as log data begins to arrive, a total of four tables appear, corresponding to the category details you selected when creating your ADF diagnostic settings. A fifth table called “Usage” reports usage data for the Log Analytics service itself.
- 4.
Log Analytics queries are written using the Kusto query language. Kusto queries contain at least one tabular expression statement – a statement with table-like output. A tabular expression statement always begins with a data source, followed optionally by a sequence of transformations separated by the pipe (“|”) character. The simplest query identifies a data source – one of the tables listed in the LogManagement section. Enter the query ADFPipelineRun; in the query pane and click Run.
- 5.
The query returns pipeline run details sent to Log Analytics by your ADF diagnostic setting – the data factory’s own logs are not interrogated directly. Refine the query to return pipeline runs that have failed in the last 10 minutes – the query shown in Figure 12-5 is one solution.
Querying logs in a Log Analytics workspace
Use a Log Analytics Workbook
- 1.
Browse to https://azuremarketplace.microsoft.com and search for “data factory analytics.”
- 2.
Select the Azure Data Factory Analytics tile from the results. (At the time of writing, this app is still marked as being in preview.) On the app overview page, click the GET IT NOW button. Click Continue to accept the terms and conditions.
- 3.
The Create new Solution blade opens in the Azure portal. Choose your Log Analytics workspace as the location where the solution is to be created, then click Create. When deployment is complete, a notification appears in the portal including a Go to resource button – click it.
- 4.
In the solution blade, select Workbooks from the General section of the sidebar. Locate the AzureDataFactoryAnalytics tile and click it to open the workbook.
- 5.
The workbook contains a variety of data visualizations for trigger, pipeline, and activity runs, including breakdowns by factory, frequency, and type. Figure 12-6 shows the workbook cell reporting pipeline run breakdown by factory.
- 6.
Click Edit in the header bar (indicated in Figure 12-6) to inspect the workbook definition. In edit mode, an Edit button is displayed to the right of every workbook cell – click the button next to a cell to edit its definition.
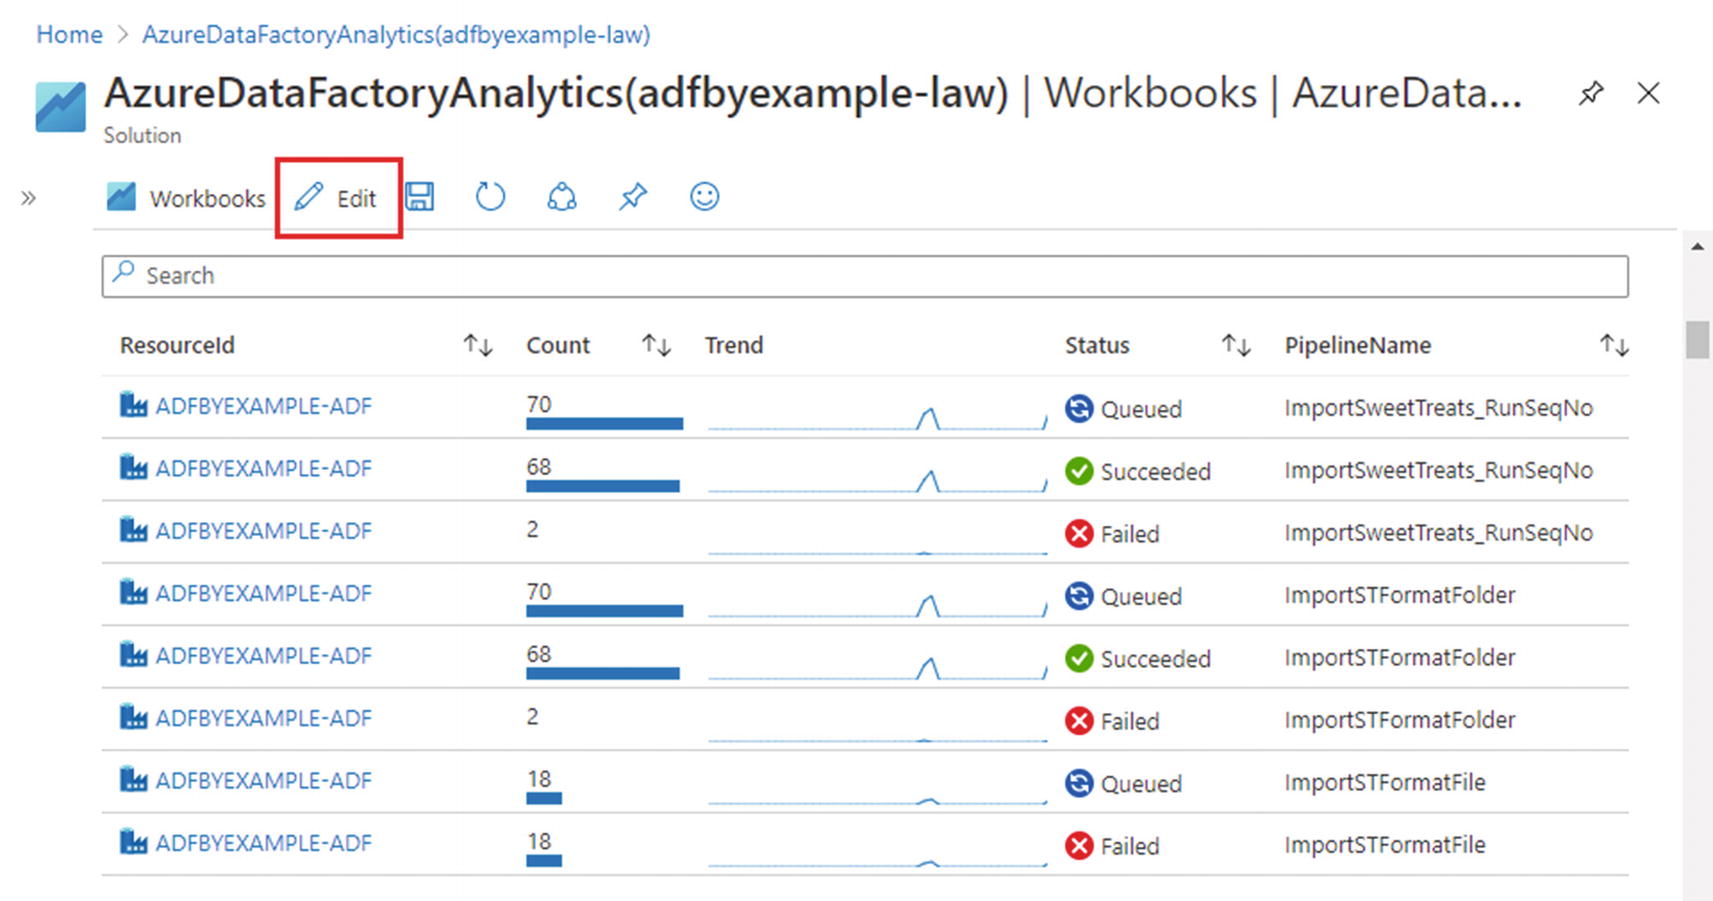
Workbook in the AzureDataFactoryAnalytics solution
In small- to medium-sized environments, Log Analytics provides a convenient central point to gather service logs and metrics from across your Azure estate and to analyze them together. At a larger scale, Azure Data Explorer offers the ability to query high volumes of raw log data in near real time, also using Kusto.
Receive Alerts
So far, in this chapter, you have explored how to interact with log data in the ADF UX monitoring experience and how to do so with greater flexibility using a Log Analytics workspace. Both of these approaches require proactive monitoring of the factory activity – a lighter-touch approach is to receive notifications automatically under prescribed conditions, requiring you to intervene only in cases of failure. The following sections introduce mechanisms available to issue alerts automatically in response to configured patterns of metric or log data.
Configure Metric-Based Alerts
- 1.
Open the resource blade for your data factory in the Azure portal, then in the Monitoring section of the sidebar, select Alerts.
- 2.
The Alerts page lists alerts that have been raised for the data factory – currently none. The conditions under which an alert is raised are defined using an alert rule. Click + New alert rule to create a new rule.
- 3.
An alert rule has three components: its scope, conditions, and actions. The scope of the new alert – the resource being monitored – is your data factory and will be preselected. Its conditions define the circumstances under which an alert will be raised. In the Condition section, click Add condition.
- 4.
On the Configure signal logic blade, choose “Failed pipeline runs metrics” – a chart appears automatically, displaying the chosen signal’s recent history. Under Alert logic, set the Threshold value to 0. The Condition preview should now read “Whenever the total failed pipeline runs metrics is greater than 0.”
- 5.
Under Evaluated based on, set the Aggregation granularity to “5 minutes” and the Frequency of evaluation to “Every 5 minutes.” This combination of settings means that, every five minutes, Azure Monitor will count the number of pipeline failures that occurred in the previous five minutes. If that number exceeds zero, an alert will be raised. Click Done to create the condition.
- 6.
The alert rule’s actions describe what Azure Monitor will do when the alert is raised. Actions are defined in an action group – a reusable collection of notifications (e.g., emails or SMS messages) and automated system actions that can be defined in a variety of ways (such as an Azure Function or a Logic Apps workflow). Click Add action groups to create a new action group.
- 7.
In the Select an action group… blade, click + Create action group. Select the subscription and resource group that contain your ADF instance, then under Instance details, enter the value “NotifyMe” for both the Action group name and Display name.
- 8.
Click Next: Notifications to move on to the Notifications tab. Select “Email/SMS message/Push/Voice” from the Notification type dropdown, then complete at least one option on the displayed blade. In practice, your choice of notification type will be determined by the urgency of the alert you are creating, but note that not all options are available in every Azure region. Click OK to close the blade.
- 9.
Supply a Name for the new notification, then click Review + create. (For the purpose of this exercise, you need not create any additional notifications or actions.) Click Create.
- 10.
Finally, back in the Create alert rule blade, complete the Alert rule details section. Specify an Alert rule name of “High failure rate,” select the same resource group as your data factory, and choose the Severity level “Sev 2.” Ensure that the Enable alert rule upon creation checkbox is ticked, then click the Create alert rule button to create the new rule.
Severity levels range from “Sev 4” (least severe) to “Sev 0” (most severe) and have the following meanings: “Verbose” (4), “Informational” (3), “Warning” (2), “Error” (1), and “Critical” (0).
The failure rate being detected here may not resemble a production workload, but is chosen to illustrate the approach – you will now start to receive alert messages whenever the “High failure rate” alert condition is met. The “RunEvery8Minutes” trigger calling the failing pipeline does not run in every five-minute window, so this may not be immediate. Additionally, new metric-based alerts take a few minutes to come into effect in Azure.
The approach taken here to configuring alerts uses the Azure portal. Metric-based alerts for Azure Data Factory can also be created and managed from the Alerts & metrics page of the ADF UX monitoring experience.
Configure Log-Based Alerts
- 1.
Open your Log Analytics workspace in the Azure portal, then in the Monitoring section of the sidebar, select Alerts. As before, click + New alert rule to create a new rule.
- 2.
Accept the default Scope identifying the Log Analytics workspace, then click Add condition to create a new alert condition.
- 3.
Notice that the set of signals displayed in the Configure signal logic blade differs from previously – the available signals of type “Metric” now relate to Log Analytics metrics, and a new signal type of “Log” is present. Choose the “Log” signal named “Custom log search.”
- 4.
As the name suggests, “Custom log search” enables you to create alerts based on the results of custom log queries. Scroll down the blade to the Search query pane and enter the Kusto query given in Listing 12-1.
Tip Notice that Listing 12-1 has no terminating semicolon. Custom log search reduces its query result set to a count of matching rows by piping the query into Kusto’s count operator. If the input query is explicitly terminated, appending “| count” results in an invalid expression.
- 5.
Set the Alert logic’s Threshold value to zero, and specify evaluation based on a Period of 10 minutes and a Frequency of 5 minutes. This means that, every five minutes, the custom log query will be executed over rows with a “TimeGenerated” value within the prior ten minutes.
- 6.
Click Done to add the new alert condition, then click Add action groups to add an action group. Select the “NotifyMe” action group you created earlier.
- 7.
Name the new alert rule and set its severity to “Sev 1,” then click Create alert rule.
Kusto query returning recent failed runs of a specific pipeline
The new rule reports an error on more specific conditions: whenever the named pipeline fails. Windowed queries like this cannot be guaranteed to catch every error, because there is a delay between events occurring in ADF and their being received by the Log Analytics service. The alert frequency is intended to allow detection of failures occurring in the previous five minutes. Its period of 10 minutes allows more time for late-arriving errors, but failure records that take more than 10 minutes to arrive will not cause an alert.
The alerts you configured in the preceding sections were based on metrics emitted directly by your data factory and on logs sent to Log Analytics. Your ADF diagnostic setting also sends data factory metrics to Log Analytics, so you could choose to build ADF metric alerts there instead. The disadvantage of doing this is that it subjects metrics to the same latency effects as other log records. Note also that ADF metrics sent to Log Analytics appear as log records in the AzureMetrics log table – metrics reported in Log Analytics are those emitted by that service and not by Azure Data Factory.
A more direct approach to raising alerts is to create an Azure Function that performs notifications. While creating Azure Functions is outside the scope of this book, doing so allows you to issue notifications from within an ADF pipeline, for example, by connecting an Azure Function pipeline activity via a Failure activity dependency.
Deactivate ADF Triggers
When you have finished exploring monitoring features, deactivate the two triggers you activated at the beginning of this chapter. Remember to publish your changes to deactivate the triggers in the published environment.
Chapter Review
Logs and metrics as indicators and measures of system activity and health
The ADF UX monitoring experience and Log Analytics to inspect and analyze logs and metrics
Azure Monitor’s alerting support to receive notifications of potential issues indicated by log and metric analyses
These tools enable you to gain insight into the workload and health of your Azure Data Factory instance, allowing you to detect and resolve issues as they arise.
Key Concepts
Pipeline annotation: A label, added to a pipeline, that appears in the log of subsequent pipeline runs and can be used to filter or group log data. Multiple annotations can be added to a pipeline.
Trigger annotation: A label, added to a trigger, providing functionality analogous to a pipeline annotation.
Activity user property: A name-value pair, added to a pipeline activity, that appears in the log of subsequent pipeline runs. Multiple user properties can be added to an activity. The Copy data activity supports two auto-generated properties that identify its runtime source and sink.
Azure Monitor: Monitoring service used to collect, analyze, and respond to data from Azure resources.
Metric: Automatically maintained count of a given system property over a period of time, emitted to and logged by Azure Monitor.
Log Analytics: Azure Monitor component that enables sophisticated analysis of system logs and metrics.
Log Analytics workspace: Identified Log Analytics provision, to which Azure resource logs and metrics can be sent for analysis and longer-term storage.
Diagnostic setting: Per-resource configuration information identifying log data and metrics to be sent to other storage services, for example, a Log Analytics workspace.
Kusto: Query language used to interrogate data stored in Log Analytics and Azure Data Explorer.
Tabular expression statement: Kusto query expression that returns a result set. Every Kusto query must contain a tabular expression statement.
Log Analytics workbook: A notebook-like interface for querying Log Analytics data, allowing code and text cells to be interleaved to create narrative reports.
Azure Data Explorer: Analytics service for near real-time, large-scale analysis of raw data. Like Log Analytics, the service accepts read-only queries written in Kusto.
Alerts: Azure Monitor supports the raising of alerts in response to configured metric or custom query output thresholds.
Alert rule: Information that defines an alert – its scope (what to monitor), its conditions (when an alert should be raised), and its actions (who to notify and/or what to do when an alert is raised).
Signal: Measure used to evaluate an alert condition.
Action group: Defines a collection of notifications and actions, used to specify the action component of an alert rule.
For SSIS Developers
Many of the logging and metric concepts presented here will be familiar to SSIS developers. Azure resource metrics are very similar to the notion of Windows performance counters and serve a comparable purpose. Just as SSIS emits performance counters specific to Integration Services, so does Azure Data Factory emit ADF-specific metrics.
Automatic logging of activity will be familiar, particularly to users of the SSIS catalog, and automated log truncation may be a welcome change. Conversely, if long-term storage is required, ADF requires additional functionality in the form of Log Analytics or blob storage for indefinite retention. Users of the SSIS catalog used to being able to query and analyze SSIS logs will find comparable functionality offered by Log Analytics queries and workbooks.