9
BAYESIAN PRIORS AND WORKING WITH PROBABILITY DISTRIBUTIONS

Prior probabilities are the most controversial aspect of Bayes’ theorem, because they’re frequently considered subjective. In practice, however, they often demonstrate how to apply vital background information to fully reason about an uncertain situation.
In this chapter, we’ll look at how to use a prior to solve a problem, and at ways to use probability distributions to numerically describe our beliefs as a range of possible values rather than single values. Using probability distributions instead of single values is useful for two major reasons.
First, in reality there is often a wide range of possible beliefs we might have and consider. Second, representing ranges of probabilities allows us to state our confidence in a set of hypotheses. We explored both of these examples when examining the mysterious black box in Chapter 5.
C-3PO’s Asteroid Field Doubts
As an example, we’ll use one of the most memorable errors in statistical analysis from a scene in Star Wars: The Empire Strikes Back. When Han Solo, attempting to evade enemy fighters, flies the Millennium Falcon into an asteroid field, the ever-knowledgeable C-3PO informs Han that probability isn’t on his side. C-3PO says, “Sir, the possibility of successfully navigating an asteroid field is approximately 3,720 to 1!”
“Never tell me the odds!” replies Han.
Superficially, this is just a fun movie dismissing “boring” data analysis, but there’s actually an interesting dilemma here. We the viewers know that Han can pull it off, but we probably also don’t disagree with C-3PO’s analysis. Even Han believes it’s dangerous, saying, “They’d have to be crazy to follow us.” Plus, none of the pursuing TIE fighters make it through, which provides pretty strong evidence that C-3PO’s numbers aren’t totally off.
What C-3PO is missing in his calculations is that Han is a badass! C-3PO isn’t wrong, he’s just forgetting to add essential information. The question now is: can we find a way to avoid C-3PO’s error without dismissing probability entirely, as Han proposes? To answer this question, we need to model both how C-3PO thinks and what we believe about Han, then blend those models using Bayes’ theorem.
We’ll start with C-3PO’s reasoning in the next section, and then we’ll capture Han’s badassery.
Determining C-3PO’s Beliefs
C-3PO isn’t just making up numbers. He’s fluent in over 6 million forms of communication, and that takes a lot of data to support, so we can assume that he has actual data to back up his claim of “approximately 3,720 to 1.” Because C-3PO provides the approximate odds of successfully navigating an asteroid field, we know that the data he has gives him only enough information to suggest a range of possible rates of success. To represent that range, we need to look at a distribution of beliefs regarding the probability of success, rather than a single value representing the probability.
To C-3PO, the only possible outcomes are successfully navigating the asteroid field or not. We’ll determine the various possible probabilities of success, given C-3PO’s data, using the beta distribution you learned about in Chapter 5. We’re using the beta distribution because it correctly models a range of possible probabilities for an event, given information we have on the rate of successes and failures.
Recall that the beta distribution is parameterized with an α (number of observed successes) and a β (the number of observed failures):
P(RateOfSuccess | Successes and Failures) = Beta(α,β)
This distribution tells us which rates of success are most likely given the data we have.
To figure out C-3PO’s beliefs, we’ll make some assumptions about where his data comes from. Let’s say that C-3PO has records of 2 people surviving the asteroid field, and 7,440 people ending their trip in a glorious explosion! Figure 9-1 shows a plot of the probability density function that represents C-3PO’s belief in the true rate of success.
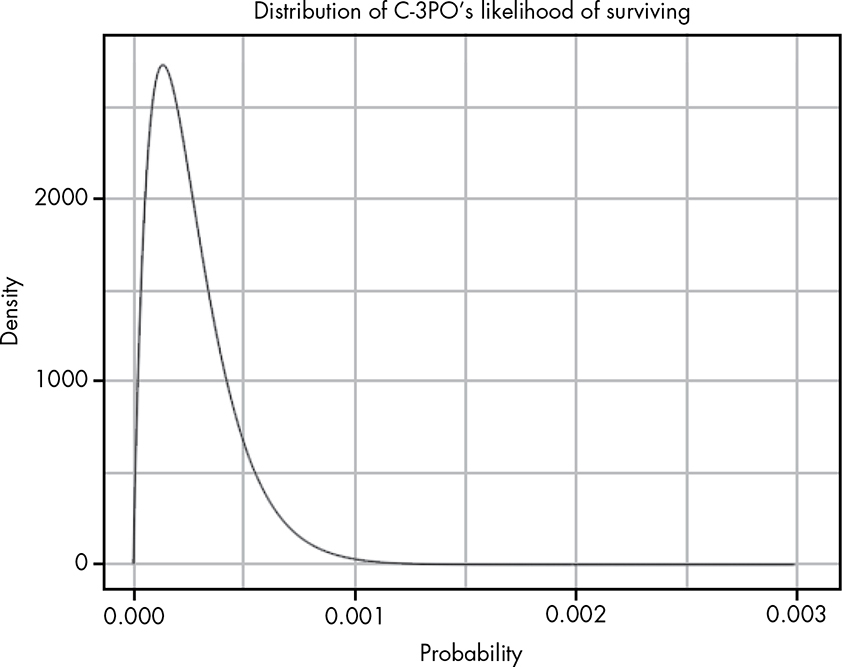
Figure 9-1: A beta distribution representing C-3PO’s belief that Han will survive
For any ordinary pilot entering an asteroid field, this looks bad. In Bayesian terms, C-3PO’s estimate of the true rate of success given observed data, 3,720:1, is the likelihood, which we discussed in Chapter 8. Next, we need to determine our prior.
Accounting for Han’s Badassery
The problem with C-3PO’s analysis is that his data is on all pilots, but Han is far from your average pilot. If we can’t put a number to Han’s badassery, then our analysis is broken—not just because Han makes it through the asteroid field, but because we believe he’s going to. Statistics is a tool that aids and organizes our reasoning and beliefs about the world. If our statistical analysis not only contradicts our reasoning and beliefs, but also fails to change them, then something is wrong with our analysis.
We have a prior belief that Han will make it through the asteroid field, because Han has survived every improbable situation so far. What makes Han Solo legendary is that no matter how unlikely survival seems, he always succeeds!
The prior probability is often very controversial for data analysts outside of Bayesian analysis. Many people feel that just “making up” a prior is not objective. But this scene is an object chapter in why dismissing our prior beliefs is even more absurd. Imagine watching Empire for the first time, getting to this scene, and having a friend sincerely tell you, “Welp, Han is dead now.” There’s not a chance you’d think it was true. Remember that C-3PO isn’t entirely wrong about how unlikely survival is: if your friend said, “Welp, those TIE fighters are dead now,” you would likely chuckle in agreement.
Right now, we have many reasons for believing Han will survive, but no numbers to back up that belief. Let’s try to put something together.
We’ll start with some sort of upper bound on Han’s badassery. If we believed Han absolutely could not die, the movie would become predictable and boring. At the other end, our belief that Han will succeed is stronger than C-3PO’s belief that he won’t, so let’s say that our belief that Han will survive is 20,000 to 1.
Figure 9-2 shows the distribution for our prior probability that Han will make it.
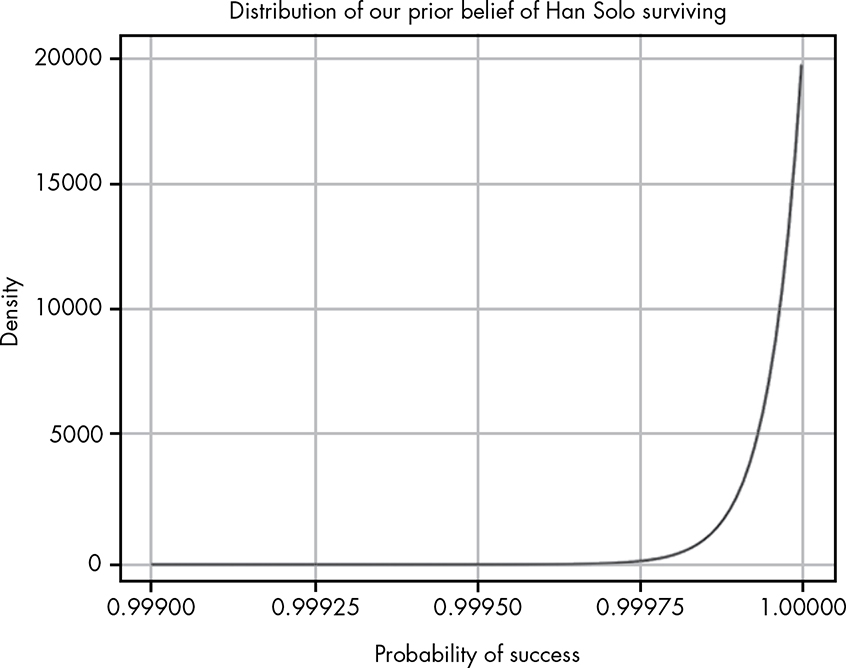
Figure 9-2: The beta distribution representing the range of our prior belief in Han Solo’s survival
This is another beta distribution, which we use for two reasons. First, our beliefs are very approximate, so we need to concede a variable rate of survival. Second, a beta distribution will make future calculations much easier.
Now, with our likelihood and prior in hand, we can calculate our posterior probability in the next section.
Creating Suspense with a Posterior
We have now established what C-3PO believes (the likelihood), and we’ve modeled our own beliefs in Han (the prior), but we need a way to combine these. By combining beliefs, we create our posterior distribution. In this case, the posterior models our sense of suspense upon learning the likelihood from C-3PO: the purpose of C-3PO’s analysis is in part to poke fun at his analytical thinking, but also to create a sense of real danger. Our prior alone would leave us completely unconcerned for Han, but when we adjust it based on C-3PO’s data, we develop a new belief that accounts for the real danger.
The formula for the posterior is actually very simple and intuitive. Given that we have only a likelihood and a prior, we can use the proportional form of Bayes’ theorem that we discussed in the previous chapter:
Posterior ∝ Likelihood × Prior
Remember, using this proportional form of Bayes’ theorem means that our posterior distribution doesn’t necessarily sum to 1. But we’re lucky because there’s an easy way to combine beta distributions that will give us a normalized posterior when all we have is the likelihood and the prior. Combining our two beta distributions—one representing C-3PO’s data (the likelihood) and the other our prior belief in Han’s ability to survive anything (our prior)—in this way is remarkably easy:
Beta (αposterior,βposterior) = Beta(αlikelihood + αprior, βlikelihood + βprior)
We just add the alphas for our prior and likelihood and the betas for our prior and likelihood, and we arrive at a normalized posterior. Because this is so simple, working with the beta distribution is very convenient for Bayesian statistics. To determine our posterior for Han making it through the asteroid field, we can perform this simple calculation:
Beta(20002,7401) = Beta(2 + 20000, 7400 + 1)
Now we can visualize our new distribution for our data. Figure 9-3 plots our final posterior belief.
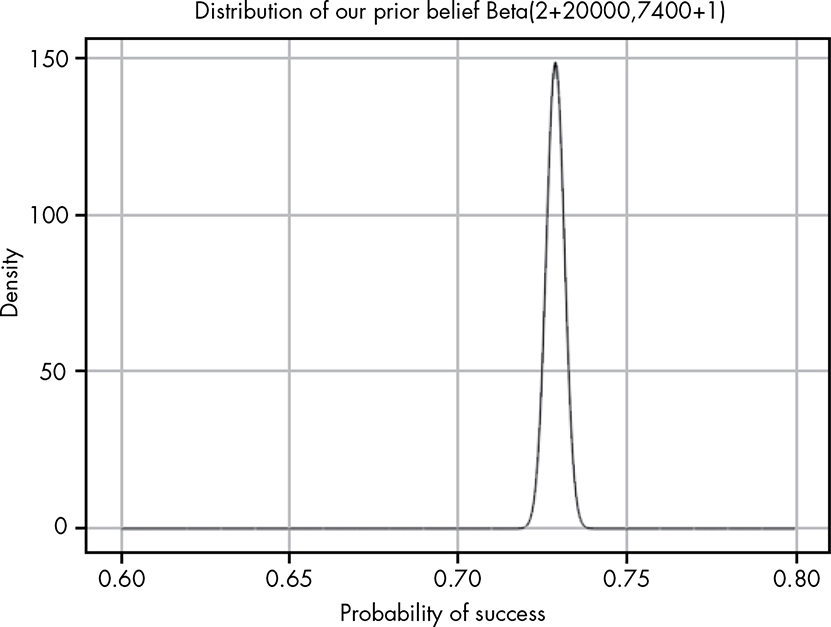
Figure 9-3: Combining our likelihood with our prior gives us a more intriguing posterior.
By combining the C-3PO belief with our Han-is-a-badass belief, we find that we have a far more reasonable position. Our posterior belief is a roughly 73 percent chance of survival, which means we still think Han has a good shot of making it, but we’re also still in suspense.
What’s really useful is that we don’t simply have a raw probability for how likely Han is to make it, but rather a full distribution of possible beliefs. For many examples in the book, we’ve stuck to simply using a single value for our probabilities, but in practice, using a full distribution helps us to be flexible with the strength of our beliefs.
Wrapping Up
In this chapter, you learned how important background information is to analyzing the data in front of you. C-3PO’s data provided us with a likelihood function that didn’t match up with our prior understanding of Han’s abilities. Rather than simply dismissing C-3PO, as Han famously does, we combine C-3PO’s likelihood with our prior to come up with an adjusted belief about the possibility of Han’s success. In Star Wars: The Empire Strikes Back, this uncertainty is vital for the tension the scene creates. If we completely believe C-3PO’s data or our own prior, we would either be nearly certain that Han would die or be nearly certain that he would survive without trouble.
You also saw that you can use probability distributions, rather than a single probability, to express a range of possible beliefs. In later chapters in this book, you’ll look at these distributions in more detail to explore the uncertainty of your beliefs in a more nuanced way.
Exercises
Try answering the following questions to see if you understand how to combine prior probability and likelihood distributions to come up with an accurate posterior distribution; solutions to the questions can be found in Appendix C.
- A friend finds a coin on the ground, flips it, and gets six heads in a row and then one tails. Give the beta distribution that describes this. Use integration to determine the probability that the true rate of flipping heads is between 0.4 and 0.6, reflecting that the coin is reasonably fair.
- Come up with a prior probability that the coin is fair. Use a beta distribution such that there is at least a 95 percent chance that the true rate of flipping heads is between 0.4 and 0.6.
- Now see how many more heads (with no more tails) it would take to convince you that there is a reasonable chance that the coin is not fair. In this case, let’s say that this means that our belief in the rate of the coin being between 0.4 and 0.6 drops below 0.5.