![]()
I believe programmers are no better than their knowledge of the debugging and troubleshooting tools available for the programming language they’re using. Why? Well, first, all programmers make coding mistakes. I often remark that the day I code something that compiles and runs correctly the first time, I’m going to retire because that would be the peak of my programming career. Second, programmers make logic mistakes. When is the last time you had to write some parsing code? That’s one of the toughest types of programming to get right the first, second, third, or nth time around.
To find and solve our mistakes, we need a means to be able to discover exactly what is going on in our programs at that point in time when an error occurs. Sadly enough, when PL/SQL first appeared and for quite some time after, there was virtually no way to debug a stored PL/SQL program unit. The best we could do was to use SYS.DBMS_OUTPUT.put_line() to display a bunch of messages on the screen after the stored procedure finished executing.
Then along came the package SYS.DBMS_PIPE, where the most adventurous of us could write our own utilities to monitor an executing stored PL/SQL program unit in “real time” from a second session. That was an improvement, but not one that most PL/SQL programmers could use. Next, the pragma autonomous transaction showed up, which allowed us to write logging utilities that used a second session in order to monitor a stored PL/SQL program unit, and could permanently save the monitoring messages to a table. That was better, but still not very good.
More recently, the package SYS.DBMS_DEBUG became available. It allows us to write our own programs to actually run a remote debugging utility against a stored PL/SQL program unit. And now Oracle has made a PL/SQL debugger freely available to its programming communities with a product (written in Java) called Oracle SQL Developer. Other vendors have followed suit, and now you can remotely debug from graphical user interface (GUI) integrated development environments (IDEs) like TOAD for Oracle and Visual Studio, to name just a few. With a real remote debugger in our hands, we can actually see just what’s happening in our PL/SQL programs.
When it comes to SQL, we’ve had access to EXPLAIN PLAN and TKPROF for as long as I can remember. Both give us the means to see the plans that the Oracle SQL Optimizer is going to use to access the underlying objects that are part of our SQL statements. Once again, using these tools, we can actually see just what’s happening in our SQL.
However, having access to these fine troubleshooting tools is not enough. You also need to prepare for trouble ahead of time. You need to build troubleshooting capabilities into your program units. To that end, I'm going to show you how to do the following:
- Prevent trouble in the first place
- Prepare for trouble so you’re ready for troubleshooting when an error does occur
- Use SYS.DBMS_OUTPUT.put_line() to provide meaningful troubleshooting information after a program unit finishes executing
- Use a logging utility to provide meaningful troubleshooting information in real time
- Use a remote debugger to walk through a program unit as it executes
- Use EXPLAIN PLAN to troubleshoot the performance of your SQL statements
Let’s start out with some prevention techniques.
Prevention
If you want to prevent problems, then assume nothing. A handful of capabilities built into PL/SQL are nothing but an invitation for trouble. They are all centered on data types and implicit conversion. What’s implicit conversion? Let’s say you have number held in a varchar2 data type variable, v_value. You try assigning n_value, a number data type variable, that value with the following line of code:
n_value := v_value;
That should work, right? Yes, it should, but when it doesn’t, because you don’t actually have a numeric literal stored in variable v_value, the implicit data type conversion will raise an “unexpected” exception in your program unit, which will be hard to identify. By “identify,” I mean determine which line of code caused the error and why. Before we get to the solution for this problem, let’s look at another example.
This time, let’s say you want pass a date value to a function that will return the time in seconds since midnight, January 1, 1980. The function requires the date be passed as a varchar2 parameter in the form DD-MON-YY. Hey, no problem. Just pass the date variable like so:
...
d_value                               date := SYSDATE;
n_value                               number;

begin
  n_value := date_to_long(d_value);
...
Oracle’s default date format is DD-MON-YY, so it will work fine, right? Not exactly. If the current NLS_DATE_FORMAT for the session is DD-MON-YY (the default), it will work, but not if it is YYYYMMDD HH24MISS, as I set mine every time I log in to SQL*Plus.
What’s the solution? Use a combination of anchors, data type prefixes, and explicit conversions with blocking.
Anchors
I’ve already discussed anchors in Chapter 3. They are those wacky looking data type declarations that use the %TYPE or %ROWTYPE keyword. For example, here’s a list of variables declared in a manner so they match the data types of their corresponding table columns:
...
d_birth_date                          WORKER.birth_date%TYPE;
n_gender_type_id                      WORKER.gender_type_id%TYPE;
v_name                                WORKER.name%TYPE;
...
How does using anchors help prevent errors? Since each variable is anchored to the data type of the column in a table for which it will be used to temporarily hold a value, SQL and PL/SQL will not need to perform an implicit data type conversion when values are moved between the SQL and PL/SQL. Explicitly anchoring the data types of variables to their database counterparts prevents implicit conversions. Preventing implicit conversions prevents errors.
But if you’re going to anchor variables to their corresponding database columns or attributes, why use data type prefixes?
Data Type Prefixes
Data type prefixes help prevent errors in two ways. One is that when you declare a variable with a data type prefix, you’re documenting that you understand that the data type is a date, number, or varchar2. You’re saying, “Hey, I know what this is!” From that point in your coding forward, you can work with that assertion in place, to make sure that you’re not doing any implicit conversions. Preventing implicit conversions prevents errors.
Data type prefixes also make it clear that a data type conversion is necessary. If you find yourself coding away in the far recesses of your stored procedure, and you come to a line where you’re going to make an assignment and the data type prefixes are not the same, you know that you need to code an explicit data type conversion. In turn, coding an explicit data type conversion will prevent an implicit conversion. Again, preventing implicit conversions prevents errors.
So let’s look at how you code an explicit data type conversion.
Explicit Conversions
When you perform an explicit conversion, you can wrap your PL/SQL statements in their own PL/SQL block, or as I like to say, “block your code.” This allows you to catch any exceptions raised during the data type conversion, so you can do something intelligent with your newfound knowledge of the error.
You perform an explicit data type conversion by using one of the following functions:
- to_char(): Used to convert a date or number to a varchar2 data type
- to_date(): Used to convert a varchar2 to a date data type
- to_number(): Used to convert a varchar2 to a number data type
For example, to convert the value January 1, 1980 in variable d_date to a varchar2 data type for variable v_date in the form YYYYMMDD, you could use the following code:
v_date := to_char(d_date, 'YYYYMMDD'),
It’s unlikely that converting from a date (or number) to a varchar2 is ever going to cause an error as long as the receiving variable is declared large enough to hold the result, but, on the other hand, it’s very likely an error will occur if you convert from a varchar2 to a date, as in the following:
...
  begin
    d_date := to_date(v_date, 'YYYYMMDD'),
  exception
    when OTHERS then
      pl(SQLERRM);
      pl('Converting "'||v_date||'" to a date using format YYYYMMDD'),
      raise_application_error(-20001, SQLERRM||
       ' converting v_date to d_date'||
       ' in my_program_unit.method'),
  end;
...
![]() Note Way back in Chapter 1 I created a script named pl.prc that created a procedure called pl() that calls SYS.DBMS_OUTPUT.put_line() because I’m a lazy programmer who does not like to type SYS.DBMS_OUTPUT.put_line() everywhere I want to post a message.
Note Way back in Chapter 1 I created a script named pl.prc that created a procedure called pl() that calls SYS.DBMS_OUTPUT.put_line() because I’m a lazy programmer who does not like to type SYS.DBMS_OUTPUT.put_line() everywhere I want to post a message.
In this example, if the character representation of the date in variable v_date is not in the format YYYYMMDD, the to_date() function will raise an appropriate exception. The enclosing PL/SQL block will echo the details to the screen using put_line() via pl(), and then raise an application error that will report exactly where the error occurred in the program. This, in turn, will give you details as to why there was an error, so you are armed with good error information when you start troubleshooting, not some time after you are well into troubleshooting.
Just as to_date() and to_char() have formats they can use to specify the conversion parameters, so does to_number(). You can find the details on these formats in the freely available PL/SQL User’s Guide and Reference. You can find this and the rest of the Oracle documentation set online at http://otn.oracle.com.
So the proper use of the combination of anchors, data type prefixes, and explicit conversion functions will prevent many unexpected errors. Next, let’s see how you can better prepare for those that will still eventually arrive.
Preparation
Preparing for trouble ahead of time means preparing for troubleshooting ahead of time. How do you prepare for troubleshooting? You can do that by using blocks and bread crumbs.
You can block (wrap code in its own PL/SQL block) risky code ahead of time. When I say “risky code,” I mean
- Explicit data type conversions
- Movement of larger character strings to shorter character variables
- Singleton SQL statements
And what about bread crumbs? You know the fairy tale about Hansel and Gretel, right? They dropped bread crumbs on the ground as they walked through the forest so they could find their way back. Well, I want you to drop code on your listings as you type through your program, so you, too, can find your way back—back to the source of a problem.
Let’s start our discussion of blocking and bread crumbs with the former.
Blocking
I just showed you an example of blocking—wrapping a small piece of your PL/SQL in its own PL/SQL block in order to catch a raised exception and dealing with it—when I discussed explicit conversions. Now I’ll show you another example, where I move a larger character string into a smaller character variable.
It’s not uncommon when coding a data migration or data processing program to move a larger varchar2 variable into a smaller one. In such a situation, you can substring the larger variable in order to blindly truncate the larger string, or you can block the assignment so it raises an exception that you can deal with intelligently. Here’s an example of the latter:
declare

v_large                             varchar2(80);
v_small                             varchar2(30);

begin
  -- I'm assigning the variable in the executable section because
  -- assignment errors in the declaration section are also very hard
  -- to troubleshoot!
  -- 12345678901234567890123456789012345678901234567890123456789012345678
  v_large :=
    'This is a large string of characters, at least longer than 30 bytes!';

  -- Now let's raise an exception
  begin
    -- This won't work!  68 bytes won't fit in 30 bytes!
    v_small := v_large;
  exception
    when OTHERS then
      pl(SQLERRM);
      pl('Moving v_large, length '||
        to_char(length(v_large))||' into v_small.'),
      raise_application_error(-20001, SQLERRM||
       ' on v_small := v_large'||
       ' in my anonymous procedure'),
  end;

  pl(v_small);
end;
/
Executing this example results in the following output from SQL*Plus:
ORA-06502: PL/SQL: numeric or value error: character string buffer too small
Moving v_large, length 68 into v_small.
declare
*
ERROR at line 1:
ORA-20001: ORA-06502: PL/SQL: numeric or value error: character string
buffer too small on v_small := v_large in my anonymous procedure
ORA-06512: at line 23
As you can see from the output, the first three lines come from the pl() messages, while the last four come from the raised application error. The important point here is that without the “extra” information displayed by pl() or the raised application error, you wouldn’t know where in the program the assignment error occurred. So by “blocking” the code, you can use pl() or raise_application_error(), or both, in order to identify the location and reason for an error in your PL/SQL program.
This is invaluable information when troubleshooting. And, by now, you’re probably tired of me stating that, but I can’t impress on you enough how taking the time to add a few additional lines of PL/SQL code while you’re programming can later drastically reduce the amount of time it takes to test and troubleshoot your code.
So how about those bread crumbs?
Bread Crumbs
What do I mean by “bread crumbs?” I mean adding columns to staging tables, adding logging from your PL/SQL programs, and so on, as you initially write your code, in preparation for trouble. I suppose you may think, “That’s not a very optimistic way to think about my work.” However, programming is highly detailed logical work. Therefore, human beings are bound to make mistakes, since we are, by nature, emotionally “big picture” thinkers.
With that in mind, here are some ideas for leaving behind bread crumbs:
- Never use WHEN OTHERS THEN NULL in an exception-handling section. OK, how about almost never use WHEN OTHERS THEN NULL. It’s a rare occasion when you’ll actually want to suppress all errors and do nothing. Think about it. The only example I’ve ever run into is my errorless to_number_or_null() and to_date_or_null() functions. If there are errors, you need to know, and you need to fix your program’s logic so it deals with the errors intelligently, which means predictably.
- Never handle exceptions in a table package’s methods or a type’s methods. You want these to show up in the presentation layer so the end user (the programmer) can deal with them appropriately, which means predictably.
- Use SYS.DBMS_OUTPUT.put_line() to display success and error messages as the output of any data migration or data processing program unit.
- Use a procedure that utilizes pragma autonomous transaction to log your data migration or data processing program’s progress to a table so you can see where in the process your program is currently executing or later review the program’s execution.
- If you’re involved in building interfaces that migrate data from another system into yours, add columns to the interface’s staging tables, with the same names as the primary key columns in the destination tables. Then store the mappings used by your PL/SQL program (the primary key values) in the corresponding staging table columns when moving the data. This will allow you to see where your program moved the data.
You’ll see some of these ideas in action in Chapter 10, when I talk about the polymorphic use of method names among the various table package methods and type methods.
I’ll talk more about the use of put_line() and logging next. put_line() was the original means of debugging available to PL/SQL programmers, and even though it’s not as powerful as a full-blown debugger, it remains useful. Let’s see why.
After the Fact
Up to this point, you’ve seen the stored package procedure SYS.DBMS_OUTPUT.put_line() in action time and time again. Do you remember how, back in Chapter 2, I wrapped SYS.DBMS_OUTPUT.put_line() with a stored procedure named pl() so I wouldn’t have to type that long name every time I wanted to display something on the screen?
Just because put_line() is the simplest of debugging tools in your arsenal does not by any means make it useless. If fact, because of its simplicity, it will probably be the first tool you use to debug any PL/SQL program unit. However, keep in mind that when you use put_line(), you’re saying, “I can’t wait to find out what’s going on. OK, maybe I can.” Why? Because you don’t see any output from put_line() until your PL/SQL program unit has finished executing.
All the output from put_line() is stored in a temporary buffer until your PL/SQL program unit completes its execution, successfully or not. Then whatever tool you are using to execute your PL/SQL must query the DBMS_OUTPUT buffer and display your buffered messages on its screen. SQL*Plus does this for you automatically. However, if you were to write your own PL/SQL execution tool, you would need to program it to pull the messages from the DBMS_OUTPUT buffer after your PL/SQL program completed executing. The point is that put_line() messages appear after the fact.
In addition, you may be limited to the amount of message text you can output during any PL/SQL program unit’s execution. You set this value in SQL*Plus using this command:
set serveroutput on size 1000000;
The size you specify is the maximum amount of memory to use for the DBMS_OUTPUT buffer. It used to be that you could specify 1,000,000 bytes at most, as in the preceding line. However, now you can use an unlimited amount, but is that a good idea?
And then there’s the third limitation to put_line(). No single message can be more that 32,767 bytes in length. While that’s not much of limitation, large messages can easily use up the buffer, so you must be careful about how you specify your messages.
In the end, the value of the information you get from put_line() is going to be equal to the quality of the messages you add to your PL/SQL code. So let’s discuss that next.
Success Messages
It’s just as important to display messages of successful operation as it is those related to failure. If you’re writing a data processing or data migration program, it’s likely that you’ll leave your put_line() message in place. The thoughtful placement of success messages will narrow down the number of lines to investigate if an error does occur. For example, in Listing 7-1, I have five success messages. When an application error is raised on line 14, these messages will narrow the location of where the error actually took place.
Listing 7-1. An Example of Success Messages Narrowing the Scope of an Error, success.sql
01  rem success.sql
02  rem by Donald J. Bales on 2014-10-20
03  rem a script with success messages
04
05  declare
06
07  n_number                              number;
08
09  begin
10    pl('begin'),
11
12    n_number := -1;
13
14    pl('No error here!'),
15
16    n_number := 0;
17
18    pl('Still no error here!'),
19
20    n_number := 'one';
21
22    pl('After the error.'),
23
24    pl('end'),
25  exception
26    when OTHERS then
27      raise_application_error(-20000, SQLERRM||
28        ' on assigning a value to n_number'||
29        ' in success.sql'),
30  end;
31  /
When the script success.sql is executed, SQL*Plus outputs the following:
SQL> @success.sql
begin
No error here!
Still no error here!
declare
*
ERROR at line 1:
ORA-20000: ORA-06502: PL/SQL: numeric or value error: character to number
conversion error on assigning a value to n_number in success.sql
ORA-06512: at line 23
So, PL/SQL is reporting an ERROR at line 1:? That doesn’t make much sense. Yet, further down it reports an error at line 23. Hey, that doesn’t help much either. It’s just a line number by the exception, but it can’t be the error—it’s a blank line! Where did the error occur? It took place somewhere in the block of PL/SQL code in scope for the exception-handling section.
Regardless, if we rely on our success messages, we can see that the error took place some time after the message Still no error here! and before After the error, and thus narrow down our search to lines 19 through 21. That helps.
In addition to using success messages to narrow the scope of an error, I like to keep track of the number of inserts, updates, deletes, and selects, and then display them at the end of the procedure to verify that something has actually happened.
If, on the other hand, you’re writing table package or type service methods, you may use put_line() messages during the development process, and then manually comment them out before going into production. Why just comment them out and not delete them altogether? By leaving them commented out, you give support programmers a clue about a hard-to-understand or an error-prone section of code, and give them an opportunity to comment the put_line() back into play to help them debug your code in the future.
So how can you use failure messages?
In practice, I rely on method raise_application_error() to send a meaningful error number and message to the presentation layer. I simply number application error messages from -20000 to -20199, from top down in my package body. The messages include the variable SQLERRM, a very brief note about what I was doing in the section of code, and the package and/or function or procedure name as a location of the error. The description in the message needs to be brief because raise_application_error() allows a maximum message size of only 2,048 bytes (255 bytes in earlier versions).
Since my message size is limited by raise_application_error(), I supplement the error message with extra lines of output using put_line() before the call to raise_application_error(). With the “extra” lines of output, I list the values of variables. By including the extra lines of error information, I can call the PL/SQL program unit that raised an error message with the same values as the presentation layer in order to re-create and then correct my code defect.
Now that you have some idea how to go about using put_line(), let’s see you put it to use.
It’s Your Turn to Use put_line( )
It’s your turn to put your knowledge of put_line() and raise_application_error() to work by following these steps.
- Write an anonymous PL/SQL procedure that adds a number in a number variable to a “number” in a varchar2 variable together. Here’s the hitch: you should spell out the second number in the varchar2 variable so it will raise an exception when added.
- “Block” the line of code where you do your addition and then catch the error, list the contents of the variables with pl(), and then raise an application error.
- Save your script as failure.sql.
- Execute your script, @failure.sql.
Did your script and results turn out similar to mine? Listing 7-2 is my solution to this exercise.
![]() Note You won’t get any output if you haven’t executed the SQL*Plus command set serveroutput on size 1000000;, which I have already placed in the script login.sql that SQL*Plus executes every time it starts.
Note You won’t get any output if you haven’t executed the SQL*Plus command set serveroutput on size 1000000;, which I have already placed in the script login.sql that SQL*Plus executes every time it starts.
Listing 7-2. An Example of Using put_line( ) to List Variable Values, failure.sql
01  rem failure.sql
02  rem by Donald J. Bales on 2014-10-20
03  rem a script that fails on purpose
04
05  declare
06
07  n_number                              number;
08  v_number                              varchar2(30);
09
10  begin
11    pl('begin'),
12
13    pl('before n_number assignment'),
14
15    n_number := 1;
16
17    pl('after n_number assignment'),
18
19    pl('before v_number assignment'),
20
21    v_number := 'two';
22
23    pl('after v_number assignment'),
24
25    pl('before addition'),
26    begin
27      pl('n_number + v_number = '||to_char(n_number + to_number(v_number)));
28    exception
29      when OTHERS then
30        pl('n_number = '||to_char(n_number));
31        pl('v_number = '||v_number);
32        raise_application_error(-20000, SQLERRM||
33          ' on n_number + v_number'||
34          ' in failure.sql'),
35    end;
36    pl('after addition'),
37
38    pl('end'),
39  end;
40  /
And here are the results from executing the failure.sql script:
SQL> @failure.sql
begin
before n_number assignment
after n_number assignment
before v_number assignment
after v_number assignment
before addition
n_number = 1
v_number = two
declare
*
ERROR at line 1:
ORA-20000: ORA-06502: PL/SQL: numeric or value error: character to
number conversion error on n_number + v_number in failure.sql
ORA-06512: at line 28
This time, since I blocked the one line where I’m performing the addition, the line number for the error reported by PL/SQL is fairly accurate. Still, the success messages do more to narrow the location of the error than does the error message from PL/SQL’s raise_application_error(). In addition, since I use pl() to display the variable values, it’s fairly easy to discern the reason for the program’s error.
But what happens if you have a long-running procedure, and you want to get some ongoing feedback about its success? Then it’s time to take advantage of logging from another session.
As It Happens
By utilizing the PL/SQL pragma autonomous transaction, you can build your own logging utility that can do the following:
- Insert and commit messages into a logging table from your PL/SQL program unit without committing your PL/SQL program’s own transaction context
- Select the committed messages from a log table immediately after they are written from any other session
In essence, it’s as if you’re saying, “No, I’ve changed my mind. I can’t wait after all.” This technique of logging from another transaction context using an autonomous transaction allows you to see what’s happening in your PL/SQL program unit almost in real time. You’ll start by building your own logging utility, and then putting it to work in an example. First, you need a table to store messages.
A DEBUG Table
Should I build a relational example or an object-relational example? This time I’ll build an object-relational example, and then you’ll build its relational equivalent. So what do I need to store about a message? How about the list of attributes in Table 7-1?
Table 7-1. Attributes for a Debugging Message Table
Attribute | Description |
|---|---|
id | A primary key column for the object table |
text | The message to log from the calling PL/SQL program unit |
unique_session_id | The unique session ID from the calling PL/SQL program unit |
insert_user | The user from the calling PL/SQL program unit |
insert_date | The date and time (SYSDATE) from the calling PL/SQL program unit |
And don’t forget about the behavior! What will my debug TYPE or package need to do for me? How about the list of behaviors in Table 7-2?
Table 7-2. Behaviors for a Debugging Message Table
Behavior | Description |
|---|---|
get_id() | Allocate a primary key from the corresponding sequence |
Null constructor | Return an object initialized to NULL values |
Convenience constructor | Return an object initialized and ready for INSERT |
Map method | Return a value to sort an object by |
enable() | Enable set_text() for the specified program unit |
disable() | Disable set_text() for the specified program unit |
set_text() | Log the text to the debug table |
Since I’m building the object-relational version, I need to create the TYPE first, the table second, and then the TYPE BODY last. Listing 7-3 is my source code for the object TYPE DEBUG_O.
Listing 7-3. Type DEBUG’s Specification, ops.debug.tps
01  create type  DEBUG as object (
02  /*
03  debug.tps
04  by Donald Bales on 2014-10-20
05  Type DEBUG's specification:
06  A type for logging debug information
07  */
08  id                                    number(38),
09  text                                  varchar2(256),
10  unique_session_id                     varchar2(24),
11  insert_user                           varchar2(30),
12  insert_date                           date,
13  -- Get the next primary key value
14  STATIC FUNCTION get_id
15  return                                number,
16  -- A NULL values constructor
17  CONSTRUCTOR FUNCTION debug(
18  self                           in out nocopy debug)
19  return                                self as result,
20  -- A convenience constructor
21  CONSTRUCTOR FUNCTION debug(
22  self                           in out nocopy debug,
23  ain_id                         in     number,
24  aiv_text                       in     varchar2)
25  return                                self as result,
26  -- Override the default constructor
27  CONSTRUCTOR FUNCTION debug(
28  self                           in out nocopy debug,
29  id                             in     number,
30  text                           in     varchar2,
31  unique_session_id              in     varchar2,
32  insert_user                    in     varchar2,
33  insert_date                    in     date)
34  return                                self as result,
35  -- Write to the debug object table
36  STATIC PROCEDURE set_text(
37  aiv_program_unit               in     varchar2,
38  aiv_text                       in     varchar2),
39  -- A map function
40  MAP MEMBER FUNCTION to_map
41  return                                number
42  ) not final;
43  /
44  @se.sql
Let’s take a close look at Listing 7-3.
- Lines 8 through 12 declare the five attributes for the TYPE.
- Lines 14 and 15 declare a static function get_id() to allocate the next primary key value. Since it’s a static method, the function is executed using the TYPE rather than an instance of the TYPE.
- Lines 17 and 18 declare a constructor that returns an instance of the TYPE initialized to NULL values.
- Lines 21 through 25 declare a convenience constructor that will return a fully initialized instance of the TYPE, ready to be inserted into the DEBUGS table.
- Lines 27 through 34 declare a constructor that will override the default constructor definition provided by SQL.
- Lines 36 through 38 declare static procedure set_text(), which will insert an entry into the DEBUGS table using an autonomous transaction. This will allow me to commit the log entry without committing anything in the session where I’m using this method to log debug information.
- Lines 40 and 41 declare a MAP method used by SQL to compare and sort objects of this TYPE.
The next step in the development process is to create an object table based on the TYPE. You may have thought that I needed to code the TYPE’s implementation first. In this case, I’m going to reference the object table in the TYPE BODY, so I must create the table first. Listing 7-4 is the DDL for creating an object table based on TYPE DEBUG.
Listing 7-4. DDL for Creating an Object Table Based on Type DEBUG, ops.debugs.tab
01  rem debugs.tab
02  rem by Donald Bales on 2014-10-20
03  rem Create debugging message table
04
05  -- drop table DEBUGS;
06  create table DEBUGS of DEBUG;
07
08  alter  table DEBUGS add
09  constraint   DEBUGS_PK
10  primary key (
11  id )
12  using index;
13
14  -- drop sequence DEBUGS_ID;
15  create sequence DEBUGS_ID
16  start with 1 order;
17
18  execute SYS.DBMS_STATS.gather_table_stats(USER, 'DEBUGS'),
19
20  grant all on DEBUGS to PUBLIC;
Let’s look at Listing 7-4 line by line:
- Line 6 creates object table DEBUGS based on TYPE DEBUG.
- Lines 8 through 12 create a primary key on the object table DEBUGS.
- Lines 15 through 16 declare a sequence to be used to allocate primary key values for table DEBUGS.
- On line 18, I analyze table DEBUGS to give the Optimizer some initial statistics to work with.
- On line 20, I grant all privileges to PUBLIC so anyone on the database can use the debug table facility I’m creating.
Now that the table exists, I can compile the TYPE BODY without dependency errors. Listing 7-5 is the TYPE BODY for TYPE DEBUG.
Listing 7-5. Type DEBUG’s Implementation, debug.tpb
001  create or replace type body DEBUG as
002  /*
003  debug.tpb
004  by Donald Bales on 2014-10-20
005  Type DEBUG's implementation
006  A type for logging debug information
007  */
008
009  STATIC FUNCTION get_id
010  return                                number is
011
012  n_id                                  number;
013
014  begin
015    select DEBUGS_ID.nextval
016    into   n_id
017    from   SYS.DUAL;
018
019    return n_id;
020  end get_id;
021
022
023  CONSTRUCTOR FUNCTION debug(
024  self                           in out nocopy debug)
025  return                                self as result is
026
027  begin
028    pl('debug(zero param)'),
029    self.id                := NULL;
030    self.text              := NULL;
031    self.unique_session_id := NULL;
032    self.insert_user       := NULL;
033    self.insert_date       := NULL;
034
035    return;
036  end debug;
037
038
039  CONSTRUCTOR FUNCTION debug(
040  self                           in out nocopy debug,
041  ain_id                         in     number,
042  aiv_text                       in     varchar2)
043  return                                self as result is
044
045  begin
046    pl('debug(two params)'),
047    self.id                := ain_id;
048    self.text              := aiv_text;
049    self.unique_session_id := SYS.DBMS_SESSION.unique_session_id;
050    self.insert_user       := USER;
051    self.insert_date       := SYSDATE;
052
053    return;
054  end debug;
055
056
057  -- Override the default constructor.  To do so, you must
058  -- use the same attributes names for the parameter names
059  -- and use them in the order specified in the type spec.
060  CONSTRUCTOR FUNCTION debug(
061  self                           in out nocopy debug,
062  id                             in     number,
063  text                           in     varchar2,
064  unique_session_id              in     varchar2,
065  insert_user                    in     varchar2,
066  insert_date                    in     date)
067  return                                self as result is
068
069  begin
070    pl('debug(five params)'),
071    self.id                := id;
072    self.text              := text;
073    self.unique_session_id := unique_session_id;
074    self.insert_user       := insert_user;
075    self.insert_date       := insert_date;
076
077    return;
078  end debug;
079
080
081  STATIC PROCEDURE set_text(
082  aiv_program_unit               in     varchar2,
083  aiv_text                       in     varchar2) is
084
085  pragma autonomous_transaction;
086
087  v_text                                varchar2(256);
088
089  begin
090    v_text := substrb(aiv_program_unit||': '||aiv_text, 1, 256);
091
092    insert into DEBUGS
093    values (DEBUG(DEBUGS_ID.nextval, aiv_text));
094  -- A defect in SQL prevented me from using the
095  -- function get_id() as follows:
096  --  values (DEBUG(DEBUG.get_id(), aiv_text));
097    commit;
098  end set_text;
099
100
101  MAP MEMBER FUNCTION to_map
102  return                                number is
103
104  begin
105    return id;
106  end to_map;
107
108
109  end;
110  /
111  @be.sql DEBUG
Listing 7-5 doesn’t have any new code, so I’ll just point out two details. The first centers around the second constructor found on lines 39 through 51. In this constructor, I should be able to code line 47 to read as follows:
self.id := DEBUG.get_id();
However, in SQL the constructor is called repeatedly, seemingly the number of times that there are attributes in the TYPE. Accordingly, SQL calls the constructor for this TYPE five times. I consider this a defect. It causes extra CPU and memory consumption, along with the wasted allocation of sequence values that will not be used if implemented in a reasonably object-oriented fashion. I’ve left in some troubleshooting pl() statements to prove that the constructors are called multiple times. To work around this defect, I’ve added parameter ain_id on line 41, and used the sequence directly in the SQL—for example, on line 93.
How long it will take Oracle to get around to fixing this problem is anyone’s guess. I first pointed out this error in 2006, and it’s still not fixed, so for the time being, I’m coding the convenience constructor for two parameters instead of one. So, I’ve just shown you an example of using pl() to help troubleshoot a problem.
The second item to notice is the use of the following on line 85:
pragma autonomous_transaction;
This effectively executes method set_text() in its own session, so committing the inserted debugging information will not affect the transaction state in the calling program unit.
My next step is to test what I’ve coded. To do that, I actually have three listings. Listing 7-6 is a test unit for TYPE DEBUG.
Listing 7-6. Type DEBUG’s Test Unit, ops.debug.sql
01  rem debug.sql
02  rem by Donald J. Bales on 2014-10-20
03  rem A test unit for type DEBUG
04
05  declare
06
07  begin
08    DEBUG.set_text('DEBUG.SQL', 'before the loop'),
09    for i in 1..10 loop
10      DEBUG.set_text('DEBUG.SQL', 'loop '||to_char(i)||' before sleep'),
11      SYS.DBMS_LOCK.sleep(3);
12      DEBUG.set_text('DEBUG.SQL', 'loop '||to_char(i)||' after sleep'),
13    end loop;
14    DEBUG.set_text('DEBUG.SQL:', 'after the loop'),
15  end;
16  /
When executed, Listing 7-6 will log debug messages to object table DEBUGS. But before you execute it, you may want to determine your session’s unique ID so you can specify that value from a second session in order to filter the debug messages that appear as your program executes.
Listing 7-7 is a very short anonymous PL/SQL program to get your session’s unique ID. Then when you want to see what’s going on with the program from which you’re debug logging, you can specify your first session’s unique session ID on the SQL*Plus command line when you execute the SQL query from Listing 7-8.
Listing 7-7. An Example of How to Get Your Unique Session ID, usi.sql
1  rem usi.sql
2  rem by Donald J. Bales on 2014-10-20
3  rem Show me my unique session ID
4
5  execute pl('unique_session_id='||SYS.DBMS_SESSION.unique_session_id);
For example, if I execute usi.sql in SQL*Plus from my first session, session 1, it reports the following:
SQL> @usi.sql
unique_session_id= 000487240001

PL/SQL procedure successfully completed.
Next, I open a second session, session 2. I execute the following at the SQL> prompt:
@debug_a_session.sql 000487240001
Of course, I get no rows selected because I haven’t started my test unit in session 1. So I go back to session 1 and execute the following at the SQL> prompt:
@debug.sql
Then I switch back to session 2 and simply type a forward slash at the SQL> prompt to see the PL/SQL program in session 1’s progress:
SQL> @debug_a_session.sql 000487240001
old   4: where  unique_session_id = upper('&unique_session_id')
new   4: where  unique_session_id = upper('000487240001')

no rows selected
SQL> /
old   4: where  unique_session_id = upper('&unique_session_id')
new   4: where  unique_session_id = upper('000487240001')

        ID TEXT
---------- ----------------------------------------------------
       203 before the loop
       204 loop 1 before sleep
       205 loop 1 after sleep
       206 loop 2 before sleep
       207 loop 2 after sleep
       208 loop 3 before sleep
       209 loop 3 after sleep
       210 loop 4 before sleep
       211 loop 4 after sleep
       212 loop 5 before sleep
       213 loop 5 after sleep
       214 loop 6 before sleep

12 rows selected.
SQL> /
old   4: where  unique_session_id = upper('&unique_session_id')
new   4: where  unique_session_id = upper('000487240001')

        ID TEXT
---------- ----------------------------------------------------
       203 before the loop
       204 loop 1 before sleep
       205 loop 1 after sleep
       206 loop 2 before sleep
       207 loop 2 after sleep
       208 loop 3 before sleep
       209 loop 3 after sleep
       210 loop 4 before sleep
       211 loop 4 after sleep
       212 loop 5 before sleep
       213 loop 5 after sleep
       214 loop 6 before sleep
       215 loop 6 after sleep
       216 loop 7 before sleep
       217 loop 7 after sleep
       218 loop 8 before sleep
       219 loop 8 after sleep
       220 loop 9 before sleep
       221 loop 9 after sleep
       222 loop 10 before sleep
       223 loop 10 after sleep
       224 after the loop

22 rows selected.
As you can see from the preceding output, I reexecuted the SQL SELECT statement three times (using the forward slash, /) during the 33 seconds it took to run the test unit, and I got more debug information as the program unit executed.
If you examine Listing 7-8, which I used to query the table DEBUGS, you can see that I am limiting the information to a specified unique session ID and for the last ten minutes (the expression (10/(24*60)) means ten minutes).
Listing 7-8. An Example of How to Check on Progress in Real Time, ops.debug_a_session.sql
01  rem debug_a_sesion.sql
02  rem by Donald J. Bales on 2014-10-20
03  rem Query DEBUGS uing the specified unique session ID
04
05  define unique_session_id=&1;
06
07  select id,
08         text
09  from   DEBUGS
10  where  unique_session_id = upper('&unique_session_id')
11  and    insert_date       > SYSDATE - (10/(24*60))
12  order by id;
A debug table can be very handy. It gives you the kind of information you get from put_line(), but as it happens. Now you can just add the following command to your code as needed:
DEBUG.set_text(<aiv_program_unit>, <aiv_text>);
However, you’ll need to wrap set_text() in an IF statement if you want to turn it on or off as needed. I have a better solution. How about a debug package?
I’m going to create a DEBUGGER package in order to extend the table DEBUGS and its underlying TYPE DEBUG’s functionality. I have two methods that I wasn’t able to add to TYPE DEBUG because there’s no way to maintain temporary state in a TYPE’s BODY. That’s not the case for a package, so I’m going to create a “role” package DEBUGGER for table DEBUGS, which will implement methods disable(), enable(), and a conditional set_text().
Method enable() will add a specified program unit to a list of program units for which to log debug information to table DEBUGS. If a program calls DEBUGGER.enable(), passing its name, then any calls to DEBUGGER.set_text() will be logged to table DEBUGS. If a program doesn’t enable debug logging, nothing will happen when it calls DEBUGGER.set_text(). Conversely, method DEBUGGER.disable() will remove a specified program unit from the “debug logging enabled” list. Listing 7-9 is the package specification, and Listing 7-10 is its corresponding package body.
Listing 7-9. A Role Package Specification for Object Table DEBUGS, ops.debugger.pks
01  create or replace package DEBUGGER as
02  /*
03  debugger.pks
04  by Donald J. Bales on 2014-10-20
05  Object Table DEBUGS's package
06  */
07
08  -- Disable debug logging for the specified program unit
09  PROCEDURE disable(
10  aiv_program_unit               in     varchar2);
11
12  -- Enable debug logging for the specified program unit
13  PROCEDURE enable(
14  aiv_program_unit               in     varchar2);
15
16  -- Conditionally log the debug information for the specified
17  -- program unit, if it is enabled
18  PROCEDURE set_text(
19  aiv_program_unit               in     varchar2,
20  aiv_text                       in     DEBUGS.text%TYPE);
21
22
23  end DEBUGGER;
24  /
25  @se.sql DEBUGGER;
Listing 7-10. A Role Package Body for Object Table DEBUGS, ops.debugger.pkb
01  create or replace package body DEBUGGER as
02  /*
03  debugger.pkb
04  by Donald J. Bales on 2014-10-20
05  Object Table DEBUGS' package
06  */
07
08  -- Declare a table type and then table to hold the
09  -- enabled program units
10  TYPE program_unit_table is table of varchar2(1)
11  index by varchar2(30);
12
13  t_program_unit                        program_unit_table;
14
15
16  PROCEDURE disable(
17  aiv_program_unit               in     varchar2) is
18
19  v_program_unit                        varchar2(30);
20
21  begin
22    v_program_unit := upper(aiv_program_unit);
23
24    if t_program_unit.exists(v_program_unit) then
25      t_program_unit.delete(v_program_unit);
26    end if;
27  end disable;
28
29
30  PROCEDURE enable(
31  aiv_program_unit               in     varchar2) is
32
33  v_program_unit                        varchar2(30);
34
35  begin
36    v_program_unit := upper(aiv_program_unit);
37
38    if not t_program_unit.exists(v_program_unit) then
39      t_program_unit(v_program_unit) := NULL;
40    end if;
41  end enable;
42
43
44  PROCEDURE set_text(
45  aiv_program_unit               in     varchar2,
46  aiv_text                       in     DEBUGS.text%TYPE) is
47
48  v_program_unit                        varchar2(30);
49
50  begin
51    v_program_unit := upper(aiv_program_unit);
52
53    if t_program_unit.exists(v_program_unit) then
54      DEBUG.set_text(v_program_unit, aiv_text);
55    end if;
56  end set_text;
57
58
59  end DEBUGGER;
60  /
61  @be.sql DEBUGGER;
Let’s take a detailed look at Listing 7-10:
- Lines 10 and 11 declare a PL/SQL table TYPE indexed by a varchar2. You can’t do this with older versions of Oracle, but you can now. I’m taking advantage of that fact, so PL/SQL can do the work instead of me writing a lot more code.
- Line 13 declares an “enabled program unit list” table, which will temporarily hold a list of program units for which to log debug information to table DEBUGS.
- Lines 16 through 27 implement method disable(). This method looks to see if an entry exists in the “enabled program unit” PL/SQL table for the specified program unit. If it does exist, it deletes the PL/SQL table entry, effectively disabling debug logging for the specified program unit.
- Lines 30 through 41 implement the enable() method. This method looks to see if an entry exists in the “enabled program unit” PL/SQL table for the specified program unit. If it does not exist, the method adds an entry to the PL/SQL table, effectively enabling debug logging for the specified program unit.
- Lines 44 through 56 implement the set_text() method. This method simply calls the autonomous procedure set_text() in the underlying TYPE DEBUG if the program unit in question is enabled.
“Big deal—so what?” you say. The implications are staggering. You can add DEBUGGER.set_text() calls to your long-running or complicated PL/SQL programs and leave them there to be enabled as needed when trouble rears its ugly head!
Listing 7-11 is a test unit for package DEBUG_OTS that turns debug logging on then off, repeating the same test twice.
Listing 7-11. A Test Unit for Package DEBUGGER, ops.debugger.sql
01  rem debugger.sql
02  rem by Donald J. Bales on 2014-10-20
03  rem A test unit for package DEBUGGER
04
05  declare
06
07  begin
08    -- Enable debug output
09    DEBUGGER.enable('DEBUGGER.SQL'),
10    -- Test
11    DEBUGGER.set_text('DEBUGGER.SQL', 'before the loop '),
12    for i in 1..10 loop
13      DEBUGGER.set_text('DEBUGGER.SQL', 'loop '||to_char(i)||' before sleep'),
14      SYS.DBMS_LOCK.sleep(3);
15      DEBUGGER.set_text('DEBUGGER.SQL', 'loop '||to_char(i)||' after sleep'),
16    end loop;
17    DEBUGGER.set_text('DEBUGGER.SQL', 'after the loop '),
18
19    -- Disable debug output
20    DEBUGGER.disable('DEBUGGER.SQL'),
21    -- Test
22    DEBUGGER.set_text('DEBUGGER.SQL', 'before the loop '),
23    for i in 1..10 loop
24      DEBUGGER.set_text('DEBUGGER.SQL', 'loop '||to_char(i)||' before sleep'),
25      -- SYS.DBMS_LOCK.sleep(3);
26      DEBUGGER.set_text('DEBUGGER.SQL', 'loop '||to_char(i)||' after sleep'),
27    end loop;
28    DEBUGGER.set_text('DEBUGGER.SQL', 'after the loop '),
29  end;
30  /
Given that you have your unique session ID and start debugger.sql in session 1, and then switch to session 2 and query table DEBUGS with debug_a_session.sql, you’ll see output like this:
SQL> @debug_a_session.sql 000487240001
old   4: where  unique_session_id = upper('&unique_session_id')
new   4: where  unique_session_id = upper('000487240001')

        ID TEXT
---------- ----------------------------------------------------
       225 before the loop
       226 loop 1 before sleep
       227 loop 1 after sleep
       228 loop 2 before sleep

4 rows selected.
SQL> /
old   4: where  unique_session_id = upper('&unique_session_id')
new   4: where  unique_session_id = upper('000487240001')

        ID TEXT
---------- ----------------------------------------------------
       225 before the loop
       226 loop 1 before sleep
       227 loop 1 after sleep
       228 loop 2 before sleep
       229 loop 2 after sleep
       230 loop 3 before sleep
       231 loop 3 after sleep
       232 loop 4 before sleep
       233 loop 4 after sleep
       234 loop 5 before sleep
       235 loop 5 after sleep
       236 loop 6 before sleep
       237 loop 6 after sleep
       238 loop 7 before sleep
       239 loop 7 after sleep
       240 loop 8 before sleep
       241 loop 8 after sleep
       242 loop 9 before sleep
       243 loop 9 after sleep
       244 loop 10 before sleep
       245 loop 10 after sleep
       246 after the loop

22 rows selected.
In the preceding output, you see the first half of the test unit where the program unit was enabled, but not the second half of the program unit where it was disabled. This means you can turn debug logging on and off programmatically as needed. That’s a powerful troubleshooting tool!
Now that you’ve seen me do the object-relational version, it’s your turn to do the relational version.
It’s Your Turn to Use Debug Logging
Your assignment is to create a relational debug table and table package that incorporate the same functionality as the object-relational example I just showed you. Yes, you should also include the test unit. Follow these steps.
- Write a DDL script to create a relational table called DEBUGS with the same columns as the attributes found in TYPE DEBUG.
- Save your script as rps.debugs.tab.
- Create your table DEBUGS by executing script @rps.debugs.tab.
- Write a DDL script to create a table package specification for DEBUG. You should have three methods: disable(), enable(), and set_text().
- Save your script as rps.debug.pks.
- Create your package specification by executing script @rps.debug.pks.
- Write a DDL script to create a table package body for DEBUG. Remember to use the pragma autonomous_transaction; in set_text()!
- Save your script as rps.debug.pkb.
- Create your package body by executing script @rps.debug.pkb.
- Write a test unit for package DEBUG, saving your script as rps.debug.sql.
- Open two SQL*Plus sessions. Get the unique session ID from the first session by executing script usi.sql. Then start your test unit in the first session by executing script @rps.debug.sql.
- Quickly switch to session 2, and then execute a SELECT statement against table DEBUGS so you can see the output of your test unit as it executes.
Listings 7-12 through 7-15 are my solution to this exercise. Listing 7-12 is a script to create a relational table for debug logging output.
Listing 7-12. A DDL Script to Create Table DEBUGS, rps.debugs.tab
01  rem debugs.tab
02  rem by Donald Bales on 2014-10-20
03  rem Create debugging message table
04
05  --drop   table DEBUGS;
06  create table DEBUGS (
07  id                             number                         not null,
08  text                           varchar2(256),
09  unique_session_id              varchar2(24)                   not null,
10  insert_user                    varchar2(30)  default USER     not null,
11  insert_date                    date          default SYSDATE  not null );
12
13  alter  table DEBUGS add
14  constraint   DEBUGS_PK
15  primary key (
16  id )
17  using index;
18
19  --drop   sequence DEBUGS_ID;
20  create sequence DEBUGS_ID
21  start with 1 order;
22
23  execute SYS.DBMS_STATS.gather_table_stats(USER, 'DEBUGS'),
24
25  grant all on DEBUGS to PUBLIC;
Listing 7-13 is the specification for the table package for table DEBUG. I’ve declared three methods: disable(), enable(), and conditional set_text().
Listing 7-13. A DDL Script to Create Table Package Spec DEBUG, rps.debug.pks
01  create or replace package DEBUG as
02  /*
03  debug.pks
04  by Donald J. Bales on 2014-10-20
05  Table DEBUGS's package
06  */
07
08  n_id                                  number := 0;
09
10  -- Get the next primary key value for the table
11  FUNCTION get_id
12  return                                DEBUGS.id%TYPE;
13
14  -- Enable debug output for the specified program unit
15  PROCEDURE enable(
16  aiv_program_unit               in     varchar2);
17
18  -- Disable debug output for the specified program unit
19  PROCEDURE disable(
20  aiv_program_unit               in     varchar2);
21
22  -- Log debug output if enabled for the specified program unit
23  PROCEDURE set_text(
24  aiv_program_unit               in     varchar2,
25  aiv_text                       in     DEBUGS.text%TYPE);
26
27
28  end DEBUG;
29  /
30  @se.sql DEBUG
Listing 7-14 is the body for table package DEBUG. In it, I’ve declared a PL/SQL table TYPE and PL/SQL table to hold the “enabled program units,” and then implemented methods disable(), enable(), and set_text().
Listing 7-14. A DDL Script to Create Table Package Body DEBUG, rps.debug.pkb
01  create or replace package body DEBUG as
02  /*
03  debug.pkb
04  by Donald J. Bales on 2014-10-20
05  Table DEBUGS's package
06  */
07
08  -- A table to hold the list of program units for which
09  -- to store debug information
10  TYPE program_unit_table is table of varchar2(1)
11  index by varchar2(30);
12
13  t_program_unit                        program_unit_table;
14
15
16  FUNCTION get_id
17  return                                DEBUGS.id%TYPE is
18
19  n_id                                  DEBUGS.id%TYPE;
20
21  begin
22    select DEBUGS_ID.nextval
23    into   n_id
24    from   SYS.DUAL;
25
26    return n_id;
27  end get_id;
28
29
30  PROCEDURE disable(
31  aiv_program_unit               in     varchar2) is
32
33  v_program_unit                        varchar2(30);
34
35  begin
36    v_program_unit := upper(aiv_program_unit);
37
38    if t_program_unit.exists(v_program_unit) then
39      t_program_unit.delete(v_program_unit);
40    end if;
41  end disable;
42
43
44  PROCEDURE enable(
45  aiv_program_unit               in     varchar2) is
46
47  v_program_unit                        varchar2(30);
48
49  begin
50    v_program_unit := upper(aiv_program_unit);
51
52    if not t_program_unit.exists(v_program_unit) then
53      t_program_unit(v_program_unit) := NULL;
54    end if;
55  end enable;
56
57
58  PROCEDURE set_text(
59  aiv_program_unit               in     varchar2,
60  aiv_text                       in     DEBUGS.text%TYPE) is
61
62  pragma autonomous_transaction;
63
64  v_program_unit                        varchar2(30);
65
66  begin
67    v_program_unit := upper(aiv_program_unit);
68
69    if t_program_unit.exists(v_program_unit) then
70      insert into DEBUGS (
71             id,
72             text,
73             unique_session_id )
74      values (
75             DEBUG.get_id(),
76             substrb(v_program_unit||': '||aiv_text, 1, 256),
77             SYS.DBMS_SESSION.unique_session_id);
78    end if;
79    commit;
80  end set_text;
81
82
83  end DEBUG;
84  /
85  @be.sql DEBUG
In Listing 7-14, method set_text() logs information to table DEBUGS only if the specified program unit is “enabled.” Listing 7-15 is a test unit for table package DEBUG.
Listing 7-15. An Anonymous PL/SQL Script to Test Table Package DEBUG, rps.debug.sql
01  rem debug.sql
02  rem by Donald J. Bales on 2014-10-20
03  rem Test unit for package DEBUG
04
05  declare
06
07  v_program_unit                        varchar2(30) :=
08    'debug.sql';
09
10  begin
11    DEBUG.enable(v_program_unit);
12    DEBUG.set_text(v_program_unit, 'before the loop '),
13    for i in 1..1000 loop
14      DEBUG.set_text(v_program_unit, 'loop '||to_char(i)||' before sleep'),
15      SYS.DBMS_LOCK.sleep(3);
16      DEBUG.set_text(v_program_unit, 'loop '||to_char(i)||' after sleep'),
17    end loop;
18    DEBUG.set_text(v_program_unit, 'after the loop '),
19    DEBUG.disable(v_program_unit);
20    DEBUG.set_text(v_program_unit, 'before the loop '),
21    for i in 1..1000 loop
22      DEBUG.set_text(v_program_unit, 'loop '||to_char(i)||' before sleep'),
23      -- SYS.DBMS_LOCK.sleep(3);
24      DEBUG.set_text(v_program_unit, 'loop '||to_char(i)||' after sleep'),
25    end loop;
26    DEBUG.set_text(v_program_unit, 'after the loop '),
27  end;
28  /
The following is the output from a query against the debug table DEBUGS:
SQL> select * from debugs;
        ID TEXT
---------- ------------------------------------------------
       313 debug.sql: before the loop
       314 debug.sql: loop 1 before sleep
       315 debug.sql: loop 1 after sleep
       316 debug.sql: loop 2 before sleep
SQL> /
        ID TEXT
---------- ------------------------------------------------
       313 debug.sql: before the loop
       314 debug.sql: loop 1 before sleep
       315 debug.sql: loop 1 after sleep
       316 debug.sql: loop 2 before sleep
SQL> /
        ID TEXT
---------- ------------------------------------------------
       313 debug.sql: before the loop
       314 debug.sql: loop 1 before sleep
       315 debug.sql: loop 1 after sleep
       316 debug.sql: loop 2 before sleep
       317 debug.sql: loop 2 after sleep
       318 debug.sql: loop 3 before sleep
       319 debug.sql: loop 3 after sleep
       320 debug.sql: loop 4 before sleep
       321 debug.sql: loop 4 after sleep
       322 debug.sql: loop 5 before sleep
       323 debug.sql: loop 5 after sleep
       324 debug.sql: loop 6 before sleep

12 rows selected.
SQL> /
        ID TEXT
---------- ------------------------------------------------
       313 debug.sql: before the loop
       314 debug.sql: loop 1 before sleep
       315 debug.sql: loop 1 after sleep
       316 debug.sql: loop 2 before sleep
       317 debug.sql: loop 2 after sleep
       318 debug.sql: loop 3 before sleep
       319 debug.sql: loop 3 after sleep
       320 debug.sql: loop 4 before sleep
       321 debug.sql: loop 4 after sleep
       322 debug.sql: loop 5 before sleep
       323 debug.sql: loop 5 after sleep
       324 debug.sql: loop 6 before sleep
       325 debug.sql: loop 6 after sleep
       326 debug.sql: loop 7 before sleep
       327 debug.sql: loop 7 after sleep
       328 debug.sql: loop 8 before sleep
       329 debug.sql: loop 8 after sleep
       330 debug.sql: loop 9 before sleep
       331 debug.sql: loop 9 after sleep
       332 debug.sql: loop 10 before sleep
       333 debug.sql: loop 10 after sleep
       334 debug.sql: after the loop

22 rows selected.
As you can see from this output, you are able to view the progress of the test unit as it executes. Armed with this troubleshooting tool, you can monitor your long-running or short-running data processing or data migration programs.
In practice, I’ve even found this technique useful in some table package or TYPE methods that are called by the presentation layer. One example is when I worked with a table package that built SQL statements dynamically using information from the database, and then passed them back to the presentation layer. If a user got an error, I could see what SQL was passed back to his web page by looking in the debug table in the database. It didn’t take long for me to figure out that I had some data-entry errors in the tables used to build the dynamic queries, but it would have been next to impossible to identify the problem in the presentation layer.
As an alternative to debug logging, you may decide to use package SYS.DBMS_TRACE to trace the execution of a session to a file that you can later examine, line by line, or using a utility like TKPROF. However, I’ve found that DBMS_TRACE creates too much information to be useful. With it, you have limited control of the volume of information collected. In contrast, with a debug logging utility, you determine what information is logged and when.
Another alternative package you may want to investigate is SYS.DBMS_ERRLOG. With this package, you can write debug information to a table anytime an exception occurs in your PL/SQL program unit. I still find the use of my “homegrown” debug logging to be more useful.
Debug logging is a good tool, but in some situations, a real debugging tool is more appropriate. Let’s look at Oracle’s debugger next.
One Step at a Time
After what seemed an eternity, PL/SQL programmers now have a real, honest-to-goodness debugger. What’s a debugger? It allows you to step through your PL/SQL code as it executes, one step at a time, line by line, inspecting the value of variables, and seeing how your program executes your logic. It’s a remote debugger—remote in the fact that your PL/SQL program unit must be stored in the database, and it must be executable. By “executable,” I mean it must be a stored function, procedure, or packaged function or procedure.
So how did this revolution come about? It started with a PL/SQL package called SYS.DBMS_DEBUG. Oracle database PL/SQL package DBMS_DEBUG provides communication hooks into the PL/SQL debugger layer in the database. Using this package, you can build your own remote debugger, but it’s much easier to use Oracle SQL Developer.
Debugging with Oracle SQL Developer
Oracle SQL Developer is an SQL and PL/SQL development tool for the Oracle database. You can download a free copy from the Oracle Technology Network site, http://otn.oracle.com.
I’m not going to give you a lesson on how to use Oracle SQL Developer here, because that would be a book in itself, but I will show you some highlights to debugging with it.
Your first step in using a remote debugger with Oracle is to grant debugging rights to the username for which you intend to debug a stored program unit. That’s done by the system administrator or DBA using the following syntax:
grant debug connect session to <username>;
grant debug any procedure to <username>;
where <username> is the name of the user for which to grant the debug privileges.
Your next step is to recompile the stored program units in question with the DEBUG option, using the appropriate syntax for the object type from the following list:
alter function  <name> compile debug;
alter package   <name> compile debug package;
alter package   <name> compile debug specification;
alter package   <name> compile debug body;
alter procedure <name> compile debug;
alter trigger   <name> compile debug;
alter type      <name> compile debug specification;
alter type      <name> compile debug body;
Alternatively, you can recompile the code from Oracle SQL Developer! Let me show you an example of debugging (of all things) the DEBUG TYPE and the DEBUGGER package. In this example, I’ve already started Oracle SQL Developer and logged in to database ORCL, where, incidentally, I have already granted debug connect session and debug any procedure rights to the username.
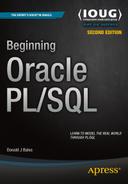
In Figure 7-1, I used the tree view on the left side of the screen to drill down and select the BODY for TYPE DEBUG. From there, I right-clicked and chose Edit. That action displayed the tab DEBUG Body, where I subsequently added a breakpoint to the constructor.
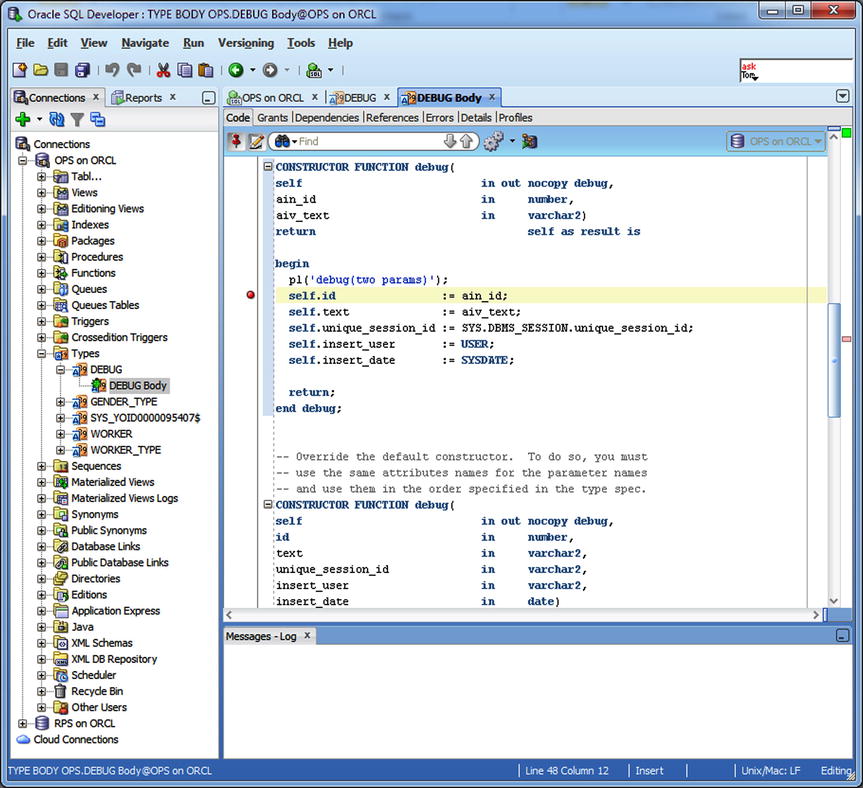
Figure 7-1. Setting a breakpoint in TYPE DEBUG’s constructor
In Figure 7-2, I used the tree view to find the package body for DEBUGGER. Next, I right-clicked and selected Edit. That action displayed the tab DEBUGGER Body, where I added a breakpoint for procedure set_text(). Then I clicked the icon to recompile the item with debug.
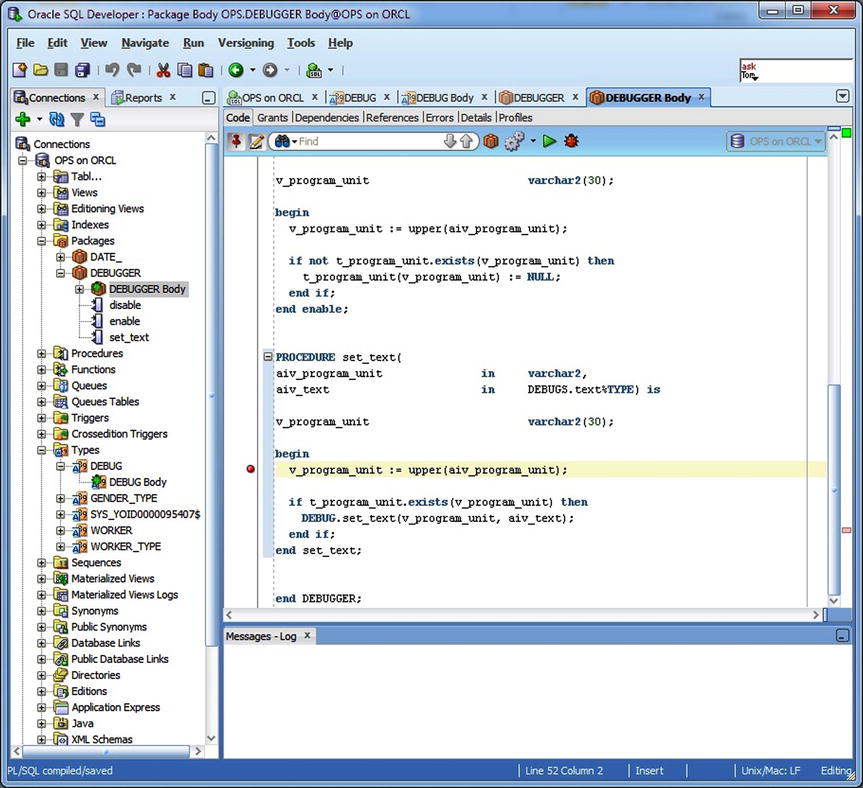
Figure 7-2. Setting a breakpoint in package body method DEBUGGER.set_text( )
At this point, I’ve set two breakpoints: one in TYPE DEBUG’s constructor and a second in package body DEBUGGER’s set_text() method. Now when I execute a program unit that calls either DEBUG’s constructor or DEBUGGER.set_text(), the debugger will stop execution so I can inspect variable values or single-step through each line of code.
My next task is to select an executable target and then debug it. That’s what I did in Figure 7-3. Once again, I used the tree view to select the package specification for DEBUGGER. Then I right-clicked and selected Edit. That action displayed the tab DEBUGGER. From there, I clicked the debug icon. Since I’m in a package specification, the target is runnable, so Oracle SQL Developer prompts me for an anonymous procedure that I can use to execute the target.
Figure 7-3. Editing the package specification for DEBUGGER in order to debug it
When I clicked the debug icon in Figure 7-3, the Debug PL/SQL dialog box appeared, as shown in Figure 7-4. Here, I selected the target method to debug—in this case, set_text. Next, I needed to modify the anonymous PL/SQL procedure stub presented by Oracle SQL Developer or select one from the file system by clicking the From File button. Since I already had a test unit script written, ops.debug.sql, I selected it from the file system, deleted the remark lines and the trailing compile slash, and then clicked the OK button to start the procedure, thus starting the debugging session.
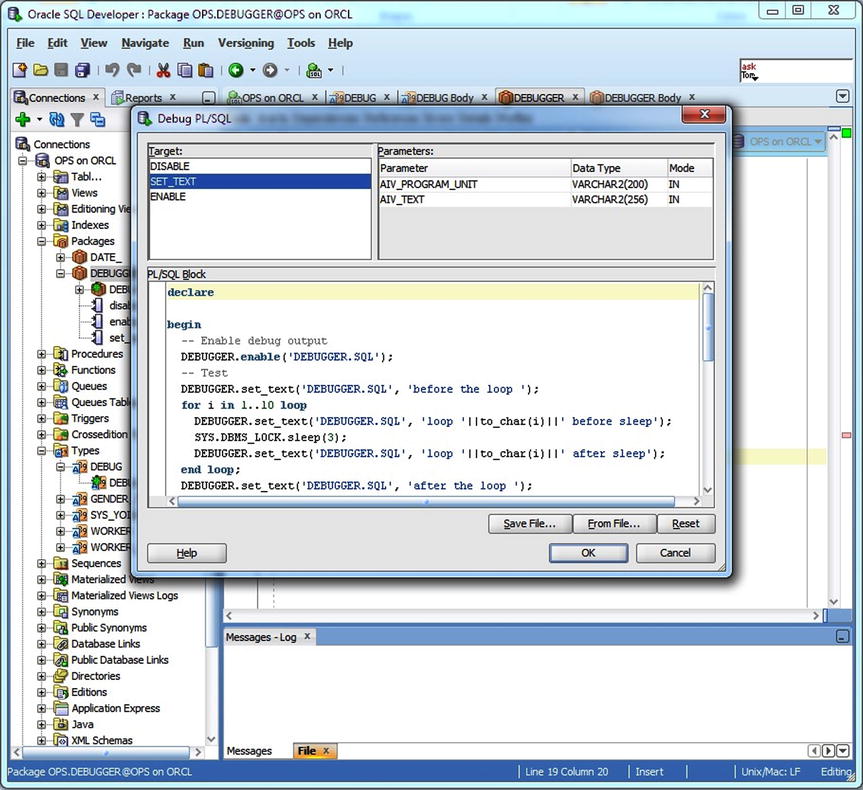
Figure 7-4. Specifying the anonymous PL/SQL script to execute the runnable target
In Figure 7-5, the debugger stopped the execution of the program when it encountered the breakpoint set on method set_text(). From there, I clicked the Step Into icon in order to execute the code line by line. In the lower-right corner of the screen, you can see the value of variable v_program_unit because I set up a watch on that variable.
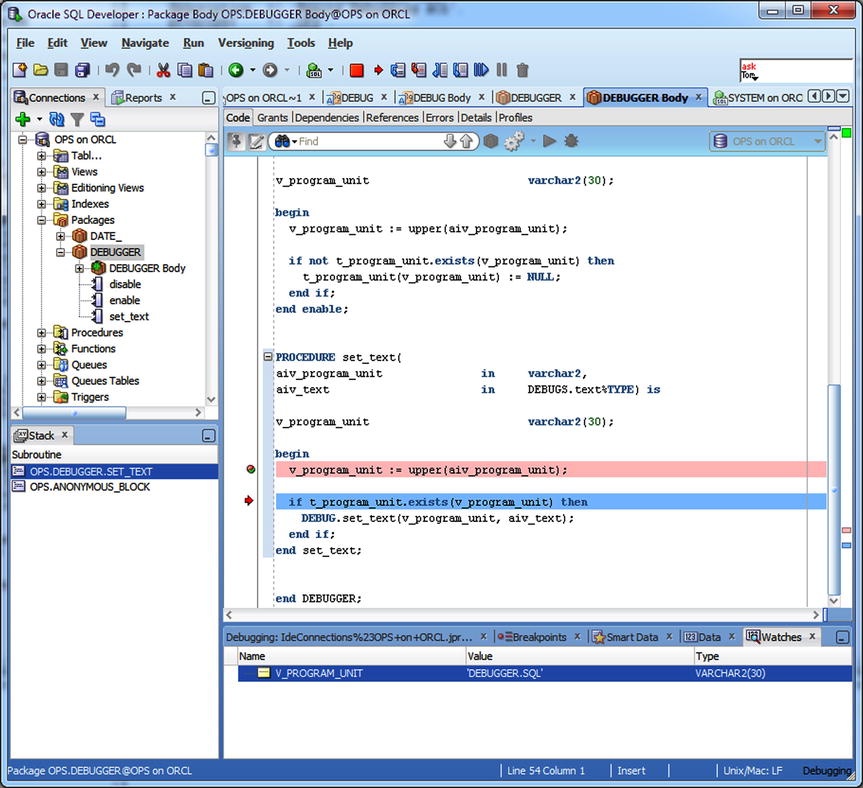
Figure 7-5. Stepping into code after a breakpoint has been encountered
As you can see from this short example, you have total access to both the values of variables and how program logic is being executed when you’re in a debugger. This is the ultimate troubleshooting tool. Or is it?
For a simple troubleshooting task, you are probably better off using put_line(). For a long-running program unit, you’re probably better off using debug logging. Then once you’ve narrowed down the problem, if you haven’t already solved it, you may want to use a debugger. Why?
Using a debugger requires a great deal of setup, arranging access to the username of the stored program unit, grants for debugging, and the creation of an access control list. And it can take a lot of time to use for the simple fact that stepping through a program line by line can be extremely time-consuming. It’s up to you to use the appropriate tool at the appropriate time.
Debugging Anonymous PL/SQL
So far, I’ve been talking only about debugging stored program units. What about anonymous PL/SQL procedures? Sorry, you cannot debug anonymous PL/SQL program units. And that should not be a big deal. If you have an anonymous PL/SQL program that’s so big that it needs debugging, it probably needs to be permanently stored in the database. Once you store it in the database, you can use Oracle SQL Developer to debug it.
Debugging with TOAD for Oracle
TOAD for Oracle is a very popular SQL and PL/SQL development tool by Quest Software. There’s a freeware version available for download from Dell (formerly Quest Software) at http://software.dell.com/products/toad-for-oracle/. However, the free version does not include debugging capability. To get a copy of TOAD with a debugger, you must download the trial version. The TOAD debugger has almost the same set of debugging features as Oracle SQL Developer, but I prefer Oracle SQL Developer.
Oracle has a plug-in module that allows you to use the remote debugger from Microsoft’s Visual Studio. Once again, you can download this plug-in from Oracle’s Technology Network web site at http://otn.oracle.com.
It’s Your Turn to Use a Debugger
I know I haven’t taken the time to show you how to use the PL/SQL debugger; I’ve only walked through an example. As a professional, it will be invaluable for you to know how to use the PL/SQL debugger. So, follow these somewhat loosely defined steps to install the PL/SQL debugger and get some experience using it.
- Go to http://otn.oracle.com and search for “Oracle SQL Developer download.” This should bring you to the Oracle SQL Developer page, where you can download a copy of the software, get its installation instructions, and access tutorials for using the product.
- Download Oracle SQL Developer.
- Print a copy of the tutorials “Creating a database connection” and “Loading, executing and debugging PL/SQL.”
- Install Oracle SQL Developer.
- Run Oracle SQL Developer and create a connection to the database you’re using for username RPS for working on your exercises.
- Using the “Loading, executing and debugging PL/SQL” tutorial as your guide, find table package DEBUG in the tree view.
- Edit the package body by right-clicking its name in the tree view, and then recompile it with debug.
- Create breakpoints in DEBUG’s three methods: disable(), enable(), and set_text().
- Edit the package specification, and click the ladybug icon to run the debugger.
- When the Debug PL/SQL dialog box appears, click the From File button, and then load your test unit script, rps.debug.sql.
- Remove the comment lines at the top of the test unit script and the trailing compile slash at the end of the script, and then click OK to start your debug session.
- After the first breakpoint is triggered, click the Step Into icon to walk through the code line by line.
- Add some watches so you can see the variable’s values change as the program executes.
- Sit back and think how helpful this tool can be in your future.
At this point, you should now have three tools in your troubleshooting arsenal: put_line(), table package DEBUG, and a real live debugger! With these tools, you should be able to troubleshoot any logic problem, but what about performance?
If you have a long-running or large stored procedure, how do you know where in its code it’s slow? You can get this information with runtime profiling, our next topic.
Profiling PL/SQL
Profiling in this context is about collecting runtime statistics from your PL/SQL program units in order to determine which lines of code are consuming the most resources, usually in a unit of time. Armed with these statistics, you can quickly see what part of your PL/SQL program is taking the most time to execute, so you can concentrate your efforts on improving performance on those lines of code that are poor performers.
In days of yore, you had to write your own profiling package in order to collect runtime statistics. Then you had to sprinkle your code with calls to your profiling package in order to collect the statistics. In fact, I did just that, creating a profiling package with architecture similar to the debug logging package.
Nowadays, you have access to a built-in profiling package, SYS.DBMS_PROFILER, which can hook itself into you session and profile your PL/SQL code line by line, without you needing to add many lines of code to your listings. Here, you’ll look at the three tables where DBMS_PROFILER stores its collected statistics, the package’s methods, and an example of its use. Then you’ll finish up this section by profiling your own code.
Profiler’s Tables
The profiling package DBMS_PROFILER stores the statistics it collects during its use in memory, until you call its flush_data() method, at which point it moves the statistics to three tables:
- PLSQL_PROFILER_RUNS: Holds information about a particular run
- PLSQL_PROFILER_UNITS: Holds the names of program units for a particular run
- PLSQL_PROFILE_DATA: Holds the profiling statistics for every line of each program unit accessed in a particular run
Your Oracle system administrator or DBA must create these tables globally using the profload.sql script, or in the schema you’re logged in to using the proftab.sql script, before you try to use the profiler. In addition, you must have the same rights granted to your username as you need for debugging.
You can find detailed information about the DBMS_PROFILER package and these three tables in Oracle’s PL/SQL Packages and Types Reference. Let’s look at the package’s methods next.
Profiler’s Methods
The DBMS_PROFILER package has seven methods, of which you must use at least three to profile an application. Here are the three I am referring to:
- start_profiler(): Initializes and starts a profiling “run” in order to collect statistics. You can specify a description for the run so you can identify the run number after the run, or you can use an overloaded version of the method that returns the run number when you start the run.
- stop_profile(): Stops a previously started run.
- flush_data(): Stores the statistics for the current run into three tables: PLSQL_PROFILER_RUNS, PLSQL_PROFILER_UNITS, and PLSQL_PROFILER_DATA.
To start a profiling session, you need to execute procedure start_profiler() in your PL/SQL program unit where you want to start collecting performance statistics. To stop collecting statistics, you need to execute stop_profile(), usually followed by flush_data(), in order to permanently store the statistics in the profiler’s tables.
Listing 7-16 is a SQL*Plus script that can run any anonymous PL/SQL script with profiling turned on.
Listing 7-16. A Script to Execute Another Script with Profiling, run_profile.sql
01  rem run_profile.sql
02  rem by Donald J. Bales on 2014-10-20
03  rem Capture DBMS_PROFILER information for the specified script
04
05  define script="&1";
06
07  set verify off;
08
09  declare
10
11  n_run_number                          number;
12
13  begin
14    DBMS_PROFILER.start_profiler(
15      '&script'||' on '||to_char(SYSDATE, 'YYYYMMDD HH24MISS'),
16      ' ',
17      n_run_number);
18
19    pl('DBMS_PROFILER run_number = '||to_char(n_run_number));
20  end;
21  /
22
23  @&script
24
25  execute DBMS_PROFILER.stop_profiler;
26  execute DBMS_PROFILER.flush_data;
27
28  set verify on;
To execute the script, type the name of the script in Listing 7-16 followed by the name of the script you wish to execute after the SQL*Plus prompt, as follows:
SQL> @run_profile.sql <script_name>
For example, to profile TYPE DEBUG and role package DEBUGGER, I first log in with username OPS, create the profiler tables by executing script C:oracle12cproduct12.1.0dbhome_1RDBMSADMINproftab.sql, and then execute the script run_profile.sql, passing in the name of my test unit script, ops.debugger.sql:
SQL> @run_profile.sql ops.debugger.sql
Here’s the output from executing the script in SQL*Plus:
SQL> @run_profile ops.debugger.sql
DBMS_PROFILER run_number = 4

PL/SQL procedure successfully completed.


PL/SQL procedure successfully completed.

PL/SQL procedure successfully completed.

PL/SQL procedure successfully completed.
run_profile.sql displays the run number for a profile run on the screen, so you can then run a report to view the profiling data.
Profiling Reports
I find two profiling reports helpful: one to display the average percent of processing time in descending order, and another to order average time consumption by program unit and line number. The SQL*Plus script avg_profile.sql, shown in Listing 7-17, displays what percent of processing time was consumed by each program unit and line of code, in the descending order of time consumption.
Listing 7-17. A Script to Create an Average Percent Profiling Report, avg_profile.sql
01  rem avg_profile.sql
02  rem by Donald J. Bales on 2014-10-20
03  rem Create a DBMS_PROFILER report by avg desc
04
05  define runid="&1";
06
07  column avg_pct   format 990.99;
08  column line#     format 9999;
09  column occur     format 9999
10  column text      format a42 trunc;
11  column unit_name format a11;
12
13  set linesize  1000;
14  set newpage   1;
15  set pagesize  32767;
16  set trimspool on;
17  set verify    off;
18
19  spool avg_profile_&runid..txt;
20
21  select v.unit_name,
22         round(v.avg_time/t.avg_time*100, 2) avg_pct,
23         v.occur,
24         v.line#,
25         ltrim(s.text) text
26  from   SYS.ALL_SOURCE s,
27       ( select u.runid,
28                u.unit_owner,
29                u.unit_type,
30                u.unit_name,
31                d.min_time,
32                to_number(decode(d.total_occur,
33                  NULL, NULL,
34                  0,    0,
35                  round(d.total_time/d.total_occur))) avg_time,
36                d.max_time,
37                d.total_time,
38                d.total_occur occur,
39                d.line#
40         from   PLSQL_PROFILER_UNITS u,
41                PLSQL_PROFILER_DATA d
42         where  u.runid       = d.runid
43         and    u.unit_number = d.unit_number
44         and    d.runid       = &runid ) v,
45       ( select sum(to_number(decode(d.total_occur,
46                  NULL, NULL,
47                  0,    0,
48                  round(d.total_time/d.total_occur)))) avg_time
49         from   PLSQL_PROFILER_UNITS u,
50                PLSQL_PROFILER_DATA d
51         where  u.runid       = d.runid
52         and    u.unit_number = d.unit_number
53         and    d.runid       = &runid ) t
54  where  v.unit_owner  = s.owner(+)
55  and    v.unit_type   = s.type(+)
56  and    v.unit_name   = s.name(+)
57  and    v.line#       = s.line(+)
58  and    v.avg_time    > 0
59  order by v.avg_time desc,
60         v.unit_name,
61         v.line#;
62
63  spool off;
64
65  set verify on;
The avg_profile.sql script produces a report that shows the following information:
- The program unit’s name
- Its average consumption of time
- How many times the line was executed during the run
- The line number and text from the PL/SQL program unit in question
Listing 7-18 is an example of a report created by avg_profile.sql from Listing 7-17.
Listing 7-18. An Average Percent Time Consumption Report for Test Unit ops.debugger.sql
UNIT_NAME   AVG_PCT OCCUR LINE# TEXT
----------- ------- ----- ----- ------------------------------------------
DEBUG         39.72    22    92 insert into DEBUGS
DEBUG         15.28    22    97 commit;
<anonymous>    9.53     2     1
<anonymous>    6.57     1     5
<anonymous>    6.11    18     1
<anonymous>    5.06     1    11
<anonymous>    1.56     2     1
<anonymous>    1.28    10    11
DEBUGGER       0.97     1    36 v_program_unit := upper(aiv_program_unit);
DEBUG          0.86   132    46 pl('debug(two params)'),
<anonymous>    0.83    10     9
DEBUG          0.82   132    49 self.unique_session_id := SYS.DBMS_SESSION
DEBUG          0.80   132    50 self.insert_user       := USER;
<anonymous>    0.75    10    10
PL             0.75   133    11 SYS.DBMS_OUTPUT.put_line(aiv_text);
DEBUG          0.65   132    53 return;
DEBUG          0.62    22    89 begin
DEBUG          0.59    22    90 v_text := substrb(aiv_program_unit||': '||
DEBUGGER       0.54     1    25 t_program_unit.delete(v_program_unit);
DEBUG          0.46    22    98 end set_text;
DEBUGGER       0.43     1    30 PROCEDURE enable(
DEBUGGER       0.43     1    39 t_program_unit(v_program_unit) := NULL;
DEBUGGER       0.40    22    54 DEBUG.set_text(v_program_unit, aiv_text);
DEBUG          0.34   132    39 CONSTRUCTOR FUNCTION debug(
DEBUGGER       0.32     1    22 v_program_unit := upper(aiv_program_unit);
DEBUGGER       0.32     1    38 if not t_program_unit.exists(v_program_uni
DEBUGGER       0.32    44    51 v_program_unit := upper(aiv_program_unit);
DEBUG          0.28    22    81 STATIC PROCEDURE set_text(
DEBUGGER       0.28    44    44 PROCEDURE set_text(
DEBUGGER       0.25    44    53 if t_program_unit.exists(v_program_unit) t
DEBUG          0.24   132    51 self.insert_date       := SYSDATE;
<anonymous>    0.23    10    20
<anonymous>    0.22     1    16
<anonymous>    0.22     1    18
<anonymous>    0.22     1    25
DEBUGGER       0.22     1    16 PROCEDURE disable(
DEBUGGER       0.22     1    24 if t_program_unit.exists(v_program_unit) t
DEBUG          0.20   132    54 end debug;
DEBUG          0.16   132    47 self.id                := ain_id;
<anonymous>    0.13    10    22
<anonymous>    0.11     1     7
<anonymous>    0.11     1    12
<anonymous>    0.11     1    13
DEBUGGER       0.11     1    27 end disable;
DEBUGGER       0.11     1    41 end enable;
<anonymous>    0.09    11     8
PL             0.08   133    12 end pl;
DEBUGGER       0.05    44    56 end set_text;
DEBUG          0.05   132    48 self.text              := aiv_text;
<anonymous>    0.04    11    19

50 rows selected.
Looking at Listing 7-18, it’s easy to see that the bulk of time consumption is taken by the INSERT statement. This is typical. The slowest portion of any PL/SQL procedure is usually one or more SQL statements. That’s why it’s important to always maximize the efficiency of your SQL statements. You’ll learn about one of the tools you can use to do that shortly, in the section about EXPLAIN PLAN. For now, it’s important for you to understand just how valuable this report is when considering how to approach performance enhancements to your PL/SQL program units. With data like this, you can significantly narrow down the lines of code for which you need to improve performance, and not waste a lot of time guessing which ones are the poor performers.
A second report I like to use orders the average time consumption by program unit and line number. The script I execute for this report is named ord_profile.sql (you can find the listing for this report in the downloadable source code for the book). Just as with avg_profile.sql, you execute the script at the SQL*Plus prompt, passing in the run number as a parameter. Here’s an example:
SQL> @ord_profile.sql 4
This command produced the report example shown in Listing 7-19. This report is helpful because it shows which lines in your program were actually executed. And even more interesting, you can add up the statistics for a function or procedure call by totaling the statistics from the line where the method is defined down to the line where it ends. For example, doing this for the constructor debug in Listing 7-19, you can calculate that it consumed 38,265 nanoseconds of processing time.
Listing 7-19. An Average Time Consumption Report by Program Unit and Line Number for Test Unit ops.debugger.sql
UNIT_NAME     AVG_TIME OCCUR LINE# TEXT
------------- -------- ----- ----- ----------------------------------------
<anonymous>      14497     2     1
<anonymous>      56766    18     1
<anonymous>          0     0     1
<anonymous>      88482     2     1
<anonymous>          0     0     1
<anonymous>      60987     1     5
<anonymous>          0     0     6
<anonymous>        999     1     7
<anonymous>        818    11     8
<anonymous>       7698    10     9
<anonymous>       6999    10    10
<anonymous>      11898    10    11
<anonymous>      46990     1    11
<anonymous>        999     1    12
<anonymous>        999     1    13
<anonymous>       1999     1    16
<anonymous>       1999     1    18
<anonymous>        364    11    19
<anonymous>       2100    10    20
<anonymous>       1200    10    22
<anonymous>          0     1    24
<anonymous>       1999     1    25
DEBUG                0     0     9 STATIC FUNCTION get_id
DEBUG                0     0    14 begin
DEBUG                0     0    15 select DEBUGS_ID.nextval
DEBUG                0     0    19 return n_id;
DEBUG                0     0    20 end get_id;
DEBUG                0     0    23 CONSTRUCTOR FUNCTION debug(
DEBUG                0     0    27 begin
DEBUG                0     0    28 pl('debug(zero param)'),
DEBUG                0     0    29 self.id                := NULL;
DEBUG                0     0    30 self.text              := NULL;
DEBUG                0     0    31 self.unique_session_id := NULL;
DEBUG                0     0    32 self.insert_user       := NULL;
DEBUG                0     0    33 self.insert_date       := NULL;
DEBUG                0     0    35 return;
DEBUG                0     0    36 end debug;
DEBUG             3174   132    39 CONSTRUCTOR FUNCTION debug(
DEBUG                0   132    45 begin
DEBUG             8029   132    46 pl('debug(two params)'),
DEBUG             1469   132    47 self.id                := ain_id;
DEBUG              477   132    48 self.text              := aiv_text;
DEBUG             7604   132    49 self.unique_session_id := SYS.DBMS_SESSI
DEBUG             7445   132    50 self.insert_user       := USER;
DEBUG             2197   132    51 self.insert_date       := SYSDATE;
DEBUG             6037   132    53 return;
DEBUG             1833   132    54 end debug;
DEBUG                0     0    60 CONSTRUCTOR FUNCTION debug(
DEBUG                0     0    69 begin
DEBUG                0     0    70 pl('debug(five params)'),
DEBUG                0     0    71 self.id                := id;
DEBUG                0     0    72 self.text              := text;
DEBUG                0     0    73 self.unique_session_id := unique_session
DEBUG                0     0    74 self.insert_user       := insert_user;
DEBUG                0     0    75 self.insert_date       := insert_date;
DEBUG                0     0    77 return;
DEBUG                0     0    78 end debug;
DEBUG             2636    22    81 STATIC PROCEDURE set_text(
DEBUG             5726    22    89 begin
DEBUG             5453    22    90 v_text := substrb(aiv_program_unit||': '
DEBUG           368832    22    92 insert into DEBUGS
DEBUG           141880    22    97 commit;
DEBUG             4226    22    98 end set_text;
DEBUG                0     0   101 MAP MEMBER FUNCTION to_map
DEBUG                0     0   104 begin
DEBUG                0     0   105 return id;
DEBUG                0     0   106 end to_map;
DEBUGGER             0     0     1 package body DEBUGGER as
DEBUGGER          1999     1    16 PROCEDURE disable(
DEBUGGER             0     1    21 begin
DEBUGGER          2999     1    22 v_program_unit := upper(aiv_program_unit
DEBUGGER          1999     1    24 if t_program_unit.exists(v_program_unit)
DEBUGGER          4998     1    25 t_program_unit.delete(v_program_unit);
DEBUGGER             0     1    26 end if;
DEBUGGER           999     1    27 end disable;
DEBUGGER          3999     1    30 PROCEDURE enable(
DEBUGGER             0     1    35 begin
DEBUGGER          8998     1    36 v_program_unit := upper(aiv_program_unit
DEBUGGER          2999     1    38 if not t_program_unit.exists(v_program_u
DEBUGGER          3999     1    39 t_program_unit(v_program_unit) := NULL;
DEBUGGER             0     1    40 end if;
DEBUGGER           999     1    41 end enable;
DEBUGGER          2636    44    44 PROCEDURE set_text(
DEBUGGER             0    44    50 begin
DEBUGGER          2931    44    51 v_program_unit := upper(aiv_program_unit
DEBUGGER          2363    44    53 if t_program_unit.exists(v_program_unit)
DEBUGGER          3726    22    54 DEBUG.set_text(v_program_unit, aiv_text)
DEBUGGER             0    44    55 end if;
DEBUGGER           500    44    56 end set_text;
DEBUGGER             0     0    59 end DEBUGGER;
PL                   0     0     1 PROCEDURE pl(
PL                6953   133    11 SYS.DBMS_OUTPUT.put_line(aiv_text);
PL                 729   133    12 end pl;

93 rows selected.
Utilizing the statistics provided by DBMS_PROFILER, you can easily determine any bottlenecks in your PL/SQL programs and approach performance tuning in an efficient manner. DBMS_PROFILER data can also be used to detect defects in your code, in a fashion similar to debug logging.
Did you notice that, in both reports, the constructor for DEBUG was called 132 times, yet the INSERT statement was executed only 22 times? That means that SQL executed the constructor six times during each insert, clearly a defect in the SQL layer of the database, and subsequently a performance problem.
Now that I’ve profiled the object-relational version of the debug logger, it’s your turn to profile the relational version.
It’s Your Turn to Profile
The value of profiling code grows with the number of lines of code you’re profiling. Still, you’ll start out small by using DBMS_PROFILER on a smaller set of program units: your own code.
Before you begin, it’s a good idea to see if DBMS_PROFILER is installed and if there are tables that it can store its data into when method flush_data() is called. To that end, execute a script like is_profiler.sql, as shown in Listing 7-20.
Listing 7-20. A Script to Detemine If SYS.DBMS_PROFILER Is Installed Properly, is_profiler.sql
01  rem is_profiler.sql
02  rem by Donaled J. Bales on 2014-10-20
03  rem Check to see if the profiler is installed and accessible
04
05  declare
06
07  n_major                               number;
08  n_minor                               number;
09  n_package                             number;
10  n_local                               number;
11  n_global                              number;
12
13  begin
14    select count(1)
15    into   n_package
16    from   SYS.ALL_OBJECTS
17    where  object_type = 'PACKAGE'
18    and    object_name = 'DBMS_PROFILER'
19    and    owner       = 'SYS';
20
21    if n_package > 0 then
22      SYS.DBMS_PROFILER.get_version(n_major, n_minor);
23
24      pl('DBMS_PROFILER Version '||
25        to_char(n_major)||'.'||
26        to_char(n_minor));
27
28      pl('DBMS_PROFILER.internal_version_check = '||
29        to_char(SYS.DBMS_PROFILER.internal_version_check));
30    else
31      pl('Sorry, either the profile does not exist, or you'||
32         'don''t have access to it.  Contact your DBA!'),
33    end if;
34
35    select count(1)
36    into   n_local
37    from   SYS.ALL_OBJECTS
38    where  object_type = 'TABLE'
39    and    object_name in (
40      'PLSQL_PROFILER_RUNS',
41      'PLSQL_PROFILER_UNITS',
42      'PLSQL_PROFILER_DATA')
43    and    owner = USER;
44
45    if n_local = 3 then
46      pl('You have access to locally defined profiler tables '||
47        'for your current username: '||USER);
48    end if;
49
50    select count(1)
51    into   n_global
52    from   SYS.ALL_OBJECTS
53    where  object_type = 'TABLE'
54    and    object_name in (
55      'PLSQL_PROFILER_RUNS',
56      'PLSQL_PROFILER_UNITS',
57      'PLSQL_PROFILER_DATA')
58    and    owner = 'SYS';
59
60    if n_global = 3 then
61      pl('You have access to gloablly defined profiler tables '||
62        'under username SYS'),
63    end if;
64
65    if n_local  <> 3 and
66       n_global <> 3 then
67      pl('Sorry, either the profile tables do not exist, or you'||
68         'don''t have access to them.  Contact your DBA!'),
69    end if;
70
71  end;
72  /
You should see SQL*Plus output like this:
SQL> @is_profiler.sql
DBMS_PROFILER Version 2.0
DBMS_PROFILER.internal_version_check = 0
You have access to locally defined profiler tables for your current username: RPS

PL/SQL procedure successfully completed.
Given that you have access to the profiler, profile your relational version of the debug logger by following these steps.
- Profile your debug logger by executing the following at the SQL*Plus prompt:
SQL> @run_profile.sql rps.debug.sqlThis profiles your debug logging table package by executing your test unit for said package. The run_profiler.sql script should have displayed the run number on the screen. Jot down this number because you’ll need it to run the two profiling reports next.
- Create an “average percent consumption” report by executing the following at the SQL*Plus prompt:
SQL> @avg_profile.sql <run_number>where <run_number> is the run number you got from executing script run_profile.sql.
- Examine the file avg_profile_<run_number>.txt. Ask yourself, “What’s the biggest consumer of resources?”
- Create an “order by program unit and line number” report by executing the following at the SQL*Plus prompt:
SQL> @ord_profile.sql <run_number> - Examine the file ord_profile_<run_number>.txt. Scan down the report. Find where your methods start and stop. Add up the average time consumption in nanoseconds. Ask yourself, “What’s the biggest consumer of resources?”
Interestingly enough, in both cases, when you ask yourself to identify the biggest consumer of resources, you’ll see that the answer is your SQL statements. Yes, we’re back to dealing with SQL again. It’s important to verify that your PL/SQL program logic is sound and it performs well, but it’s even more important to make sure that your SQL is efficient. So let’s see how you can determine just what’s going on in a SQL statement next.
Profiling SQL
It’s undeniable. You must make sure your SQL statements are as efficient as possible and that they are doing as much of the data manipulation work as is possible because SQL is more efficient at manipulating data than PL/SQL. So how do you see what’s going on when it comes to a SQL statement?
Oracle provides two tools that you can use to examine the underlying access plan generated by the Oracle SQL Optimizer:
- EXPLAIN PLAN: Shows the execution plan generated by the Optimizer for a SQL statement you execute under the Oracle keywords EXPLAIN PLAN
- TKPROF: A utility program that can produce execution plans for all SQL statements executed again a database
Let’s start out by looking at EXPLAIN PLAN.
“Why does this take so long to run?” EXPLAIN PLAN will tell you, in just a bit more time than it takes you wrap your SQL statement in the keywords EXPLAIN PLAN FOR, exactly how the database intends to execute your SQL statement. Armed with this information, you can quickly determine if you need to do any of the following:
- Add an index to a table (or remove it)
- Rewrite your SQL statement
- Break your data processing into smaller chunks of work
- Just live with what you have
Given what you just learned in the section on profiling about performance in a PL/SQL program, your first step should always be to use EXPLAIN PLAN on every SQL statement in your PL/SQL program unit. So how do you do that?
- Execute your SQL statement prefixed with the keywords EXPLAIN PLAN FOR.
- Query the table PLAN_TABLE to extract the statistics.
In the olden days, you had to write your own SQL statements to query the PLAN_TABLE, but now you have access to package SYS.DBMS_XPLAN, which will do all the work of formatting the statistics for you.
Listing 7-21 is a SQL*Plus script named xp.sql that will explain the Optimizer’s plan for a SQL statement stored in a file, with the filename passed to the script as the first parameter.
Listing 7-21. A Script to Explain the Optimizer Plan for SQL Statements, xp.sql
01  rem xp.sql
02  rem by Donald J. Bales on 2014-10-20
03  rem Display the execution plan for the last executed cursor
04
05  define script="&1";
06
07  set linesize  1000;
08  set newpage   1;
09  set pagesize  0;
10  set trimspool on;
11  set verify    off;
12
13  EXPLAIN PLAN FOR
14  select 1 from DUAL;
15
16  spool &script..pln;
17
18  EXPLAIN PLAN FOR
19  @&script
20
21  set echo off;
22
23  select * from table(SYS.DBMS_XPLAN.DISPLAY);
24
25  spool off;
26
27  set pagesize  32767;
28  set verify    on;
For example, first I save the following simple query in file select_workers_equlato.sql:
select *
from   WORKERS
where  name = 'DOE, JOHN J.'
order by 1;
Next, I execute xp.sql in SQL*Plus, passing it the filename as follows:
SQL> @xp.sql select_workers_equalto.sql
This produces the following plan:
Explained.

Plan hash value: 2276017427

----------------------------------------------------------------------------
| Id  | Operation                            | Name        | Rows  | Bytes |
----------------------------------------------------------------------------
|   0 | SELECT STATEMENT                     |             |     1 |    66 |
|   1 |  SORT ORDER BY                       |             |     1 |    66 |
|   2 |   TABLE ACCESS BY INDEX ROWID BATCHED| WORKERS     |     1 |    66 |
|*  3 |    INDEX RANGE SCAN                  | WORKERS_UK2 |     1 |       |
----------------------------------------------------------------------------

-------------------------
| Cost (%CPU)| Time     |
-------------------------
|     6  (17)| 00:00:01 |
|     6  (17)| 00:00:01 |
|     5   (0)| 00:00:01 |
|     3   (0)| 00:00:01 |
-------------------------

Predicate Information (identified by operation id):
---------------------------------------------------

   3 - access("NAME"='DOE, JOHN J.')

15 rows selected.
If you examine the plan, you’ll see that the query is retrieving the values from the database by first scanning index WORKERS_UK2. Since I know how the indexes were built, I can be assured by looking at the plan that the Optimizer has chosen the best plan for accessing the WORKERS table. Now let’s see what the Optimizer decides to do when I change the query from an “equal to” to a “like literal ending with a wildcard” query.
First, I save the following query in file select_workers_likepct.sql:
select *
from   WORKERS
where  name like 'DOE%'
order by 1;
Next, I execute xp.sql against that filename as follows:
SQL> @xp.sql select_workers_likepct.sql
This produces the following plan:
Explained.

Plan hash value: 2276017427

----------------------------------------------------------------------------
| Id  | Operation                            | Name        | Rows  | Bytes |
----------------------------------------------------------------------------
|   0 | SELECT STATEMENT                     |             |     1 |    66 |
|   1 |  SORT ORDER BY                       |             |     1 |    66 |
|   2 |   TABLE ACCESS BY INDEX ROWID BATCHED| WORKERS     |     1 |    66 |
|*  3 |    INDEX RANGE SCAN                  | WORKERS_UK2 |     1 |       |
----------------------------------------------------------------------------

-------------------------
| Cost (%CPU)| Time     |
-------------------------
|     6  (17)| 00:00:01 |
|     6  (17)| 00:00:01 |
|     5   (0)| 00:00:01 |
|     3   (0)| 00:00:01 |
-------------------------

Predicate Information (identified by operation id):
---------------------------------------------------

   3 - access("NAME" LIKE 'DOE%')
       filter("NAME" LIKE 'DOE%')

16 rows selected.
The Optimizer chose the same plan for this query as it did that last one.
Now let’s try a worst-case scenario for any LIKE statement. I’ll use the (%) wildcard on both sides of the literal. I would assume that this SQL statement will lead to a full index scan, instead of an index range scan. Does it?
First, I save the following query in file select_workers_pctlikepct.sql:
select *
from   WORKERS
where  name like '%DOE%'
order by 1;
Next, I pass the filename to xp.sql as follows:
SQL> @xp.sql select_workers_pctlikepct.sql
This produces the following plan:
Explained.

Plan hash value: 412163233

--------------------------------------------------------------
| Id  | Operation          | Name    | Rows  | Bytes |TempSpc|
--------------------------------------------------------------
|   0 | SELECT STATEMENT   |         | 13000 |   837K|       |
|   1 |  SORT ORDER BY     |         | 13000 |   837K|  1144K|
|*  2 |   TABLE ACCESS FULL| WORKERS | 13000 |   837K|       |
--------------------------------------------------------------

-------------------------
| Cost (%CPU)| Time     |
-------------------------
|  1065   (1)| 00:00:01 |
|  1065   (1)| 00:00:01 |
|   856   (1)| 00:00:01 |
-------------------------

Predicate Information (identified by operation id):
---------------------------------------------------

   2 - filter("NAME" LIKE '%DOE%' AND "NAME" IS NOT NULL)

14 rows selected.
No, it doesn’t use an index at all. Instead, it resorted to the worst of all options: a full table scan. Ouch! The cost went from 6 to 1065. That means it will take about 177 times longer for this query to respond than the first two. It looks like if I want to maintain performance in my application, I’m going to have to devise another solution for allowing my end users to find someone with a name like %<name>%. Is there something I can do in Oracle to improve this situation? Yes, sometimes there is.
If you have a table that has much larger row sizes than an applicable index, you can use simple physics to improve your query response time. For example, the average row size for the table WORKERS is 87 bytes.The average row size for index WORKERS_UK2 is 17 bytes. If I add a hint to the query forcing it to full scan the index WORKERS_UK2, the database will be able to retrieve five times as many index blocks per retrieval that it can table blocks. What does the Optimizer have to say about this plan? Let’s find out.
First, I save the following query as select_workers_pctlikepct2.sql:
select /*+ INDEX(WORKERS WORKERS_UK2) */
       *
from   WORKERS
where  name like '%DOE%'
order by 1;
In this query, I’ve added the hint /*+ INDEX(WORKERS WORKERS_UK2) */, which tells the Optimizer to use index WORKERS_UK2. Next, I use xp.sql to do explain the Optimizer’s plan as follows:
SQL> xp.sql select_workerS_pctlikepct2.sql
This produces the following plan:
Explained.

Plan hash value: 2470337875

----------------------------------------------------------------------------
| Id  | Operation                            | Name        | Rows  | Bytes |
----------------------------------------------------------------------------
|   0 | SELECT STATEMENT                     |             | 13000 |   837K|
|   1 |  SORT ORDER BY                       |             | 13000 |   837K|
|   2 |   TABLE ACCESS BY INDEX ROWID BATCHED| WORKERS     | 13000 |   837K|
|*  3 |    INDEX FULL SCAN                   | WORKERS_UK2 | 13000 |       |
----------------------------------------------------------------------------

---------------------------------
|TempSpc| Cost (%CPU)| Time     |
---------------------------------
|       | 14787   (1)| 00:00:01 |
|  1144K| 14787   (1)| 00:00:01 |
|       | 14579   (1)| 00:00:01 |
|       |  1576   (1)| 00:00:01 |
---------------------------------

Predicate Information (identified by operation id):
---------------------------------------------------

   3 - filter("NAME" LIKE '%DOE%' AND "NAME" IS NOT NULL)

15 rows selected.
Indeed, the Optimizer understands my hint and is prepared to scan the index, but the cost is astronomical! Well guess what—the Optimizer is wrong. It doesn’t understand the underlying physics involved.
Since there are 260,000 rows of data, with an average length of 87 bytes, if the Oracle database retrieves the data in 4KB blocks, it will require the retrieval of at least 5,500 blocks from the disk drive. On the other hand, it will require the retrieval of only about 1,080 blocks to identify which data rows to retrieve. Since, in this context, searching for part of a name will return a small set of rows, the application’s performance can permanently benefit from the use of the hint, regardless of how the Optimizer feels about it. But the proof is in testing. And that is testing a snapshot of a fully loaded production database, not your development database. It’s not until there are millions of rows in tables that you will probably need to “out think” Oracle’s optimizer.
If I execute the first query select_worker_ot_pctlikepct.sql, which does not have the hint, against 260,000 rows, it takes on average three seconds to retrieve the matching rows. If I execute the second query, select_worker_ot_pctlikepct2.sql, which does have the hint to scan the index, it takes on average one second to retrieve the matching rows.
What’s the moral of this story? The Optimizer doesn’t always know the best way to retrieve data. It works with what it knows—basically statistics gathered when you analyze a table. On the other hand, you’re an intelligent programmer who is much more knowledgeable and can therefore consider things like physics.
It’s Your Turn to Use Explain Plan
Do you remember the section on FORALL in Chapter 5? That’s where I nailed down the value of using the power of SQL instead of writing a whole lot of PL/SQL code to do the same work. The following SQL statement comes from Listing 5-14:
insert into WORKERS (
       worker_id,
       worker_type_id,
       external_id,
       first_name,
       middle_name,
       last_name,
       name,
       birth_date,
       gender_id)
select WORKERS_ID.nextval,
       decode(mod(WORKER_ID_SEQ.currval, 2),
         0, n_WT_EMPLOYEE, n_WT_CONTRACTOR),
       lpad(to_char(EXTERNAL_ID_SEQ.nextval), 9, '0'),
       first_name,
       letter||'.',
       last_name,
       WORKER.get_formatted_name(
         first_name, letter||'.', last_name),
       DATE_.random(
         to_number(to_char(SYSDATE, 'YYYY')) - 65,
         to_number(to_char(SYSDATE, 'YYYY')) - 18),
       decode(gender_code, 'F', n_G_FEMALE, n_G_MALE)
from   TOP_100_LAST_NAMES,
       TOP_100_FIRST_NAMES,
       A_THRU_Z;
In this code, I use pseudo-constants n_WT_EMPLOYEE, n_WT_CONTRACTOR, n_G_FEMALE, and n_G_MALE, which were preselected from the database, instead of selecting those values from the database in the SQL INSERT statement. Why?
It’s another one of those tricks I’ve learned along the way. After years of using EXPLAIN PLAN on every SQL statement I’ve written, I noticed that I can improve the performance of a SQL statement if I reduce the number of tables accessed in the statement. If a SQL statement has three or less tables being selected, it performs pretty well. Add more tables, and its performance goes downhill fast.
So, if I have fairly limited number of constant values, I select them into pseudo-constant variables ahead of time, and then use those pseudo-constants in my SQL statement. Here’s the Optimizer’s plan for the preceding SQL INSERT statement:
Explained.

Plan hash value: 3139420850

----------------------------------------------------------------------------
| Id  | Operation                 | Name                   | Rows  | Bytes |
----------------------------------------------------------------------------
|   0 | INSERT STATEMENT          |                        |   260K|  4570K|
|   1 |  LOAD TABLE CONVENTIONAL  | WORKERS                |       |       |
|   2 |   SEQUENCE                | WORKERS_ID             |       |       |
|   3 |    MERGE JOIN CARTESIAN   |                        |   260K|  4570K|
|   4 |     MERGE JOIN CARTESIAN  |                        |  2600 | 23400 |
|   5 |      INDEX FULL SCAN      | A_THRU_Z_PK            |    26 |    52 |
|   6 |      BUFFER SORT          |                        |   100 |   700 |
|   7 |       INDEX FAST FULL SCAN| TOP_100_LAST_NAMES_PK  |   100 |   700 |
|   8 |     BUFFER SORT           |                        |   100 |   900 |
|   9 |      INDEX FAST FULL SCAN | TOP_100_FIRST_NAMES_PK |   100 |   900 |
----------------------------------------------------------------------------

-------------------------
| Cost (%CPU)| Time     |
-------------------------
|   717   (1)| 00:00:01 |
|            |          |
|            |          |
|   717   (1)| 00:00:01 |
|    10   (0)| 00:00:01 |
|     1   (0)| 00:00:01 |
|     9   (0)| 00:00:01 |
|     0   (0)| 00:00:01 |
|   717   (1)| 00:00:01 |
|     0   (0)| 00:00:01 |
-------------------------

16 rows selected.
So here’s your assignment. Rewrite the preceding SQL INSERT statement, which takes 47 seconds on average to execute on my machine, so the ID values for EMPLOYEE, CONTRACTOR, FEMALE, and MALE come from tables in the SQL INSERT statement’s SELECT statement. Figure out if my working assumption about the number of tables in a SQL statement was true for this case, too. Follow these steps in order to find out for yourself.
- Rewrite the SQL INSERT statement from Listing 5-14, adding two more tables to the SELECT statement, so you can get the ID values for corresponding codes from the database in the SQL statement.
- Do an EXPLAIN PLAN on your SQL INSERT statement to determine what the Optimizer is planning. Is your plan better than the one for the SQL INSERT statement from Listing 5-14?
- Look up the ID values for EMPLOYEE, CONTRACTOR, FEMALE, and MALE, and then substitute these values into the SQL INSERT statement from Listing 5-14.
- Delete the contents of table WORKERS, and then execute the SQL INSERT statement from Listing 5-14 that you just modified, keeping track of how long it takes to execute. I suggest you do this at least three times, and then calculate the average value for how long it takes for the INSERT statement to execute.
- Delete the contents of table WORKERS, and then execute your SQL INSERT statement where you include the GENDER_TYPES and WORKER_TYPES tables in its SELECT statement. Once again, I suggest you do this three times, and then calculate the average response time.
- Compare the results of your timings between the two SQL INSERT statements. Which one was faster? Which SQL INSERT would you choose?
I’ll show you my solution to this exercise. First, here’s the SQL INSERT statement from Listing 5-14, modified to include tables GENDER_TYPES and WORKER_TYPES in its SELECT statement:
insert into WORKERS (
       id,
       worker_type_id,
       external_id,
       first_name,
       middle_name,
       last_name,
       name,
       birth_date,
       gender_type_id)
select WORKERS_ID.nextval,
       decode(mod(WORKERS_ID.currval, 2),
         0, c1.id, c2.id),
       lpad(to_char(EXTERNAL_ID_SEQ.nextval), 9, '0'),
       first_name,
       letter||'.',
       last_name,
       WORKER.get_formatted_name(
         first_name, letter||'.', last_name),
       DATE_.random(
         to_number(to_char(SYSDATE, 'YYYY')) - 65,
         to_number(to_char(SYSDATE, 'YYYY')) - 18),
       decode(gender_code, 'F', c3.id, c4.id)
from   TOP_100_LAST_NAMES,
       TOP_100_FIRST_NAMES,
       A_THRU_Z,
       WORKER_TYPES c1,
       WORKER_TYPES c2,
       GENDER_TYPES c3,
       GENDER_TYPES c4
where  c1.code = 'E'
and    c2.code = 'C'
and    c3.code = 'F'
and    c4.code = 'M';
And here’s the Optimizer’s plan for this SQL INSERT statement:
Explained.

Plan hash value: 599918850

-----------------------------------------------------------------------------
| Id  | Operation                                  | Name                   |
-----------------------------------------------------------------------------
|   0 | INSERT STATEMENT                           |                        |
|   1 |  LOAD TABLE CONVENTIONAL                   | WORKERS                |
|   2 |   SEQUENCE                                 | WORKERS_ID             |
|   3 |    MERGE JOIN CARTESIAN                    |                        |
|   4 |     MERGE JOIN CARTESIAN                   |                        |
|   5 |      MERGE JOIN CARTESIAN                  |                        |
|   6 |       MERGE JOIN CARTESIAN                 |                        |
|   7 |        NESTED LOOPS                        |                        |
|   8 |         NESTED LOOPS                       |                        |
|   9 |          TABLE ACCESS BY INDEX ROWID       | GENDER_TYPES           |
|* 10 |           INDEX UNIQUE SCAN                | GENDER_TYPES_UK        |
|  11 |          TABLE ACCESS BY INDEX ROWID       | GENDER_TYPES           |
|* 12 |           INDEX UNIQUE SCAN                | GENDER_TYPES_UK        |
|  13 |         TABLE ACCESS BY INDEX ROWID        | WORKER_TYPES           |
|* 14 |          INDEX RANGE SCAN                  | WORKER_TYPES_UK        |
|  15 |        BUFFER SORT                         |                        |
|  16 |         TABLE ACCESS BY INDEX ROWID BATCHED| WORKER_TYPES           |
|* 17 |          INDEX RANGE SCAN                  | WORKER_TYPES_UK        |
|  18 |       BUFFER SORT                          |                        |
|  19 |        INDEX FULL SCAN                     | A_THRU_Z_PK            |
|  20 |      BUFFER SORT                           |                        |
|  21 |       INDEX FAST FULL SCAN                 | TOP_100_LAST_NAMES_PK  |
|  22 |     BUFFER SORT                            |                        |
|  23 |      INDEX FAST FULL SCAN                  | TOP_100_FIRST_NAMES_PK |
-----------------------------------------------------------------------------

------ -----------------------------------------
| Id   | Rows  | Bytes | Cost (%CPU)| Time     |
------ -----------------------------------------
|   0  |   260K|  9648K|   723   (1)| 00:00:01 |
|   1  |       |       |            |          |
|   2  |       |       |            |          |
|   3  |   260K|  9648K|   723   (1)| 00:00:01 |
|   4  |  2600 | 75400 |    16   (0)| 00:00:01 |
|   5  |    26 |   572 |     7   (0)| 00:00:01 |
|   6  |     1 |    20 |     6   (0)| 00:00:01 |
|   7  |     1 |    15 |     4   (0)| 00:00:01 |
|   8  |     1 |    10 |     2   (0)| 00:00:01 |
|   9  |     1 |     5 |     1   (0)| 00:00:01 |
|* 10  |     1 |       |     0   (0)| 00:00:01 |
|  11  |     1 |     5 |     1   (0)| 00:00:01 |
|* 12  |     1 |       |     0   (0)| 00:00:01 |
|  13  |     1 |     5 |     2   (0)| 00:00:01 |
|* 14  |     1 |       |     1   (0)| 00:00:01 |
|  15  |     1 |     5 |     4   (0)| 00:00:01 |
|  16  |     1 |     5 |     2   (0)| 00:00:01 |
|* 17  |     1 |       |     1   (0)| 00:00:01 |
|  18  |    26 |    52 |     5   (0)| 00:00:01 |
|  19  |    26 |    52 |     1   (0)| 00:00:01 |
|  20  |   100 |   700 |    15   (0)| 00:00:01 |
|  21  |   100 |   700 |     0   (0)| 00:00:01 |
|  22  |   100 |   900 |   723   (1)| 00:00:01 |
|  23  |   100 |   900 |     0   (0)| 00:00:01 |
------ -----------------------------------------

Predicate Information (identified by operation id):
---------------------------------------------------

  10 - access("C4"."CODE"='M')
  12 - access("C3"."CODE"='F')
  14 - access("C1"."CODE"='E')
  17 - access("C2"."CODE"='C')

38 rows selected.
The SQL INSERT statement with the GENDER_TYPES and WORKER_TYPES tables in its SQL SELECT statement is less efficient (cost equal to 723 vs. 717) according to EXPLAIN PLAN. What about how long it actually takes to execute? On my machine, it’s actually three seconds faster than the SQL INSERT statement from Listing 5-14! So much for my experience!
The moral of this story is that you can’t assume anything. You must always test the actual performance of your SQL statements before and after you’ve made modifications to the database, or to your SQL statements, in order to improve performance.
If you want a larger view of SQL statement performance, then perhaps you should use TKPROF.
TKPROF is a tool that’s normally available only to your DBA. You’re nice to your DBA, aren’t you? So asking for his or her help in accessing trace files won’t be a problem, right?
TKPROF is a utility that you can use in conjunction with session or system tracing to format the output of tracing into plans similar to those generated by EXPLAIN PLAN. The big difference is that you can gather statistics using package SYS.DBMS_MONITOR, which in turn will create trace files. Then you can use the trcsess utility to format the trace information into a format for TKPROF, and use TKPROF to format the output of the trace files into information you can use to examine the efficiency of an application’s SQL statements as they were actually executed in a database.
To use TKPROF, follow these steps.
- Utilize package DBMS_MONITOR to trace your application’s use of SQL.
- Use the trcsess utility to consolidate trace information into a file that can be analyzed using TKPROF.
- Examine the consolidated trace file using TKPROF, in order to determine high-cost SQL statements in your application.
Using TKPROF, you’ll be able to see the following for each SQL statement executed while you’re monitoring the database:
- Resources consumed
- Number of times it was called
- Number of rows processed
- Optimizer’s execution plan
Once you’re armed with this information, you can use EXPLAIN PLAN to determine if there is a better alternative SQL statement, or if you need to come up with an entirely new solution. You may also want to investigate using package SYS.DBMS_SQLTUNE to help you decide how to properly tune a SQL statement.
You can find more information about performance tuning and EXPLAIN PLAN in the Oracle Database Performance Tuning Guide. You can find more information about the SYS.DBMS_* PL/SQL packages mentioned in this chapter in the PL/SQL Packages and Types Reference.
So what have you learned?
Summary
This chapter was all about troubleshooting. First, I discussed how to reduce the amount of troubleshooting you may have to do by simply preventing trouble in the first place. Second, I talked about adding troubleshooting-enabling code into your PL/SQL program units as you go, in anticipation of and preparation for trouble. Next, I covered four different troubleshooting tools:
Armed with these tools, you’ll be able to handle any PL/SQL problem that comes your way. Now that you know how to fix any defect, how do you go about finding them all? By testing! And that’s what I’m going to cover next.