Chapter 8
Effectively Using Xcode
In This Chapter
![]() Developing your app’s UI using Xcode storyboards
Developing your app’s UI using Xcode storyboards
![]() Analyzing and refactoring your app’s code using Xcode tools
Analyzing and refactoring your app’s code using Xcode tools
![]() Managing your app’s lifecycle using Git
Managing your app’s lifecycle using Git
![]() Adding and removing files from your device
Adding and removing files from your device
![]() Tracking and debugging your app
Tracking and debugging your app
Developers who programmed in the early days of C and C++ used command-line tools and obscure Unix commands to compile, run, debug, and test their programs. Those tools were easy to use but limited in their support of large or complicated programs. They certainly didn't support use of frameworks or visual software development. Nowadays, of course, we have IDEs like Xcode.
Xcode is a comprehensive and powerful integrated development environment (IDE) that makes large-scale iOS development much easier. It allows you to specify several aspects of your app graphically — such as the UI and its linkages to code. It provides a visual debugger and a framework for testing your app thoroughly before release.
In Chapter 5, I introduce Xcode (version 5) and its capabilities. This chapter builds on that information to specifically explain important capabilities of Xcode for iOS app development. I begin with an overview of Xcode and then explain Xcode’s features for developing, testing, debugging, and managing iOS apps, including Xcode’s features for tracing an app’s progress using logging and instrumentation.
My goal is to give you the knowledge necessary to effectively leverage your IDE’s capabilities to build enterprise-class, commercially viable iOS apps.
Xcode and IOS — A Beautiful Friendship
Xcode consists of a comprehensive set of developer tools for creating iOS applications for the iPhone and iPad (and for Mac, as well). It comes with a workspace of tools for building, testing, deploying, and maintaining apps. These tools consist of interactive utilities such as these:
- A file-browser-like component that you can use to navigate to all the components of your app
- Graphical tools for designing the screen flow and layouts for each screen without writing code
- An editor for writing and editing code
- Inspectors for editing classes
- Graphical tools for connecting views, and view controllers, and so on (see Figure 8-1)
- A testing framework
- Integration with source code control systems like these:
- Subversion (http://subversion.apache.org)
- Git (http://git-scm.com)

Figure 8-1: Components of an Xcode workspace.
It's clear that Xcode provides a comprehensive set of tools for managing the soup-to-nuts lifecycle of an iOS app.
In the following sections, I explain these capabilities. In keeping with the theme of this book, the underlying thread will be the object-oriented development process.
Setting up your app’s project
In this section, I'm assuming that you created your app’s use cases and laid out the screen flow for the app as shown in Chapter 7. (Figure 8-2 shows the Tic-Tac-Toe screen flow, which is a typical screen flow for an app.) I also assume that you've done an initial OO design and know the classes you need and the methods and collaborators for each class (again, as shown in Chapter 7). With those tasks done, you're ready to start making your app.
You now need to create an iOS project for your app in Xcode. So, go ahead; fire up Xcode. When the Xcode splash screen appears, select Create a New Xcode project.
If you aren't the first (or only) user of Xcode on your computer, the splash screen may not appear, in which case, you're taken directly to a screen that looks like Figure 8-1. If that happens, simply choose File⇒New⇒Project to create a new project.

Figure 8-2: Screen-flow diagram of the Tic-Tac-Toe game.
A screen filled with application templates appears, as shown in Figure 8-3.
Click each application template to see a brief explanation of what it's designed for.
The Empty Application template is a bare-bones template, which means you must create all your app's components from scratch — views, view controllers, model classes, and so on. For current purposes, that's the route you take.
Click the Empty Application template. A screen appears where you can name the app and set the class name's prefix string for the classes in your project. (Objective-C doesn't support namespaces; therefore, each class must have a unique name.) In my example, I named the app Tic-Tac-Toe-Chapter-8 and used TTT as the prefix for the class name. As a result, all the class names in this project start with TTT. I set the target device as iPad, and left the other fields with their default values.
After you provide the information and click Next, you're asked to select the folder where the project will be stored. If you just click Next, the app's project workspace appears, as shown in Figure 8-4. In this figure, note that I expanded all the folders using the Project Navigator in the Navigator area (refer to Figure 8-1). You need to do the same to reproduce what this figure shows.

Figure 8-3: Xcode application templates.
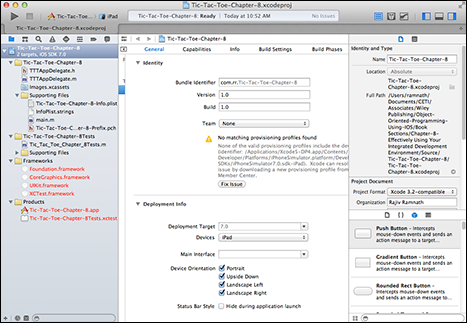
Figure 8-4: Project workspace for an empty application.
Creating your app’s screen flow
After you create the project, you're ready to create a storyboard that captures the screen flow for the app. As I explain in Chapter 7, storyboards give developers a declarative (non-programming) way to lay out the screen flow of an app, as well as define the layout of each screen in the app. A storyboard consists of the following:
- A graphical representation of each screen in an app
- A specification of the transitions between screens known as segues
When you use the Empty Application template to create the project, you need to add a storyboard file. To do so, follow these steps:
- Choose File⇒New⇒File.
The screen shown in Figure 8-5 appears, where you can select a template for the new file.

Figure 8-5: Selecting a template for a new file.
- Select User Interface on the left panel under iOS and then select Storyboard to add a storyboard file.
Figure 8-6 shows that I named this file
Main.storyboard, but feel free to pick any name you want as long as it has the.storyboardextension. Leave the Where box as is, so that the storyboard will be saved in the same folder as the rest of your project’s files.In the figure, you see I placed a check mark beside Tic-Tac-Toe-Chapter-8, which is the app build target in this case. This step makes the storyboard a member of the app build target, so when the app is built, the storyboard is included in the build.

Figure 8-6: Naming and setting the membership of a storyboard.
Make sure you check the app build target; otherwise, you’ll get weird errors that will take hours to debug. However, if you forget to check the target when you add the storyboard, you can do so later.
 If you forget to make the storyboard a member of the app target, you can do so by selecting the storyboard using the File inspector, located on the right side of the workspace (see Figure 8-7). While you're in the File inspector, take a look at what else is there. Notice that you can build the storyboard for different targets and have different background colors (try changing the Global Tint to a different color to see how your app looks). You can also manage it in a source code control repository because a storyboard file is actually kept in XML.

Figure 8-7: Using the File inspector to set the membership of a storyboard.
After you add the storyboard, you need to configure the project to use it, as follows:
- Edit the
.plistfile.Open the file with the
.plistextension —Tic-Tac-Toe-Chapter-8-Info.plist(plist stands for property list file). - Add a new row to the Information Property list.
Move your mouse past the last row of the Information Property list. Right-click and select Add Row.
- Set the value for the new row.
If you select the new row that you just added, it becomes a drop-down list. Select the entry
Main storyboard file base name. Move your mouse to the right, under the Value column, and set the value for the new entry you just added toMain.Figure 8-8 shows the final result.
- Edit the app delegate file.
Using the Project navigator, locate the app delegate file (in this case,
TTTAppDelegate.m) and locate the methoddidFinishLaunching WithOptions(see the following code).
Figure 8-8: Linking the storyboard in the
.plistfile. - Edit the
didFinishLaunchingWithOptionsmethod.Comment out (or simply delete) all the lines except for the
return YESstatement.- (BOOL)application:(UIApplication *)application
didFinishLaunchingWithOptions:(NSDictionary *)launchOptions
{
// self.window = [[UIWindow alloc]
initWithFrame:[[UIScreen mainScreen] bounds]];
// Override point for customization after application launch.
// self.window.backgroundColor = [UIColor whiteColor];
// [self.window makeKeyAndVisible];
return YES;
} - Right-click the storyboard file and choose Open As⇒Source Code.
The storyboard appears, shown in XML.
Now it's time to set up the scenes and the screen flow. To add a scene, follow these steps:
- Edit the storyboard file.
Select the storyboard file for the project (for this project the file is named
MainStoryboard.storyboard).A blank canvas appears.
- Show the Object Library.
In the Utility area (refer to Figure 8-1), click the little cube shown at the lower-right of the screen below the panel labeled Text Settings. The cube will become blue.
Hover the cursor over the cube, and a tooltip displaying Show the Object Library appears.A collection of classes appears, with the first class being View Controller (see Figure 8-9).

Figure 8-9: Classes in the Object Library.
- Add a view controller to the storyboard:
- Select View Controller and drag it onto the canvas.
- Zoom the scene to 100% (by right-clicking on a blank area on the storyboard canvas).
- Scroll down the Object Library until you see typical UI classes (buttons, labels, and the like).
- Drag and drop a label (a class named
UILabel) where you need to on the screen. Double-click the label and enter Welcome to Tic-Tac-Toe! - Drag and drop a button (a class named
UIButton) where you need to on the screen. Double-click the button and enter Start a New Session.
- Add the second scene.
- Drag in a view controller to create a scene.
- Drag in a view (a class named
UIView). - Drag in two text fields (each of a class named
UIText).One text field shows the game status, and the other one shows the accumulated scores of each player in that session.
After you're familiar with the UI elements, you can get an element by clicking a row in the list of elements and typing the name of the element you’re looking for. - Stitch the scenes together.
In the screen flow for Tic-Tac-Toe, the goal is to click the Start New Session button to bring up the second screen. Place the cursor on the Start New Session button and Control-drag from there to the second scene.
When you release the cursor, you're prompted to make a selection that sets the segue's type.
- Select Modal.
A segue from Start New Session in the first scene to the second is created. The resulting storyboard should look like Figure 8-10. And you haven’t written a lick of code.

Figure 8-10: A storyboard with two screens and a connecting segue.
You can now test the screen flow:
- Go to the main menu, click Product, and select Run.
The program starts and the first scene appears.
- Click Start New Session.
The second scene appears. “Magic,” you say. “The magic of iOS storyboards,” I say. Of course, you still have to write the code to implement the game's functionality, but, hey, every little bit helps.
The view controllers that you dropped into the storyboards to create the scenes will, by default, use the base view controller classes. These, obviously, have no app-specific functionality. To add this functionality, you do the following:
- Create your own view controller (which is a subclass of the base view controller).
- Implement app-specific methods and link the scene view controllers to those classes.
To see an example of an app-specific view controller, follow these steps:
- Open the Tic-Tac-Toe-Chapter-8 project in Xcode (which has a complete, runnable implementation of Tic-Tac-Toe).
Files corresponding to two view controller classes appear:
TTTGameOptionsViewControllerTTTGameSessionViewController
- Click the storyboard file named
MainStoryboard.The storyboard canvas appears, along with its two screens and the segue, as shown in Figure 8-11.
Zoom out until you see the entire storyboard; 25% should do it (refer to Figure 8-9). - Click one of the scenes to select it (the outline of the screen will turn blue); then in the Inspector pane on the right, click the Identity inspector.
- The first scene is shown as a custom class with its
Classfield set toTTTGameOptionsViewController. - The
Classfield for the second scene is set toTTTGameSessionViewController.
These fields are set manually; that is, you type the class names. After you set the linkages, the iOS runtime instantiates and uses the app’s view controllers as the scenes become active.

Figure 8-11: Connecting a scene to a custom view controller.
- The first scene is shown as a custom class with its
After setting the view controller’s custom class, you can use the Attributes inspector to specify additional custom settings. For example, a view controller can be the manager of the first scene in the storyboard. You can also set other characteristics of the scene, such as the appearance of the title bar.
There are also multiple kinds of segues. The segue that you created earlier automatically transitioned the app from the Game Options scene to the Game Session scene when the Start New Session button was clicked. However, you may want to control the transition. For example, say that you want to check some entered values and then transition to the second scene only if the values are valid. To do so, you use what is known as a manual segue that's linked from the top-level view controller to the view controller of the second scene. The segue in the Tic-Tac-Toe app is a manual segue.
To use a manual segue, you must give it a name; I named this segue segueToGameSession.
You execute a manual segue by using the performSegueWithIdentifier method in your program's code, as shown in the following snippet from the startNewGame method in TTTGameOptionsViewController (note that the string "segueToGameSession" in the code matches what's shown in the Identifier field in the Attribute inspector.
- (IBAction)startNewGame{
[self performSegueWithIdentifier:@"segueToGameSession" sender:self];
}
Finally, you can set cool visual effects for the transition.
For complete details on how to work with storyboards, scenes, and segues, go to www.dummies.com/go/iosprogramminglinks and check out the Working with Storyboards link.
Writing your app’s code
Before I show you what Xcode provides for writing code, let me tell you what structure your app will have. You may recall that in earlier chapters, I mention that the Model-View-Controller (MVC) is the dominant pattern in an iOS app. In fact, an app can be thought of as a collection of MVCs working together.
You can implement most of the view functionality of an MVC component using storyboards and scenes. After you implement the views, the controller and model logic needs to be implemented. For this, you must write code.
Incidentally, some custom views also need actual code (for example, the Tic-Tac-Toe board). So let me start with how to create a custom view. First, you have to add such a view to a scene (as shown in the previous section). Then you set the class of the view to a custom subclass using the Identity inspector (see Figure 8-12).
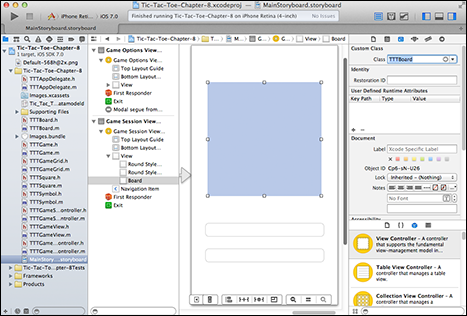
Figure 8-12: Setting the class of a view using the Identity inspector.
Of course, you need to implement the class for this custom view. In addition to the custom view classes, you need to write the code for the model and the controllers (or view controllers in iOS terminology). For all of these elements, you need to create Objective-C classes. To create a class, any class, follow these steps:
- Choose File⇒New⇒File.
The set of file templates appears (refer to Figure 8-5).
- Select Cocoa Touch and Objective-C class, then click Next.
A dialog box for naming the class appears.
- Name the class and set the superclass. Then click Next.
A dialog box for saving the file appears. This dialog box also allows you to set the project target for the file.
- Set the target of the file to be the current project and save the file in the project's folder.
Check the box next to the target (see Figure 8-13) to make the class you added a member of the target. Note that the default directory shown is the project’s folder. Just stay with the default.
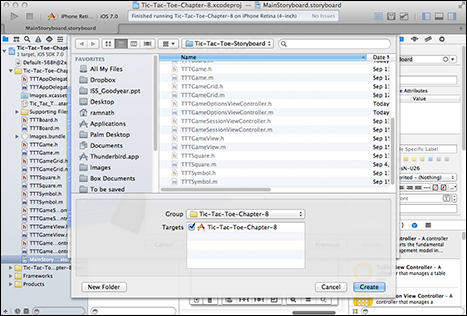
Figure 8-13: Creating the files for a class and setting its target.
- Click Create.
Two files are added to the project — an interface file (
.h) and an implementation file (.m) — both with boilerplate code specific to the kind of class they represent (for example, the superclass of the new class).
Now you can knock yourself out writing code. Of course, my job in this chapter is to show you how to use the Xcode IDE to do so.
In order to edit a file in the project, click the filename in the Project navigator. The text in the files appears in the Editor area in Xcode (where the storyboard canvas was in the previous section). The Xcode editor allows you to type and format your code as you do with other interactive editors. It also has a lot of cool features (similar to the features found in other IDEs, such as Eclipse). For example, as you type code, the editor provides suggestions for completing variable declarations, commands, method calls, and the like. Figure 8-14 shows a sampling of the Xcode editor's autocomplete capabilities.
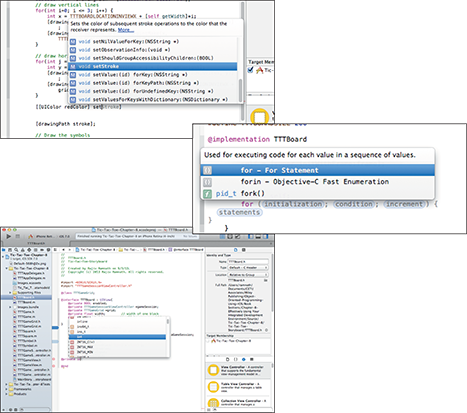
Figure 8-14: Autocomplete capabilities of the Xcode editor.
The Xcode editor also incrementally checks the syntax of your code as you go. These incremental checks of syntax and the autocomplete feature are examples of how Xcode's incremental compiler tools (clang and llvm) work together to interpret your code and provide context-sensitive help.
Xcode also interprets your Objective-C code so that it can provide you with graphical help for user-interface wiring.
To see an example of user-interface wiring to code, take a look at the following snippet from the interface file TTTGameSessionViewController.h, where three properties are declared, each of type IBOutlet:
@property (nonatomic, retain) IBOutlet TTTBoard *boardView;
@property (nonatomic, retain) IBOutlet UITextField *scoreTextField;
@property (nonatomic, retain) IBOutlet UITextField *turnTextField;
A variable with the tag IBOutlet is known as an outlet, and used within a view controller to hold a reference to a view element (such as a text box) inside the view hierarchy managed by the view controller. When Xcode sees that a variable has been tagged in this manner, Xcode recognizes this variable as an outlet and allows you to graphically link a view element to it. Here's how to link an outlet to a text field:
- Control-click and drag the mouse from the view controller to the UI element.
A pop-up menu showing the outlets in the view controller appears.
- Select the right outlet for the UI element.
See Figure 8-15 for an example of how turnTextField is wired to the text field used to show the game's status.
Note that the pop-up menu shows only the candidate outlets that are compatible with the UI element. In the preceding example, boardView isn't shown as a potential outlet for the text field. This is because boardView is of type TTTBoard, which isn't compatible with the text field, which is of type UITextField.
You can also graphically wire a method to a UI element to make the method the action for a user-interface event such as a button click. An example of an action method is shown here (from the file TTTGameOptionsViewController.m):
- (IBAction)startNewGame{
[self performSegueWithIdentifier:@"segueToGameSession" sender:self];
}

Figure 8-15: Wiring an outlet to a view element.
This kind of wiring is shown in Figure 8-16. Here, you Control-drag from the UI element to the view controller and then select the appropriate method from the pop-up menu that appears.
You can view the wirings between an outlet to a UI element or from a UI element to its actions by selecting the element and then clicking the Connections inspector.
Managing and maintaining your app’s components
This section describes the capabilities in Xcode that help you improve the quality of your code and manage it better. These capabilities include using the static analyzer to identify potential problems in your code and tools for refactoring your code.

Figure 8-16: Setting up an action for a UI event.
Using the static analyzer
The static analyzer examines and analyzes your source code and points out any issues it finds, such as these:
- Accessing uninitialized variables
- Dereferencing null pointers
- Leaking allocated memory and unused variables
- Library usage flaws that result from violating policies required by the libraries
You run the static analyzer by choosing Product⇒Analyze. After the analyzer runs, any errors it finds appear in the Issue navigator, as shown in Figure 8-17. They are as follows:
- The first error the static analyzer points out occurs in the
Gameclass (seeTTTGame.m): I used the instance variablegameGridin theinitmethod without properly initializingself(the current, newly created instance) by calling[super init]. Adding the call to the superclass’sinit(see following code) fixes the error.-(id) init { //Constructor
self = [super init]; /// Initially missing
gameGrid = [[TTTGameGrid alloc] init];
gameState = Active;
currentSymbol = [TTTSymbol SymbolXCreate];
currentPlayer = Player1;
return self;
} - The second error is in the
GameGridclass, where the static analyzer (rightly so) points out thatfoundIndexis never used after it's set.-(BOOL) isRightToLeftDiagonalFilled{//Right diagonal has the same symbol
int foundIndex=-1;
BOOL isFilled=false;
BOOL foundMismatch=false;
for(int index = GAMEGRIDSIZE-1; (index >= 0)&&(!foundMismatch); index--){
if(grid[0][GAMEGRIDSIZE-1] !=
grid[GAMEGRIDSIZE-1-index][index]){
foundMismatch=true;
foundIndex=index; // Unused variable
}
}
isFilled = (!foundMismatch) &&
(grid[0][GAMEGRIDSIZE-1] !=
x[TTTSymbol SymbolBlankCreate]);
return isFilled;
}
I left the preceding errors in the code so that you can run the analyzer yourself and see the same results. Note that neither error causes the program to fail, so (for example), the debugger wouldn't catch them. For more on the analyzer, see the link labeled Static Analyzer in the web resources for the book at www.dummies.com/go/iosprogramminglinks.

Figure 8-17: Errors found by the static analyzer.
Restructuring your code using refactoring tools
You can use the refactoring tool in Xcode to clean and restructure your code. With this tool, you can
- Rename a symbol (such as a variable or a method) to better reflect what the method does.
- Take inline code and make it a method.
- Create a superclass (a skeleton of one, at any rate).
- Move methods from a class up to a superclass or from a superclass down to a subclass.
The refactoring process is straightforward, which will become clear if you join me by taking the following steps in which a method name is changed:
- In the Source editor (see Figure 8-18), select a piece of source code that you want to refactor — in this case,
getBitmapForSymbol. - Rename it
getBitmapbecause it's a method of theSymbolclass. - Choose the appropriate refactoring command. In this example, I chose Edit⇒Refactor⇒Rename.
Xcode prompts you for the new name.
- Enter the new name.
- Click Preview.
A preview of the changes appears (see Figure 8-19).
- Deselect changes you don’t want to make and click Save.
The first time you try to do any refactoring, you’ll be prompted to enable (or disable) Automatic Snapshots. I recommend that you enable snapshots, at least the first few times that you refactor code. Incidentally, I discuss snapshots in the next section.

Figure 8-18: Refactoring a method name.

Figure 8-19: Preview window showing the effects of refactoring.
For more details on refactoring, go to the link labeled Refactoring in the web resources for this book at www.dummies.com/go/iosprogramminglinks.
Managing versions of your project
When you're taking an app through active development, you'll often try out a few ideas to see if they work, while planning to revert back to your old code if the ideas don’t pan out. Xcode provides a useful snapshot capability to help you do this experimenting easily. You can save named images of your project as you go, and when you need to revert back to one, you can just select and revert back to it. Figure 8-20 shows you how to create a snapshot. After you initiate the snapshot, you’re asked to give it a name. Do so and click Create Snapshot, and the snapshot is saved.

Figure 8-20: Creating a snapshot in Xcode.
You initiate the restore process by choosing File⇒Restore Snapshot. A list of snapshots appears. Select one of them, and you see the difference between the snapshot and the current state of the project (as shown in Figure 8-21). If you want to revert to the selected snapshot, click Restore, and the snapshot becomes the current state of the project.
 Snapshots become inaccessible if you change or move the project name because they're stored based on the encoding of the project name. So, if you change the project name, you lose the snapshot history. Also, be aware: Recovering snapshots isn't easy. To find out what to do if you need to recover a snapshot, go to the link labeled Recovering Snapshots in the web resources for the book at www.dummies.com/go/iosprogramminglinks.
Although the snapshots feature is great for individuals experimenting with their app, it doesn't provide enough support for large-scale software development by teams. For that, you need to use a robust source-code management (SCM) system that enables checking in and checking out individual files, creating and merging development branches, and so on.
Currently, the most popular (and free) SCM is Git (https://github.com). Xcode provides built-in support for integrating your project with Git. However, you first must create a repository in your project folder. Xcode creates it for you if you check the box labeled Create git repository at the time you select the folder for the project. (I didn't do that because I want to show you how to bring Git into your project after you create it.)

Figure 8-21: Comparing the snapshot with the current state of the project.
To create a Git repository for your project, navigate to the project folder and create a file named .gitignore with the following content (this file is located in this chapter's project folder; please feel free to copy it and use it for any of your projects):
OS X Finder
.DS_Store
# Xcode per-user config
*.mode1
*.mode1v3
*.mode2v3
*.perspective
*.perspectivev3
*.pbxuser
*.xcworkspace
xcuserdata
# Build products
build/
*.o
*.LinkFileList
*.hmap
# Automatic backup files
*~.nib/
*.swp
*~
This file describes which types of files should not be version-controlled — such as files with compiled object code, executables, and temporary files used by Xcode.
Having a minimal .getignore file is essential for the proper operation of Git and Xcode. Certain files are constantly changed by Xcode, which will cause many Git operations, such as merging branches, to fail.
Exit from Xcode if it's running.
From a Terminal window, navigate to the project directory and issue the following commands from the command line (bravely and without hesitation):
git init
git add .
git commit -m "Initial commit of project"
These commands create the repository with the files that you currently have in your project. Now, bring up Xcode and, on the taskbar, click the Source Control menu, and you'll see the repository as well as the various commands you can use to work with Git.
Figure 8-22 shows what happens when you click Commit to save changes. Note that you can select which files to commit. In fact, you can even select changes to be committed at the individual method level. Also, note that unlike creating snapshots, committing files creates versions of only the changed files. This approach is more efficient than snapshots that copy the entire project.
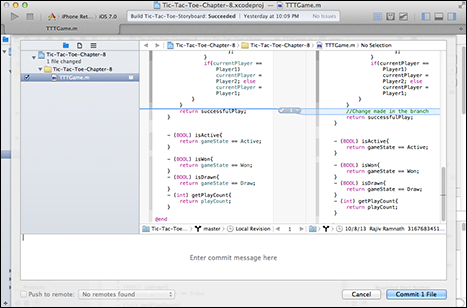
Figure 8-22: Committing files to Git.
Figure 8-23 shows the project history after several changes are committed.
Other capabilities in Git include creating a branch (essentially a snapshot) of all the files in your project and merging the main repository to a branch, and vice versa. This branching capability is often used in place of creating snapshots. At any time, you can switch back to a branch. Figure 8-24 shows you how.

Figure 8-23: Git project history.

Figure 8-24: Switching to a branch in Git.
The integration of Xcode with Git is somewhat minimal in that certain useful SCM functions are missing, such as being able to revert back to specific versions of files. Xcode also doesn’t show the proper hierarchy of branches. That is, if you create a branch from the main trunk and another branch from the first branch, it shows all the branches at the same level, as opposed to a hierarchical structure, which clearly shows that the branch structure is Main->Branch-1-> Branch-2.
Incidentally, using local Git repositories (or, for that matter, snapshots) doesn’t help much when teams need to develop code collaboratively. To do that, you must create or link to a Git repository on a server. The easiest place to create a Git repository is on GitHub (https://github.com). Using remote repositories is beyond the scope of this book. However, go to https://help.github.com for information on how to do so. Also, for an extensive, but now dated, tutorial on Git, go to the link labeled Git Tutorial in the web resources for this book at www.dummies.com/go/iosprogramminglinks.
Using external tools within Xcode
You can access several external tools from Xcode. One is the FileMerge tool, which allows you to compare and merge two text documents (and, of course, source code). You launch this tool by choosing Xcode⇒Open Developer Tool⇒FileMerge. Select two files, and you see the differences between them (see Figure 8-25).

Figure 8-25: Comparing files in FileMerge.
 All the standard Unix command-line tools, such as make, are available for download from Apple. This means you can build and manage your iOS programs completely outside Xcode. For more details, go to the link labeled Unix tools for Xcode at www.dummies.com/go/iosprogramminglinks.
Fine-Tuning Your App in Xcode
In this section, you find out how to configure your app so that it's built for specific iOS versions, as well as how to use advanced capabilities such as iCloud, in-app purchasing, maps, and so on. You discover how to use the iOS simulator, add resources (such as image files) to your device, extract data saved by your app on the device, and debug your app; as well as how to collect data about how fast your app is running, how many resources its consuming (such as memory), and so on.
Configuring your app
In this section, I show you how to configure the settings of your app (such as the package name). I also show you how to provide resources to your app (such as images).
Settings
You can see the settings of your app in the Editor area by clicking the app's name in Xcode (see Figure 8-26). Start with the General tab and then click all the tabs to see what’s in each of them.
- On the General tab, you can change the package (or bundle) identifier (which you set when you created the project), the version of iOS you want to build the app for, the libraries you want to link to, and so on.
- On the Capabilities tab, you can turn on additional capabilities for your app — such as using iCloud, In-App purchasing, and maps.
- The Info tab shows another group of settings, such as the orientations your app is built to deal with and the language it uses.
- As its name implies, the Build Settings tab shows the build settings — the target platforms, the compiler settings, and so on. You can add custom C and C++ symbol definitions here.

Figure 8-26: General settings for your app.
- The Build Phases tab is where you add additional libraries to be linked into the app. This tab also shows all the source files that will be compiled for your app; if any are excluded, here’s where you remove them. You can also change the order in which the files are compiled, if there are dependencies.
- Regarding the Build Rules tab, Xcode processes your files based on a set of rules for each file type. For example,
plistfiles are copied into the product using theCopyPlistFilescript.
Resources
The second aspect of configuration involves the resources needed for your application to run properly, such as images. For example, Tic-Tac-Toe uses images to display the X and O (and the blank) symbols. These images are put into a special folder called a bundle and compiled into your application's executable file. You create a bundle by choosing File⇒New File, selecting a Settings Bundle file template, and naming the file. This bundle, which is really a folder, is placed in your project, and you can fill it with images and other files by dragging them from your Finder and dropping them into the bundle.
From within your program, you can access bundle elements as shown here (taken from the getImageForSymbol method in the Symbol class, in the file named TTTSymbol.m):
...
if (!bitMapsInitialized){
NSString* imagePath = [[NSBundle mainBundle]
pathForResource:@"Images.bundle/x" ofType:@"png"];
imageX = [[UIImage alloc] initWithContentsOfFile:imagePath];
...
}
Digging into the Simulator
The iOS Simulator enables you to simulate all the iOS devices on several versions of iOS and find major problems in your app before you put it on an actual device. Each device and software version is its own simulation environment with its own settings and files. Having used simulators for software development on other mobile platforms, I can honestly say that Apple’s iOS Simulator is by far the best in terms of look and feel and performance. In addition to being one slick piece of software, it provides additional ways to test your app with developer tools available only for the Simulator. There are, of course, several limitations, which I also briefly talk about.
The easiest way to run your app in the Simulator is to launch it from your Xcode project by first setting the device type and the iOS level in the Scheme pop-up menu, and then choosing Product⇒Run. The app automatically builds and then installs and runs on the chosen device (see Figure 8-27).
Because the available simulators reflect the iOS devices on the market, not all combinations of device and iOS versions are available as simulators.
At times, you may want to launch the iOS Simulator directly — for example, to test how your app launches from the home page or to test a web app in Safari. You can access the home page on the Simulator by choosing Hardware⇒Home.
The Simulator's home page doesn't have all the apps that are installed on a real device. Those that are installed are mostly ones that your app will typically interact with. For example, Game Center is installed so that you can test via the Simulator to see whether a game you're developing is using Game Center correctly.

Figure 8-27: Tic-Tac-Toe running in the Simulator.
To download older simulators, choose Xcode⇒Preferences and click Downloads. In Components, find the legacy simulator version and click Install.
For more about the iOS Simulator, go to the link labeled iOS Simulator at www.dummies.com/go/iosprogramminglinks.
Exploring your iOS device from Xcode
Chapter 5 covers how to install and run your app on a device. In this section, I discuss a few more useful capabilities within Xcode for managing your device.
First, you need to become familiar with the Organizer window, specifically the Devices tab in that window (see Figure 8-28). You open the Organizer by choosing Window⇒Organizer.

Figure 8-28: Seeing devices in the Organizer window.
Figure 8-28 shows the root node of a tree of information. Clicking the root node shows a summary of information about the device. Clicking on each leaf node shows details about the device, such as the screenshots taken of the device.
Other information about an application is shown in the Organizer window. Figure 8-29 shows you the following:
- The provisioning profiles on the device
- The device log
- The private files of an application
- Screenshots from your application
- The console area of your app on the device

Figure 8-29: Device and application information in the Organizer window.
Viewing the private files of an application is especially important. As part of the security architecture of iOS, each app runs in its own sandbox on the iOS device. In other words, each app has its own folder on the iOS file system where it can read and write files. You can copy and paste this folder into your Mac and inspect it.
- Open the Xcode organizer with your device connected.
- Click the Devices tab, click the little arrow next to your device, select Applications, and choose the app that you want to inspect.
- Click the Download button, which becomes active when you select your application.
The device file system is now copied to your Mac, so you can inspect it to your heart’s content.
If Xcode doesn't recognize your iPhone in the Scheme pop-up menu (even though it's connected to the computer), check to be sure the Use for Development option is enabled. Click the iPhone's icon beneath the Devices heading and click the Use for Development button.
Debugging your app
A simple way to watch your application run is by logging. Objective-C provides a simple static method named NSLog to log app execution. Using it is easy: Just embed calls to NSLog(@"<any string>"); where you like in your code and watch these lines as they appear (typically in a console window).
In Xcode, the console window is located at the bottom of the project workspace, but it's sometimes hidden. So, make it appear as shown in Figure 8-30 and watch your NSLog statements as they execute.
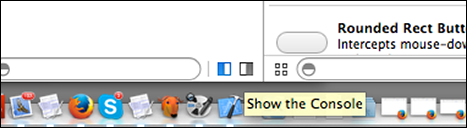
Figure 8-30: Showing the console window in the Debug area in Xcode.
If you don’t have your Console window open in Xcode, you can see your NSLog output in the Console pane of your device in the Organizer window (see the bottom right corner of Figure 8-29).
Of course, you have a full-blown visual debugger at your disposal in Xcode. Figure 8-31 shows the debugger in action (or actually, in inaction because it's stopped at a breakpoint).

Figure 8-31: Stopping at a breakpoint in the iOS debugger.
You can right-click on a breakpoint and set conditions for the breakpoint. For more information on breakpoints, go to the link labeled Breakpoints in the web resources for this book at www.dummies.com/go/iosprogramminglinks.
Using instruments to collect data
Xcode provides a developer tool called Instruments that allows dynamic tracing and profiling of iOS code to help you understand the joint behavior of both the app code and the operating system. To use this tool, follow these steps:
- Choose Xcode⇒Open Developer Tool⇒Instruments.
The Instruments window appears showing a collection of templates.
You can also access Instruments by clicking and holding the Play button and clicking Profile. - Select Blank Template.
The Instrumentation window appears showing a blank area with the message Drag recording instruments here from the Library to set up the Trace Document (see Figure 8-32). If the window with the instruments library does not show, click on the little arrow below the above message (labeled Library).
- Drag and drop one or more instruments from the Library window into the instrumentation canvas.
The selected instruments appear in the Trace Document area
- Select an application to target for the instrumentation.
Figure 8-33 shows you how to select a target for the instrumentation — in this case, the Tic-Tac-Toe-Chapter-8 application.
Figure 8-34 shows the data collected after an instrumentation run.

Figure 8-32: Adding instruments in the Trace Documents area.

Figure 8-33: Selecting a target for instrumentation.

Figure 8-34: Looking at instrumentation data.
I had to check Hide System Libraries and Objective-C Only in order to see useful data about my app.
Getting Help
As I mentioned at the beginning of this chapter, Xcode is a comprehensive and powerful integrated development environment (IDE) with a rich set of tools to make your development go smoothly, and to remove roadblocks when your development doesn't go smoothly. However, it's a complex system, and much of its functionality is hard for the uninitiated to find.
Plenty of help is available, starting with Xcode itself (see Figure 8-35 on how to invoke Xcode’s built-in help features).
Apple’s docs are also on the web, and they're kept current. The complete documentation of Xcode is here: https://developer.apple.com/technologies/tools/features.html.

Figure 8-35: Built-in help in Xcode.