
Economic Well-Being in the Yellowstone River Valley
Introduction
We operate in a capitalistic society; thus, the economic well-being of the Yellowstone River Valley is defined by the long-term profitability of existing and future industries, services, and other income-generating activities. In general, people do not engage in economic activities that are not profitable because they cannot afford to do so. Put simply by Beattie (2019), “To be sustainable, a business must be profitable” (3).
Over the past 20 years, concerted efforts have gone toward incorporating sustainability goals into business strategies (Dyllick and Hockerts 2002), especially in the context of international supply chains (Mani and Delgado 2019). While it is not surprising to find businesses and industries that are now moving their practices toward better environmental and social sustainability, it is still true that an engaged sustainability business agenda is difficult to maintain (Dyllick and Muff 2016), and profitability remains the key corporate concern (Svensson and Wagner 2015). However, research shows that complex sustainability initiatives are more likely to be successful when employed as a component of a formal business model (Schaltegger, Hansen, and Lüdeke-Freund 2015). Today, it is argued that business sustainability is most successful when managers and engineers collaborate, both within single businesses and as industrywide agendas (Machado and Davim 2020).
In the Yellowstone River Valley, there are many elements that define the local industries and economies. We focus on elements related to a few key resources (Knox and Marston 2016): cultivable lands, water, energy reserves, and “experience” possibilities (sites and activities that generate memorable events). These four resources are key within the local economies, and all four are easily recognized as being dependent on the Yellowstone River—irrigation, drilling processes, hydraulic fracturing, hunting, fishing, birding, and boating are all activities associated with river resources.
In this chapter, we will first examine agricultural industries, which have been important to the valley for over 100 years. In fact, in 1905, the Huntley Project just east of Billings was authorized by the Department of the Interior. Designed to irrigate over 27,000 acres of land, it was one of the first major federal irrigation projects in the American West (Dick 1996). Today, hundreds of thousands of acres are under cultivation in the Yellowstone River Valley, and the productivity of these lands is dependent on resources such as the soils and the water pulled from the Yellowstone River. These agricultural lands would not be nearly as productive without the water coming from the Yellowstone River, and no examination of the economies of the valley could ignore agricultural practices (Figure 2.1).
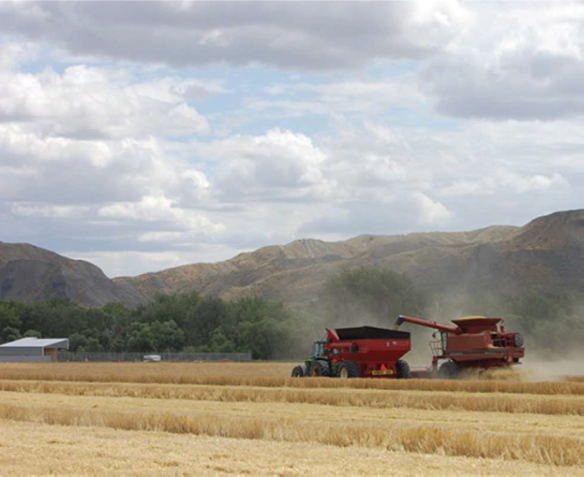
Figure 2.1 Harvest time in the valley
Tourism is a second important economy in the state and the valley (Grau 2018). While the river corridor offers many recreational activities for individuals living in the valley, an abundance of people come to the valley from outside Montana, and even from outside the United States, to enjoy recreational experiences, such as fishing, floating, bird watching, bird hunting, and photography. Park County, one of the gateways to YNP, is perhaps the most dependent on tourism. The towns of Livingston and Gardiner are heavily trafficked in the summer by out-of-state visitors who come for the beauty and uniqueness of YNP. Visitors are also drawn to Paradise Valley, which runs from Livingston to Gardiner, and they infuse the area with money every summer. They even support drift-boat builders who charge tens of thousands of dollars for their custom-designed products (Figure 2.2).
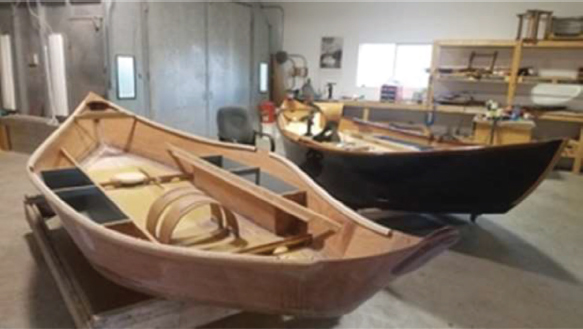
Figure 2.2 Drift boat builder’s shop
The third area of economic activity in the valley we will examine is oil and gas development in eastern Montana (Figure 2.3). This extractive industry is responsible for producing and transporting oil and gas resources from one of the largest energy reserves in North America, the Bakken oil field. This industry has historically, albeit periodically, played an important role in eastern Montana (Hennip 1973). While oil and gas development creates boom-and-bust cycles for these communities, there is little doubt this industry is an important part of the economy of eastern Montana.
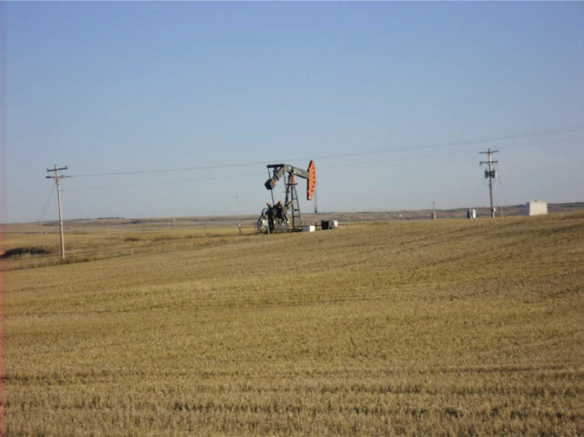
Figure 2.3 Cricket pump in Eastern Montana
Of course, there are other economic activities in the Yellowstone River Valley. However, agriculture, tourism, and the oil and gas industry are three of the most important ones. As we move through this material, keep in mind the key question of economic sustainability: Can we meet our current economic needs without compromising the ability of future generations to meet their economic needs?
Long-Term Profitability of Agricultural Activities
The valley has historically been dependent on numerous agricultural and related industries. Hay, wheat, corn, sorghum, sugar beets, and numerous pulse crops, such as lentils and peas, are grown in the valley. There are no major dams on the Yellowstone River, but there are numerous diversion facilities that allow water to pool and then to be drawn into irrigation canals. Throughout the valley, the river is considered essential to the agricultural community (Gilbertz, Horton, and Hall 2006). The productivity of hundreds of thousands of acres is enhanced by water from the Yellowstone River, and it allows for the long-term profitability of the farms and ranches of the valley. As explained by a family matriarch living near the confluence with the Missouri River, the Yellowstone River is essential and beloved:
It’s a beautiful place to live. We thoroughly enjoy the river, and we talk about it all the time [because] it’s really our lifeblood. We have to have that river to irrigate. And, it’s our recreation, and we just love the river so much. (Farmer near Fairview 2018)
Over 100 miles away, a different farmer said:
It’s my lifeblood … We would be devastated without the Yellowstone River, and we would fight to the death to keep it. It’s important. Gotta have it … Farming is a business. It’s an enterprise, it has to be profitable. That Yellowstone makes me profitable because it guarantees me a crop. If I will do the things that I need to do—plant, fertilize, build my soils, treat this ground right—it will treat us very good in the process. And it has. (Farmer near Terry 2018)
In the lower river valley, near Glendive and Sidney, the farms are especially productive, and the landscape is dominated by cultivated fields. In fact, farm earnings in this area are estimated as 9 to 14 percent of local earnings in these counties (U.S. Army Corps of Engineers and Yellowstone River Conservation District Council 2015, 1363). However, these figures represent only a portion of the total economic input of agriculture to the local communities. These numbers do not account for the earnings of implement dealers, fuel providers, or suppliers selling agricultural products, such as fertilizers and pesticides. Thus, even though the data indicate that governmental and mining activities add more to the local economies than do agricultural earnings (Serbina and Donovan 2015), because of the dominance of agricultural activities on the local landscape, it is not inaccurate for locals to view themselves as living in farming communities. To this point, locals refer to the Lower Yellowstone Project as proof of the importance of agricultural activities.
Known as Intake, the impressive Lower Yellowstone Project is an irrigation facility, established in 1909. It is located a few miles northeast of Glendive (Reach D8), and it provides irrigation water to over 58,000 acres of farmland (U.S. Bureau of Reclamation n.d.a). At Intake, the river is mostly in one large channel, with one notable sandbar and one side-channel to the south. The irrigation infrastructure includes flow-diversion mechanisms that keep the river in one channel. The irrigation canal runs north, away from the river. As do most such systems in the valley, this irrigation system depends on gravity and the carefully designed slopes of the canals, fields, ditches, and drains for dispersal of the water. To get water onto a field, farmers open floodgates, and water from a canal or a ditch flows across their fields. Later, farmers close the floodgates, and a few days after that, they will open the floodgates again.
As a result of irrigation, a tremendous amount of water flows across the landscape annually from May until September. Images of the valley (Reaches D11 and D12) illustrate that within a few miles downriver of Intake, the amount of irrigated farmland begins to expand across the landscape, mostly to the west of the river. Further downriver (Reaches D14, D15, and D16), we find even greater swaths of cultivated land. In these images, the latest generation of pivot sprinkler systems also become apparent on the landscape as circles or half-circles of green. Pivot systems are much more efficient than flood irrigation practices in terms of water use. Some farmers are switching to these systems because they can calibrate water use to only apply enough water to maintain healthy plants. The water savings are often used to expand the total acreage under cultivation, which in turn should enhance profitability. Yet, as explained by an irrigation equipment supplier, the expansion represents a potential threat:
I don’t think we’ve seen a conflict yet as far as the use of the water, but you will down the road. We’re seeing more and more irrigation systems put in every year. It used to be flood irrigation, where they flood mainly the valleys, but now they’ve gone to a sprinkler irrigation system, so now they’re irrigating the hills several hundred feet above the river. (Pump and dredge supplier in Glendive 2006)
The expanding irrigation activities in this area are noticeable on the landscape near Glendive and Sidney. By comparison, upriver in Prairie County, there is little irrigation infrastructure, and the landscape is quite dry (Reach C1). In this area, many families are primarily engaged in ranching operations, using thousands of acres as grazing pastures (Figure 2.4). Unlike in the eastern United States, where grazing capacity is measured in terms of cows per acre, in the arid Yellowstone River Valley, grazing capacity is measured in terms of acres per cow.
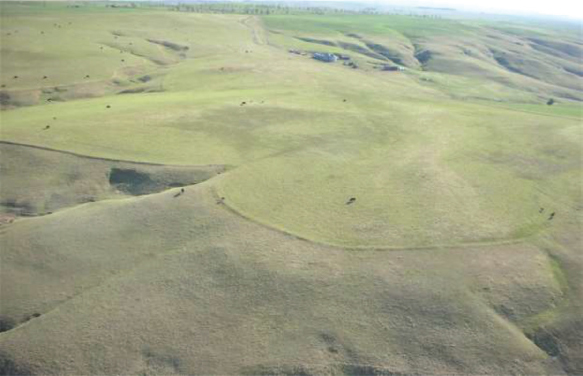
Figure 2.4 Dryland ranching near Columbus, MT
Notably, flood irrigation is still the dominant practice, and it has some important benefits. Much of the water that is diverted from the river for flood irrigation is not used by the plants, and the unused water is not wholly lost. Rather, it soaks into the soil and recharges shallow aquifers. These aquifers store water, and they feed water back toward the river through subsurface gravels. These shallow aquifers also serve many of the homes in the valley (Gilbertz, Hall, and Ward 2013). Thus, sprinkler systems are not without controversy. They are efficient irrigation systems, but if too many of the farmers stop flood irrigation as their primary practice, the water wells in the valley will go dry. Then, water supplies for livestock and for human consumption may also decline.
It is obvious that irrigated lands are much more productive than lands that are not irrigated. Local producers are dependent on the river water for both their yearly and long-term profitability. Unfortunately, and perhaps alarmingly, it is known that the water supply is already overallocated, meaning that if every water-right holder on the Yellowstone River exercises their full measure of water rights, there will not be enough water to satisfy all of the legitimate users (Yellowstone River Basin 2014). Current practices have not led to dire outcomes, but many people worry that running out of water is “just around the corner,” especially if drought conditions are intense or protracted. How the overallocation can happen without running out of water is a function of many users not yet taking their full allocations, a circumstance of “paper rights” verses “use rights” (Anderson et al. 2016).
It is also important to note that nearly every farmer in the region uses chemical fertilizers and pesticides to increase crop yields. Because the investments in terms of monetary costs and effort have been proven to increase profitability, the use of fertilizers and pesticides has increased substantially over the years. An industry watchdog reports that in 1960, nitrogen application averaged 17 pounds per acre, per year. This use peaked in 2007 at a rate of over 82 pounds per acre, per year (Gro Intelligence 2018). Because these applications are expensive, it is fair to assume that most farmers are careful in how they use such chemicals:
I don’t want to hurt anything. For one, it costs me money to waste fertilizer and pesticide … We put just enough on to grow the crop we want, and that’s it. And not only that, on sugar beets if you put too much on, you’ll get no sugar content. So, you don’t over-put it on. You put just the right amount. You want it to grow good until August, and then you want it to peter out. (Farmer near Sidney 2018)
Not only do farmers not want to use more than they need (Figure 2.5), some of these same farmers express concerns about the impacts of the chemicals:
That’s another thing that’s gone, the bees … You know, they’re out in the daytime, and guys spray, and then that kills them immediately. This [neighbor] has these bees, and when we spray, we always let him know. And he says, ‘Well, you can spray in the morning until about 10. So, we always get up right before about five [to spray with that] big old sprayer… That’s what I attribute it [the lack of bees] to. (Farmer between Hysham and Forsyth 2018)
Later, another farmer said, “I’m worried about the bees. I decided to try to something. So, I ordered $5,000 worth of wildflower seeds. If people knew I did that, they would think I was crazy.” (Farmer Telling Secrets 2018)
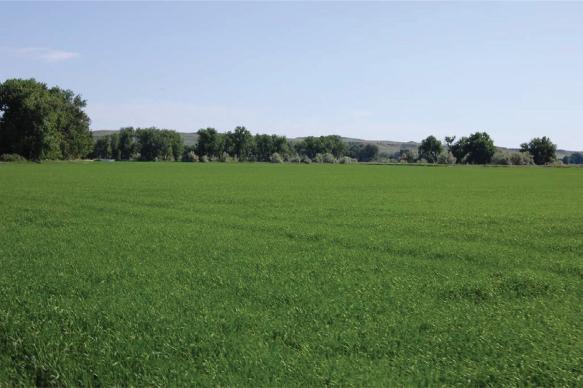
Figure 2.5 Irrigated farmland
The farmers are also aware that many of the applied chemicals are washed away by rains and successive irrigation and that the chemicals can enter the river, directly or indirectly as nonpoint source pollution. In general, it is assumed that water pollution in eastern Montana follows the national trends. Namely, the leading sources of pollutants to the streams and rivers of the United States come from agricultural activities (U.S. Environmental Protection Agency n.d.a). The Environmental Protection Agency (EPA) explicitly lists agricultural activities as a key source of groundwater contamination (U.S. Environmental Protection Agency n.d.b), and runoff from treated fields is known to contaminate many of our rivers and streams (U.S. Environmental Protection Agency 2019). In some regions of the United States, other industries would be likely sources of contamination. However, nationwide, the lack of safe drinking water is, in great measure, a result of upriver agricultural practices.
Water quality is managed through the Clean Water Act. Among other things, the Clean Water Act deals with nonpoint source pollution. Efforts to address pollution are implemented in accordance with the federally mandated Total Maximum Daily Load (TMDL) Program. In the Yellowstone River Valley, the TMDL process has been triggered by nitrate levels associated with nonpoint source pollution, assumed to come from nearby agricultural fields. Water quality tests indicate that seven sections of the river and its tributaries violate federal standards (Montana Department of Environmental Quality 2020). As a means of reducing the costs associated with fertilizers, and (perhaps) to avoid water contamination, new techniques for rotating crops have been adopted by some farmers. This means the farmers alternate types of plantings, and thereby they use the natural resources of different plants, like nitrogen-fixers (e.g., legumes), to replenish certain nutrients to the soils. These rotations are helping reduce the use of fertilizers, but they have a limited capacity in terms of amending overworked soils, especially when farmers are increasingly including second plantings in each growing season. Nearly every farmer in eastern Montana depends on irrigation, fertilizers, and pesticides to boost their yields and to generate long-term profitability for their individual farm operation. Keeping the nutrients and chemicals where they are needed is in the best interest of everyone who depends on the river.
Long-Term Profitability of Tourism
Fishing, boating, camping, and hunting along the river have long been favorite recreational activities of the people of the valley and of visitors. The 60 miles between Livingston and the Roosevelt Arch at Gardiner is a favored route to YNP. From 1882 until 1959, the Northern Pacific Railroad ran passenger links into the park, with the Livingston terminal having a monopoly on such travels for several decades. The historic Italianate style of the Livingston Depot, designed by the architects of New York’s Grand Central Station, welcomed train passengers with open arms (Livingston Depot Foundation n.d.). Today, it is restored to its grand beauty and is used as a special events venue, but for nearly 80 years it served as the beginning point for thousands of visitors’ adventures to YNP. They came from all over the United States and the world (Museum of the Yellowstone n.d.). Then, and today, the route from Livingston to YNP proceeds through the area known as Paradise Valley.
With mountain ranges on each side of the valley, and the Yellowstone River bisecting the terrain, there is every reason to call it Paradise (Figure 2.6). Indeed, Paradise Valley is spectacular in every season, and even though passenger rail service to YNP is no longer available, Paradise Valley’s sweeping views of cottonwood forests, grazing cattle, and river crossings between the snow-capped Absaroka and Gallatin mountain ranges remains a popular passage. Adding to its appeal, the Boulder River and other sites near Livingston were used in 1991 for filming the movie A River Runs Through It. As one local explained, “Ever since that movie, we’re on the map. People from all over the world come here to fish” (Owner of Fly-Fishing Shop in Livingston 2006).
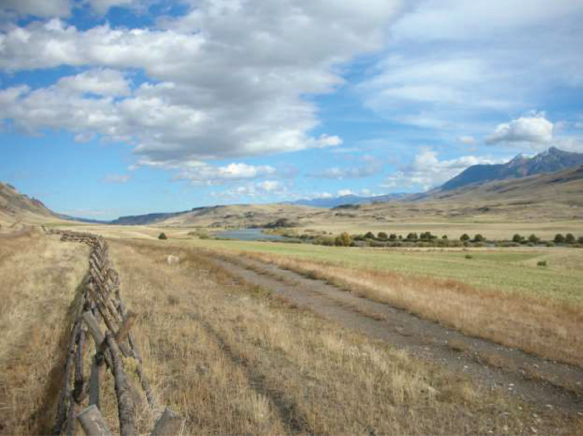
Figure 2.6 Paradise Valley in October
As an important corridor for people to enter and exit YNP, Paradise Valley has become dependent on tourism dollars, and the valley is especially busy with recreational activities during the summer months. As explained in an analysis of traffic in the valley, the number of vehicles on Highway 89 doubles in July as compared with January (Peccia 2013). In 2019, Montana’s Park County was home to approximately 16,600 residents, half of whom resided in the town of Livingston (U.S. Census Bureau 2019a). Of special interest in Park County’s economy, is the number of jobs attributed to nonresident travel. In Park County, in 2014, nonresident spending generated $124.1 million in direct economic activity and another $45.8 million in indirect activity. The top four expenditures by nonresident visitors were fuel, restaurants and bars, lodging, and outfitters and guides (Sage 2016). One can calculate that nonresident spending supported well over 2,000 jobs, either directly or indirectly, and that well over 20 percent of the Park County workforce is earning income based on nonresident travel.
It is possible to visit this area in the fall when one seems to have the valley to oneself; however, innumerable rafts, canoes, and drift boats line the river in an almost bumper-to-bumper fashion during the summer season. In addition to kids on innertubes, high-dollar tourists arrive for dream vacations. These are people who can afford to fly into the area on private jets, who are able to spend $5,000 per day having a local fishing guide teach them how to catch trout, and who might order a $20,000 custom drift boat for their next visit (Gilbertz, Emerson, and Hall 2020). On a hot summer day, there is seemingly no limit to the number of boats or people on the river. One young fishing guide, who had been in the business for five years, noted the increasing summer recreational pressures:
Just in my short guiding career, there is definitely more people on the river. And I don’t know really why that is … Probably one out of the ten boats I see in the summer is a fishing guide. Most of them are just splash and giggle people, as we call them—rafts and party barges. (Young Fishing Guide in Livingston 2018)
In the summer, a visit to Paradise Valley is a highly socialized encounter, especially because even though the number of visitors increases each year, there are only a few designated facilities for launching watercraft. A veteran guide explained the increasing traffic this way:
I don’t want to work on weekends, but I’ve gone up there to do caretaking chores. And if you look upstream from the Mill Creek Bridge, you can see twenty-five floating things up there, and twenty-five floating things down there … Stand-up paddleboards, and kayaks, and rubber duckies, and … the thing I’m seeing now is the really giant raft with the big sun-awning over the top … And there’s six or eight people in the raft … You look around, and you realize the overall pressure. The fish do react when twenty boats run over their heads in a day, and in some of those stretches, it’s just getting to be pretty crazy. I was shocked. I took a client up to Carbella [boat launch] last week … It’s already the first week of October, and it was actually not a terribly great day—kind of cold and windy. And I thought there … won’t be any recreational floaters up here … [I thought] there might be another guide or two. And while I was rigging my boat, probably six guide boats came in … And then, late in the afternoon when I thought nobody would be putting in, I saw three or four more boats come past us. (Veteran Fishing Guide in Livingston 2018)
The public boat launches are busier and busier, in part because, unless one has the express permission from the landowner, it is not legal to cross private property to gain access to the river. With the river in sight from nearly every vantage throughout Paradise Valley, and with hundreds of thousands of visitors to the area each year, trespass issues involving visitors attempting to access the river across private lands are regularly reported in the local news (Cramer 2020). One result of the access issue is that many of the full-time residents of Paradise Valley are engaged in hybrid operations, whereby they subsidize their agricultural incomes with enterprises that capture tourist dollars. For instance, several ranches with properties on the banks of the Yellowstone River provide fee-based access to the river, and in some families, the younger adults provide fishing guide services that more than double the family income when compared with the income generated by agricultural activities.
For the most part, the towns and settlements of Paradise Valley depend on the summer season to provide enough income to survive the winters, and local sensitivities to this economy manifest as ambivalence. On one hand, summer tourism provides immediate and long-term profitability, even for businesses such as the local bookstores, which tend to cater to readers looking for novels set in Montana. On the other hand, tourists are not always respectful of local customs, nor are they knowledgeable of Montana laws. Locals look forward to, and dread, the summer season.
In the summer of 2016, the Montana Department of Fish, Wildlife, and Parks temporarily closed recreational access to the Yellowstone River in Paradise Valley, and many people in the county were affected financially (Montana Fish, Wildlife and Parks 2016b). Fishing guides, boat rental shops, restaurants, and hotels saw their summer revenues drop. The closing was in response to a sudden fish kill that resulted in hundreds of dead fish washing onto the banks of the Yellowstone River. Laboratory tests confirmed that there was an outbreak of proliferative kidney disease (PKD). It was theorized that because fish are particularly vulnerable to PKD when they are stressed, the river itself had contributed to the outbreak. There had been much less rain than normal in the summer of 2016, and greater-than-usual amounts of irrigation water had been drawn off the river. The drop in water level led to record-breaking low flows, and, as a result, water temperatures rose and stressed the fish. It is widely held that in their weakened condition, the fish were more susceptible to PKD than during typical summers. The parasite associated with PKD is always present in the river, so not everyone agreed with the theory that flows, temperatures, and irrigation led to the PDK outbreak. But regardless of the cause, the outcome was that the recreational economy was forced to suspend activities. Some members of the community voiced concerns that climate change was now affecting Paradise Valley and that business as usual was at risk. The veteran guide offered this comment:
Everybody seems to be asking, as guides and outfitters, do we do our jobs the same as we did ten years ago, or twenty years ago? And the answer is, definitely no … Our industry has really had to change in some fairly dramatic ways … I certainly read enough to recognize the signs of climate change, but I thought that’s in the future … People who have grandkids, their grandkids are sure going to have to deal with that issue. And I guess I’ve been somewhat shocked to realize that a decade later we are dealing with it pretty much on a day-to-day basis … I used to [take] lots and lots of phone calls from people saying, “When should I come to Montana?” The answer I gave them in 1995 is not the answer I would give them now. (Veteran Fishing Guide in Livingston 2018)
The economic impacts of the 2016 closure on Paradise Valley communities illustrated the importance of recreational opportunities for the local economy, and fishing guides were affected directly. Many of the local fishing guides accepted the closure as necessary to their long-term profitability (Chaney 2016); however, it was an immediate hardship and potentially a long-term profitability risk. The fishing guides began to wonder: What if drought conditions are worse next season? If we have another dry year, will there be another fish kill and another suspension of recreational activities? And how many guides can survive if fish kills become a common summer occurrence? The closure also revealed the vulnerability of communities throughout the greater Yellowstone River Valley who also depend on tourism and outdoor recreation for their economic sustainability.
Those who earn their living as guides and outfitters also wonder how the overall popularity of the river might change their industry. It might be possible to add boat launch facilities to accommodate the ever-increasing numbers of visitors, but what would the consequences of having even more people on the river be? Recreational managers have begun considering ways to control recreational access to the river in Paradise Valley (French 2020), and outfitters are wondering how that will affect their profits. They have seen the financial impacts of controlled access on the people who make their living by bringing tourists out into nature.
An example that illustrates the financial impacts of limiting access to a popular recreational location is that of the Smith River of Montana. The Smith River is a 59-mile river that flows north through central-western Montana, draining water from the Big Belt and Little Belt Mountains to the upper Missouri River. As the popularity of this river grew, the crowds prevented the peaceful enjoyment of nature and most users agreed that the quality of the recreational experience was greatly diminished. In 1989, the Smith River Management Act was enacted, and the state now defines how many people have access to the river each year. The state also limits use to only rafts, canoes, kayaks, and drift boats. The state employs a lottery system for dispensing access permits. The permits are relatively inexpensive, but the chances of drawing a permit are less and less each year. With 10,866 applications, “the Smith River experienced record-setting interest and visitation again in 2020” (Kluz 2021, 2). Trout Unlimited, a nonprofit conservation organization, reported that “the odds percentage of getting a permit in the lottery during the high-use season is now in the single digits” (Montana Trout Unlimited 2021). They also noted that outfitters, who previously paid no fees, now “pay $200/trip.”
If, as is the case in the Smith River, access in Paradise Valley becomes more expensive and permits are not announced until mid-February, outfitters and guides will need to adjust how they conduct business. They might not be able to accommodate loyal customers by booking their next trip a year in advance. They may also begin to face opposition in terms of use rights if the public feels they get more than their share (Danylchuk, Tiedemann, and Cooke 2017). From within, many of the local guides and outfitters are examining their practices and attempting to maintain the highest degree of recreational ethics, for both personal and business reasons:
As a guide, my level of river etiquette is maybe on a little bit higher level, I would like to think. And, this is speaking for all guides, I would hope. You know, I really try to give people their space. If you see a guy who doesn’t have guide stickers, just let him fish. Don’t try to cut him off. He’s not doing it every day. You don’t want to get a bad rep—especially me, being a young guide. And I work for other people, I don’t want to tarnish their name … And, I grew up here. I’ve family that’s been here for 100 years. So, you know, I care about protecting, keeping my office clean. There was one instance this summer, I was guiding, there were four or five of us guides, and we all had clients. It was a big corporate group … We pull over for lunch, and one of the fishermen in my buddy’s boat took a beer bottle and threw it over his shoulder onto the beach. And luckily it was a sandy beach, so it didn’t break. And the guides all just kind of looked at each other. Then my buddy Jeremy was like, “I’ll go get that.” And he set the bottle in his cooler. And, another one of my friends that was guiding said, “Hey, bud, how would you like it if someone came and threw a beer bottle in your office?” You know, so we try to keep it clean, because we’re trying to impress people with the area, so they come back. (Young Fishing Guide in Livingston 2018)
In Paradise Valley, economic and environmental sustainability are inextricably intertwined.
Long-Term Profitability of Oil and Gas Development
While it may seem odd to consider nonrenewable resources in a sustainability discussion, considering the not-yet-curbed consumptive habits of the country, this third sector of the economy of the Yellowstone River Valley, oil and gas development, remains important to the valley. As we did when considering agriculture, here we focus on the areas near the lower reaches of the river where, in the 1950s, the first oil wells in Montana were drilled. At that time, oil and gas were mostly being pulled from the Dakota formation, a geologic stratum rich with petroleum reserves (Hennip 1973). The most recent oil and gas boom in Montana involves the Bakken geological formation (Figure 2.7). While much of the Bakken field is located under western North Dakota, it also lies under northeastern Montana (U.S. Geological Survey 2013). The Bakken field is important to the entire United States because its total petroleum reserve is estimated to be one of the largest in the country. Some estimate this reserve as potentially sufficient to provide the United States with three years of energy independence—making the Bakken an extremely important petroleum reserve (DiLallo 2018).
The entire reserve is not recoverable (U.S. Geological Survey n.d.a). The Bakken field is approximately one mile underground and is made of tightly compressed shales. Current technologies cannot extract all the oil and gas held in the Bakken shales. In 2013, the United States Geological Survey (USGS) estimated that of hundreds of billions of barrels in the field, only a fraction, 7.4 billion barrels, were recoverable (U.S. Geological Survey 2013). However, by 2018, Continental Resources, the largest oil and gas producer in the Bakken, estimated that 30 to 40 billion barrels were recoverable (Scheid 2018). The new estimate is based on successful uses of hydraulic fracturing and horizontal drilling as recovery processes.
Anecdotal evidence of the anticipated long-term profitability of developing the Bakken field is found in the number of companies operating in the area. Nearly 40 companies were recently listed as active developers (Bakken Shale n.d.). Five producers dominate production: Continental Resources, EOG Resources, ExxonMobil, Hess, and Whiting Petroleum. These five producers operate internationally, and together they control nearly three million acres of leased minerals in the Bakken field (DiLallo 2016). They operate in Montana when oil and gas markets make production in the Bakken profitable, and they pause operations when the markets slow.

Figure 2.7 Map of Montana with Bakken counties (shaded)
Source: Gilbertz, Anderson, and Adkins 2020
Over the years, the counties in eastern Montana periodically experienced “booms” in oil and gas development. These booms were followed, each time, by a “bust” economy. Some locals are rather casual in how they describe the economic ups and downs caused by oil and gas development: “Agriculture is our stabilizing industry. And where you have the oil influence, and well developments, that comes and goes on a cycle of ten years. So, we’re on a growth spurt now, again” (Public Works Official in Sidney 2006). Many people in this part of the valley argue that their communities have profited from “good” boom cycles, and they report few concerns regarding the risks associated with oil and gas development (McEvoy et al. 2017). The booms are considered helpful in terms of employment and revenue to local businesses, even though the unevenness of the benefits over the years is also worthy of comment:
[The oil and gas industry brings us] a lot of jobs. Brings more business to town, and everybody gains—a lot of people gain, grocery stores and hotels. They bring a lot of money into the community … It makes the economy better, pretty much … [But with] this last boom, we pay more for tires. Everything went up. Groceries. Everything went up. Ninety percent of the people actually didn’t gain anything, but there are some people that did … Them other booms were small. There’s probably very little benefit, actually, when you think about it. The jail costs more, all our goods went up. A few people made money, [and] some local businesses did very well. But overall, it’s probably not that great. (Farmer near Glendive 2016)
Some benefits to the economy are measured by the public projects funded by oil and gas tax revenues. In 2018, a Commissioner from Richland County listed examples of new county infrastructure projects that had been paid for using county revenues from oil and gas development:
The county, to date, has put $45 million into directly affecting the city [of Sidney], and total, through the county, is $66 million. And that’s all from oil. And the beautiful thing about this is, there is no property tax that was associated with it. None of this has been paid for by the taxpayer. It’s all been paid for by oil severance monies. Every bit of it. That is, in my opinion, pretty good management on our part. We just got done with the senior citizens’ center/fire hall … for $2,200,000. They didn’t have to pass a bond; they didn’t have to raise anybody’s property taxes to pay for this … We are not in debt. We paid for this stuff as we went … We put $1.3 million in … streets and sidewalk upgrades. We just put a new sewer system in [the town of] Savage, as a matter of fact, for $650,000. All of that is cash money from the oil and gas monies. (Richland County Commissioner in Sidney 2018)
An important issue in the oil and gas industry is the need for water. As was true in the 1950s, oil and gas production requires the use of water to lubricate the drilling process. Today, each well drilled in the Bakken will descend approximately one mile. Then, with horizontal drilling, the boring will likely proceed another mile, or even two additional miles. Drilling muds, which are prepared with local water, are used as lubrication throughout the drilling process. Even more water is required to hydraulically fracture wells, a process that is especially needed in wells with horizontal sections. Highly pressurized “fracking” fluids, which are mostly water, are injected into wells to crack the compressed shale formation and release the oil and gas. The USGS estimates that across the United States, each oil and gas well requires anywhere from 1 to 16 million gallons of water for successful fracturing (U.S. Geological Survey n.d.b). The range is broad because of significant differences in the depth and length of wells across the United States.
To address this need for local water in the drilling process, water depots appeared on the landscape in eastern Montana during the Bakken boom. These depots sold water to the oil and gas producers. Also, some farmers sought to sell water originally designated for irrigation to oil companies in need of water for drilling purposes. In some cases, irrigation water was, perhaps illegally, hauled to drilling rigs. On an outing near the confluence with the Missouri River, a local made an off-hand comment about a passing truck. When asked for an explanation, the local clarified by describing a potentially illegal practice, “He’s not supposed to be doing that … He was filling his water tanks for the rigs right out of the irrigation ditch” (Local Historian in Fairview 2018).
Specific to the Bakken field, an industry report stated that most oil and gas wells in this region use one to five million gallons of water (Energy and Environmental Research Center n.d.), some of which is permanently removed from the system. While the water used for the fracturing process can be recovered, the processes for treating the water to rid it of chemicals and contamination are expensive. Most of the used water for fracking in the Bakken field is permanently disposed of by injecting it into abandoned oil and gas wells. Thus, fracking in the Bakken field is generally a consumptive use of water. The used water, known in the industry as industrial wastewater, is hauled to disposal depots or disposal wells where it is removed from the overall system of available water (Figure 2.8). At the peak of production in 2007, the DNRC issued 868 oil drilling permits, the majority of which were for wells in the Bakken field (Montana Board of Oil and Gas Production 2007). One can calculate that the resulting need for water assuredly exceeded 800 million gallons in that single year.
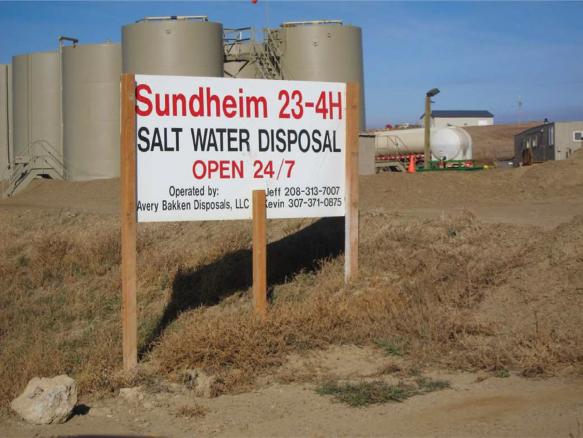
Figure 2.8 Disposal depot in Bakken region
The town of Sidney, home to fewer than 6,000 people, is nonetheless subject to economic cycles resulting from global industrial forces. Decisions by the Organization of the Petroleum Exporting Countries, which includes Saudi Arabia, Iran, Iraq, and Venezuela, will determine whether oil production in the Bakken booms or busts. Widely known in eastern Montana is this: when the price of oil drops, their communities feel it. Moreover, careful analyses have even shown that, over the long run, these boom-and-bust cycles do not generally benefit the local communities or their economies (Haggerty et al. 2014). Other studies have shown that only a few individuals in the local community are focused on the exploitive aspects of development spurred by transnational corporations and global dynamics (Gilbertz, Anderson, and Adkin 2020). Even so, these things are clear: the boom-and-bust nature of the industry is unlikely to change, and with each drilling boom, demands for water will spike too.
The three economic sectors of the valley examined in this chapter force us to think about how these practices should proceed: Can we maintain the long-term profitability of these sectors without compromising the ability of future generations to meet their economic needs? All three depend on the resources of the river. Can they all proceed without adaptation, or is it more likely that they will be in competition with one another for water resources?
Discussion Questions
Our brief examination of practices in the lower reaches of the Yellowstone River Valley leaves us with several questions to consider regarding the long-term profitability of agriculture:
1. What factors will allow agriculture to remain a sustainable sector of the economies of Prairie, Dawson, and Richland Counties?
2. Are current practices involving water, fertilizers, and pesticides sustainable? If not, what adjustments should we ask the agricultural community to make?
3. Is it reasonable to ask the agricultural community to risk long-term profitability for the benefit of future generations?
Regarding tourism and fishing near Livingston, we might ask:
1. Will closed recreational access, to save the fish, result in lost jobs throughout the county, temporarily—or even permanently?
2. What can the larger valley learn about economic sustainability from the Paradise Valley fish kill of 2016?
Regarding the oil and gas industry, we ask these sustainability questions:
1. Does oil and gas development constitute a sustainable economy?
2. How do the boom-and-bust cycles diminish the local sustainability of this industry?
3. How do technologies affect the sustainability of the industry?
4. What global factors influence the profitability of oil and gas production in eastern Montana?
5. Is this industry’s consumptive use of water a serious concern?
Also:
1. How do the comments from locals concerning agriculture, tourism, and oil and gas development illustrate sensitivity to sustainability’s central question?
Easy Access Resources
Fertilizer and Pesticide Use in the United States: https://gro-intelligence.com/insights/a-look-at-fertilizer-and-pesticide-use-in-the-us#Fertilizer
Institute for Tourism and Recreation Research at the University of Montana: https://scholarworks.umt.edu/itrr_pubs/
Nonpoint Source Pollution from Agriculture: www.epa.gov/nps/nonpoint-source-agriculture
United States Bureau of Reclamation—Projects and Facilities: www.usbr.gov/projects/
United States Geological Society, Map of Bakken: https://pubs.usgs.gov/fs/2013/3013/fs2013-3013.pdf
Yellowstone River Basin Water Plan, 2014: http://dnrc.mt.gov/divisions/water/management/docs/state-water-plan/yellowstone/river-basin-plan/yellowstone_river_basin_report_final.pdf
Short: The Yellowstone River Fish-Kill, 2016 https://nps.gov/articles/the-yellowstone-river-fish-kill.htm
Yellowstone River Interactive Map http://montana.maps.arcgis.com/apps/webappviewer/index.html?id=3fc5b219f4494ebab2477e93a5bbecca